Lecture 16: Forces and Energy Cost in Locomotion
Slide 1
- Bridges the muscle physiology unit (Lectures 11–15) to the whole-organism mechanics of locomotion.
- Goal: connect force and mechanical energy demands of movement to the muscular and metabolic energy demands that follow.
Slide 2
Learning Objectives
- Describe the basic mechanical demands of legged locomotion and how they relate to the force and mechanical work demands of bipedal gaits.
- Describe how force demands of gait vary with speed and body size.
- Discuss how leg posture influences the muscle force required relative to the external ground reaction force.
Slide 3
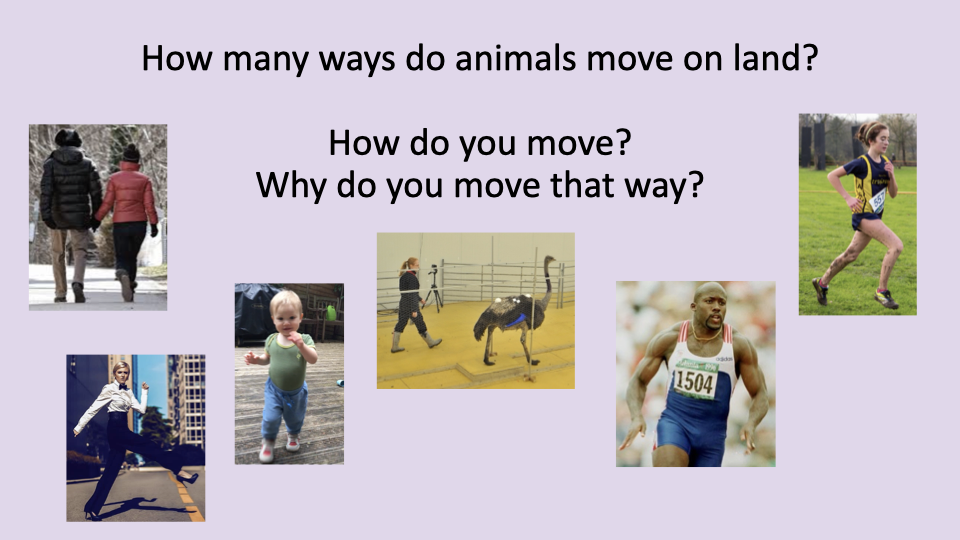
Why Do We Move the Way We Move?
- Animals exhibit a surprisingly small number of characteristic terrestrial gaits — most can be identified from a single snapshot.
- The convergence on a few stereotyped patterns suggests that physical principles (not just anatomy or development) constrain efficient locomotion.
Slide 4
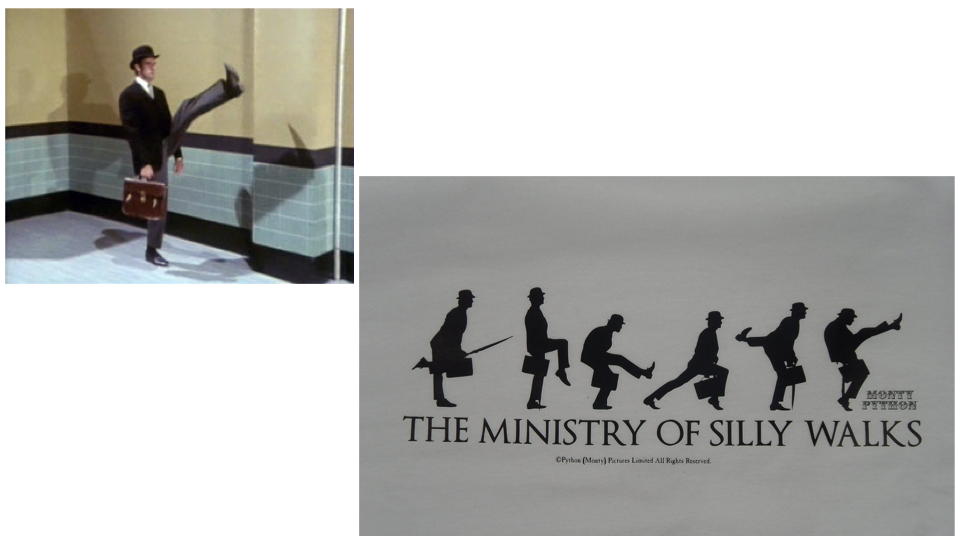
The Ministry of Silly Walks
- Humans are not physically constrained to walk the way we do — many other patterns are mechanically possible.
- The fact that we converge on a narrow set of gaits underscores that the patterns we use are energetically favored, not anatomically forced.
- Modern AI-based gait recognition exploits the small individual signature embedded in the otherwise stereotyped pattern.
Slide 5
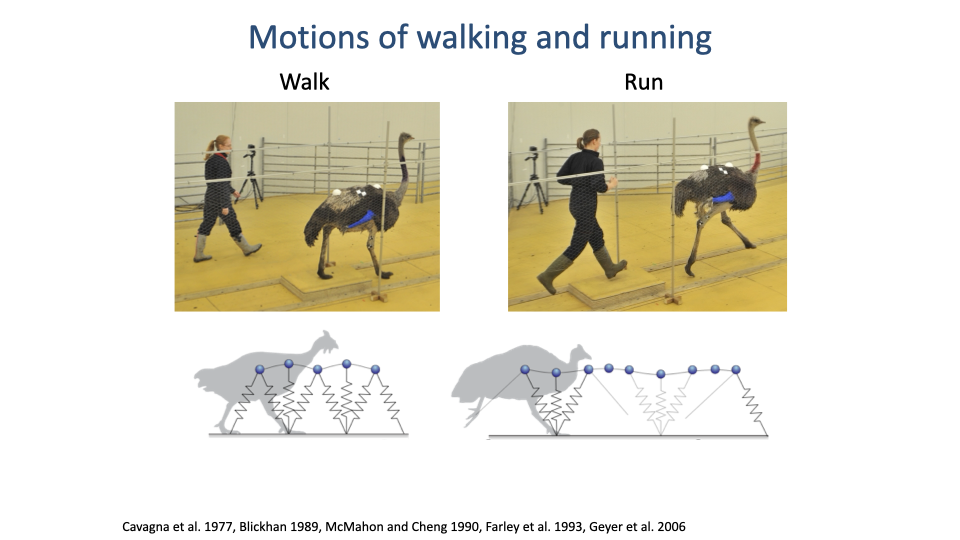
Walking and Running — Same Patterns Across Species
- Despite very different morphologies, humans and ostriches show essentially the same dynamics for walking and for running.
- The schematics introduce the mass-spring model of locomotion that will recur throughout the lecture.
Slide 6
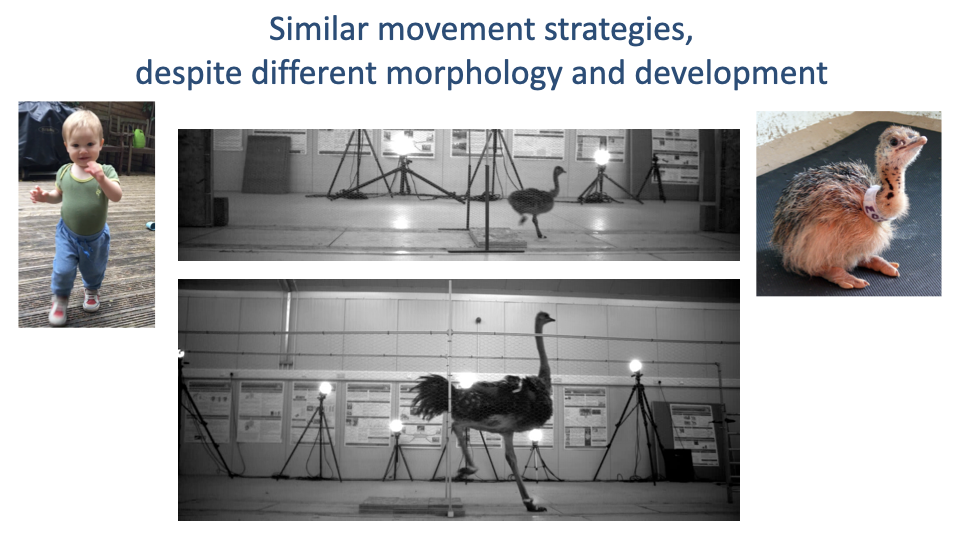
Convergence Despite Different Development
- A young ostrich (a few weeks old) shows the same gait dynamics as the adult — only scaled in body size.
- Humans take many months and many practice steps to learn to walk, yet converge on similar mechanics as a precocial bird that walks shortly after hatching.
- Strong evidence that fundamental physical principles — not just developmental learning — drive the choice of gait.
Slide 7

Setting Up the Physical Framework
- Transition slide. The remainder of the lecture develops the basic physical demands of legged movement and uses them to predict gait mechanics.
Slide 8
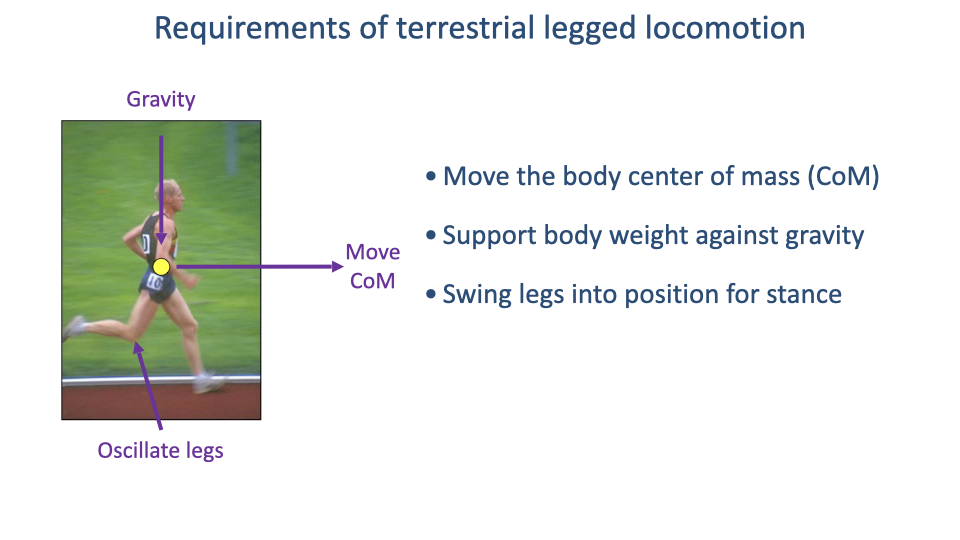
Three Basic Demands
- Move the center of mass from point A to point B.
- Support body weight against gravity throughout each stance.
- Oscillate the legs to position them for the next stance phase.
- These three constraints are the foundation for understanding all the force and energy patterns of gait.
Slide 9
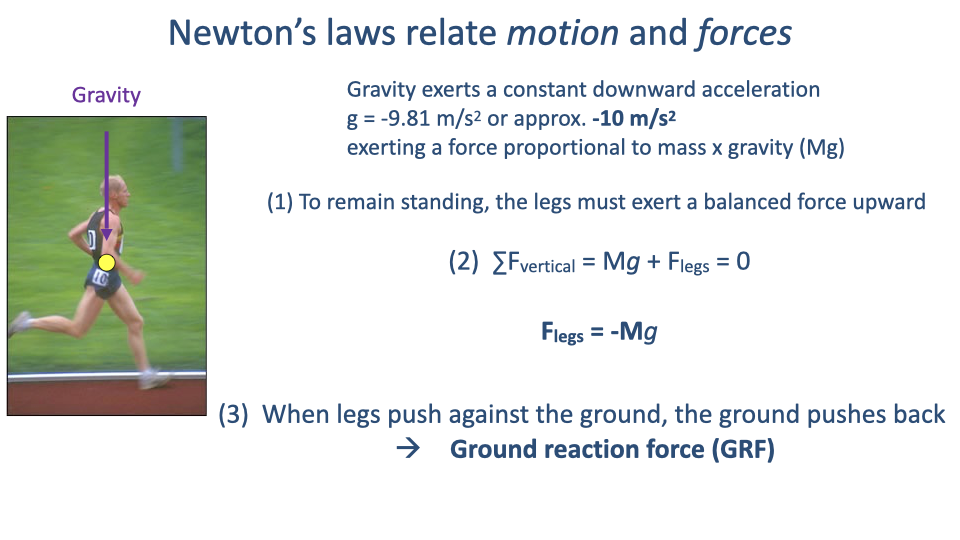
Newton’s Laws and the Ground Reaction Force
- Vertical equilibrium across a complete stride requires:
- The ground reaction force (GRF) is the equal-and-opposite force the ground exerts on the foot — measured directly by a force platform.
- Averaged over an integer number of strides, vertical GRF must equal body weight; horizontal GRF must average zero at constant speed.
Slide 10
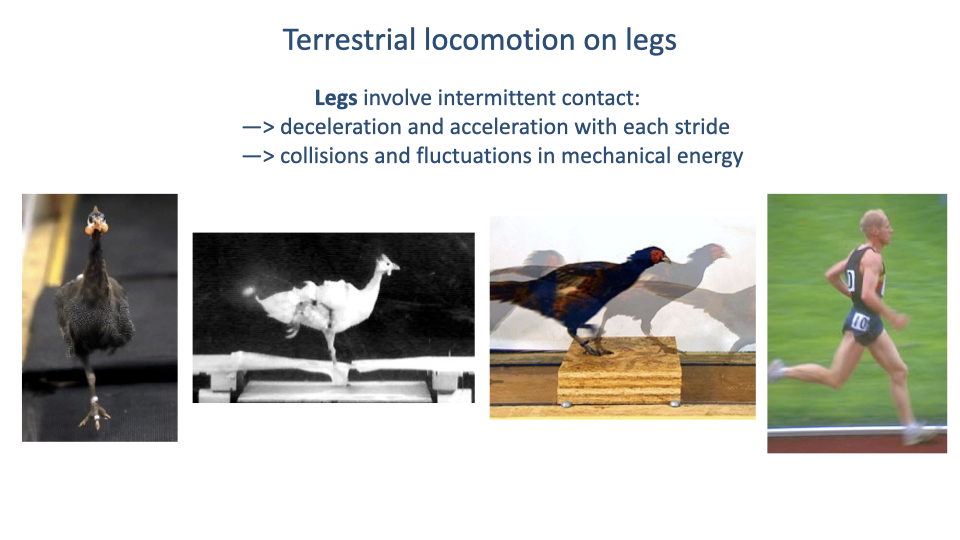
Why Legs Are Different from Wheels
- Legs involve intermittent ground contact: each step decelerates and re-accelerates the body.
- This creates collisional energy losses at each foot-down event — a key driver of the muscular work demand explored later in the lecture.
Slide 11
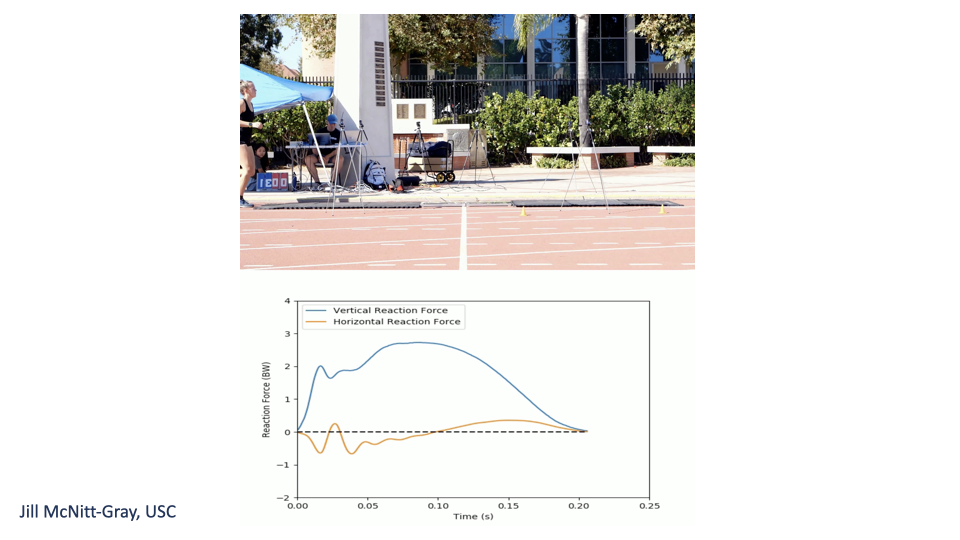
Measuring Ground Reaction Forces
- A force platform embedded in the track measures the GRF during one stance phase.
- The vertical GRF is largest in magnitude (multiple body weights at peak).
- The horizontal GRF is biphasic: negative (decelerating) at heel strike, positive (accelerating) at push-off.
Slide 12
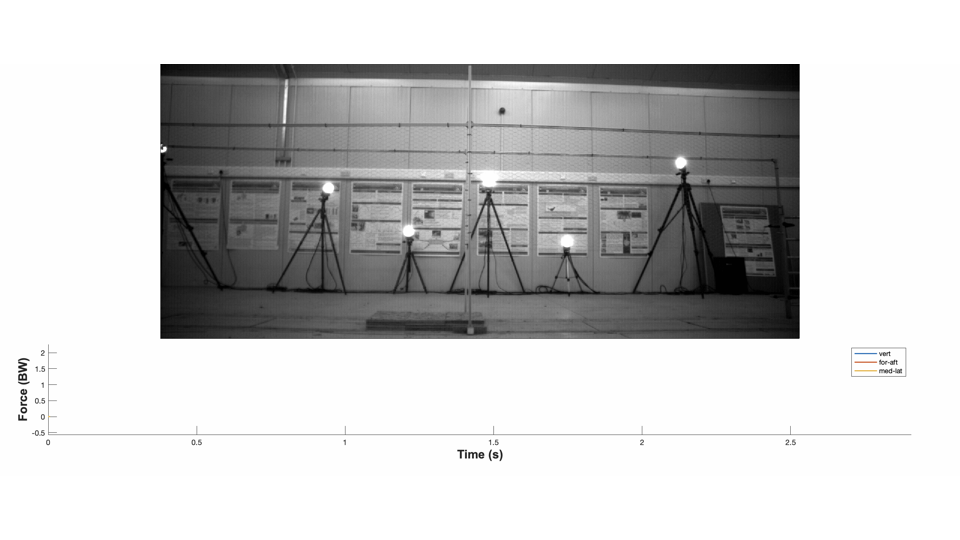
Multi-Plate Force Measurement Setup
- Sequential force plates allow measurement of GRF across several consecutive steps, enabling analysis of the full stride cycle and any unsteady (accelerating, perturbed) movements.
- The same paradigm is used in animal experiments and in human gait labs.
Slide 13
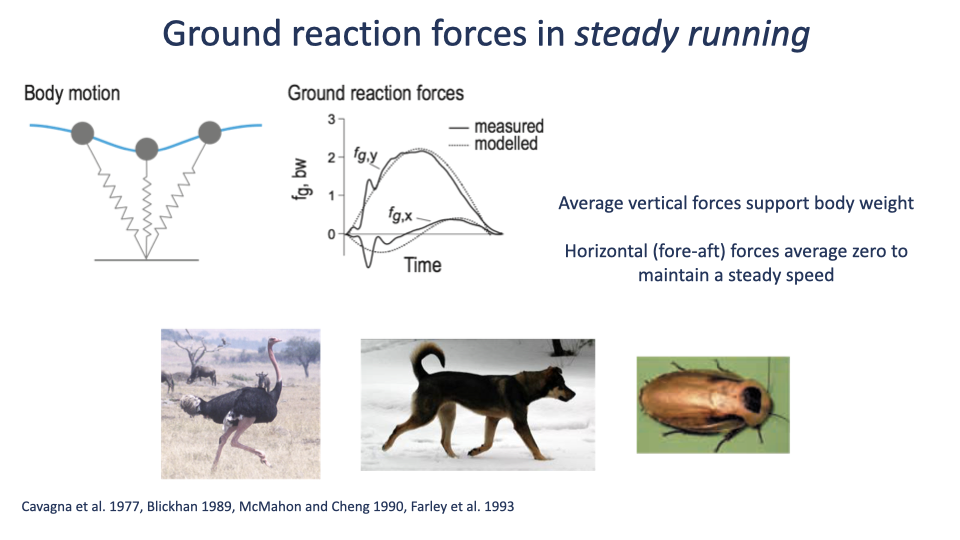
The Mass-Spring Model of Bouncing Gaits
- A single point mass on a massless springy leg reproduces both the magnitude and the timing of GRF in steady locomotion.
- Holds across an enormous range of legged animals — cockroach, dog, ostrich, human — for bouncing (running, hopping, trotting) gaits.
- For multi-legged animals, all stance limbs are approximated as a single virtual leg.
Slide 14
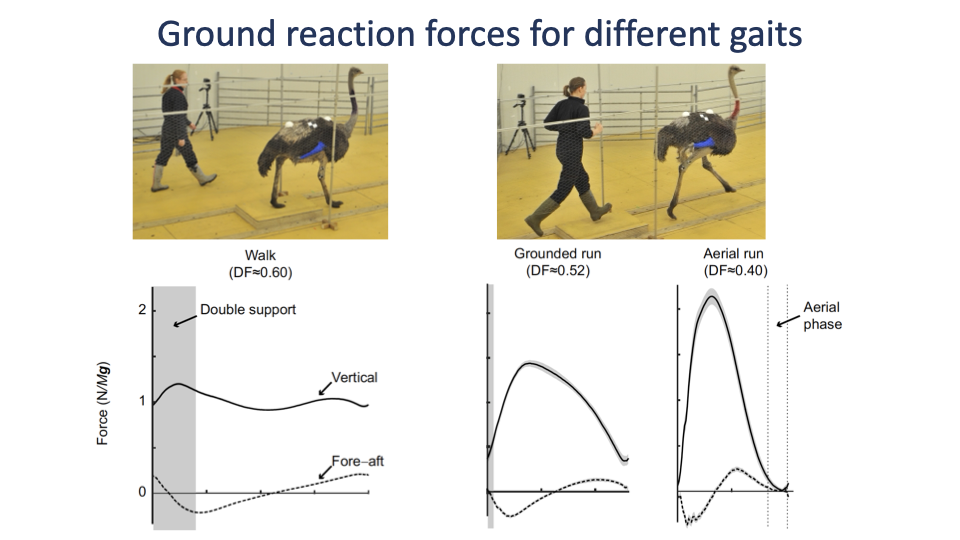
Walk vs. Grounded Run vs. Aerial Run
- Walking: characteristic M-shaped vertical GRF with a double-support phase (both feet on the ground).
- Grounded run (e.g., race-walking): single GRF peak, but no aerial phase — duty factor still > 0.5.
- Aerial run: tall single GRF peak with a true aerial phase between steps; peak force grows because stance duration shrinks as speed increases (Slide 27).
Slide 15
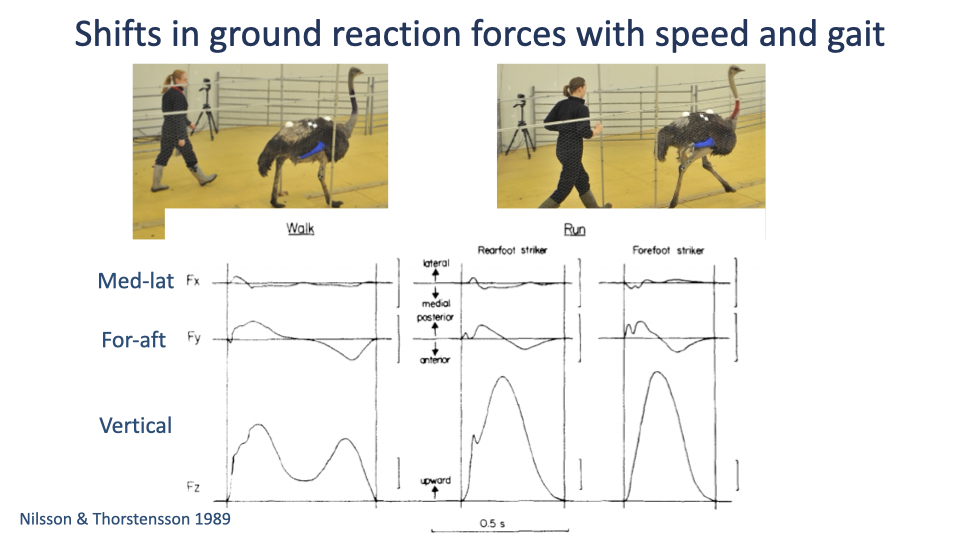
Foot-Strike Pattern and Impact Peaks
- Rear-foot strikers (heel contact first) show a brief early impact peak in the vertical GRF — caused by the abrupt collision of a relatively rigid heel.
- Forefoot strikers show a smoother rise because the foot’s arch acts as a spring to cushion the contact.
- Rear-foot striking became common with the invention of running shoes — most barefoot running is forefoot-strike.
Slide 16
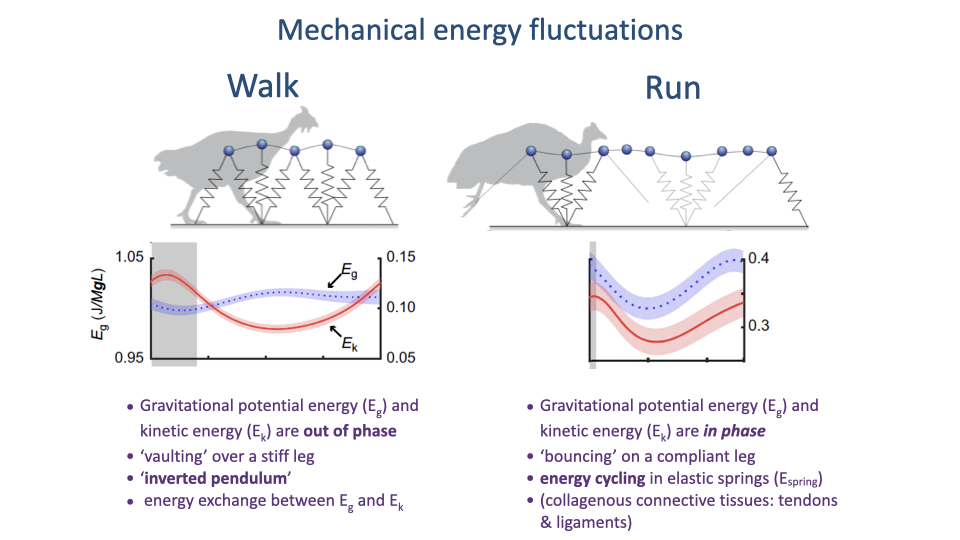
Walk = Inverted Pendulum; Run = Bouncing Spring
- Walking: Eg and Ek are out of phase — the body vaults over a stiff leg, exchanging gravitational potential and kinetic energy like an inverted pendulum. Little muscular work needed within stance.
- Running: Eg and Ek are in phase — the body bounces on a compliant leg. The mechanical energy lost from the body is stored elastically in tendons and ligaments and returned at push-off.
Slide 17
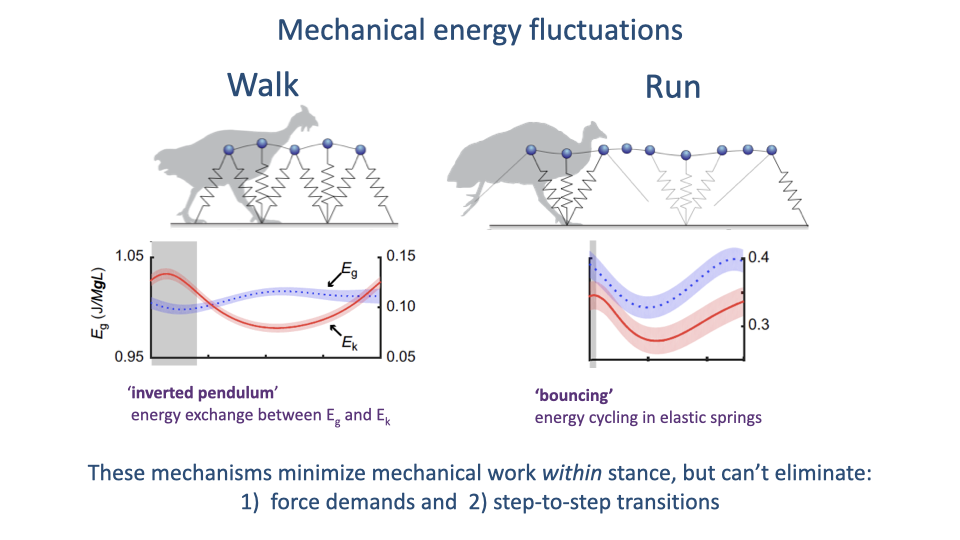
What Passive Cycling Cannot Eliminate
- Both inverted-pendulum (walk) and elastic-spring (run) mechanisms minimize the mechanical work the muscles must do within the stance phase.
- They cannot eliminate two demands:
- Force demands to support body weight.
- Energy losses at step-to-step transitions (collisions when the next foot lands).
- These two unavoidable demands set the minimum muscular work of locomotion.
Slide 18
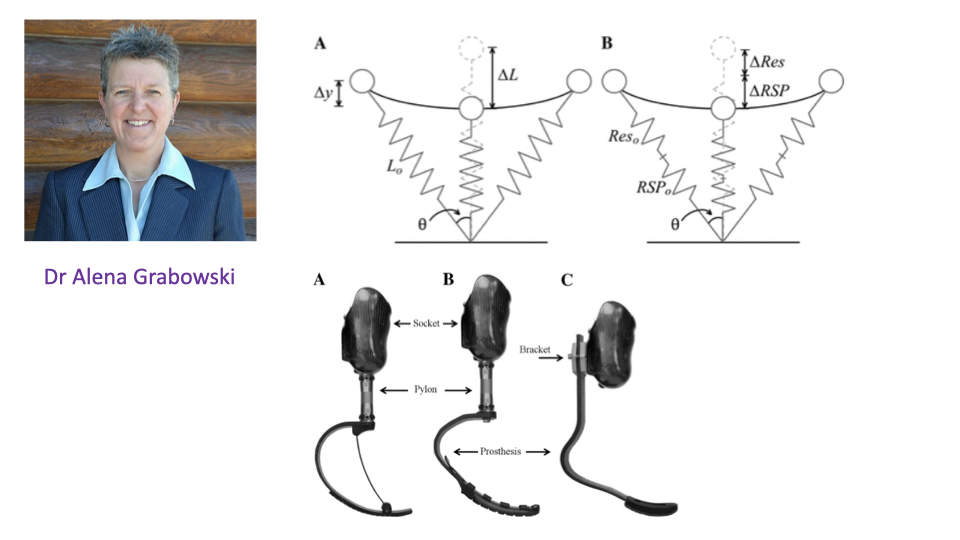
Prosthetic Limbs as Mass-Spring Systems
- The mass-spring model of running motivates the design of carbon-fiber running blades for athletes with transtibial amputations.
- Three blade designs (1E90 Sprinter, Catapult FX6, Cheetah Xtend) have very different stiffnesses, which can be tested directly against the model.
Slide 19
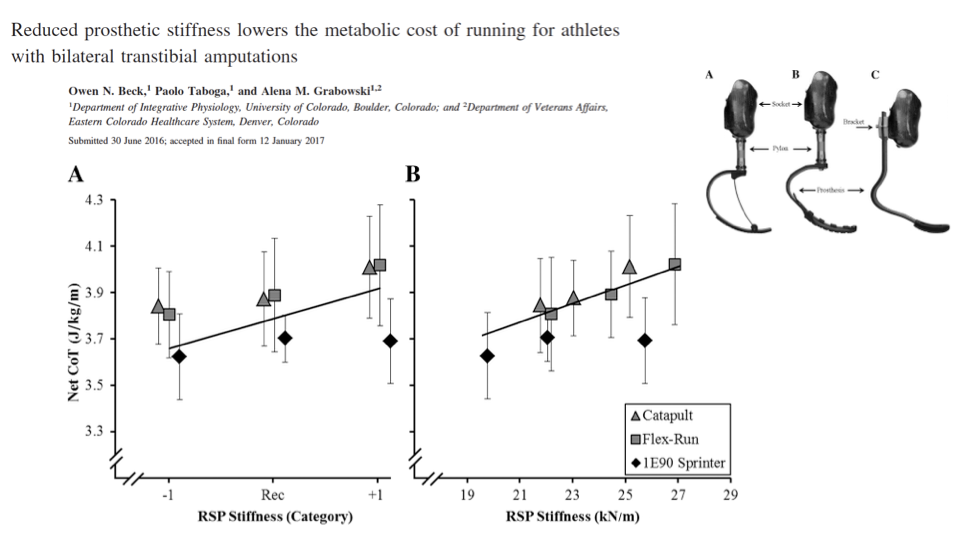
Lower Prosthetic Stiffness Lowers Running Cost
- Across three blade types, stiffer prostheses raise the net cost of transport for running.
- A more compliant blade allows greater elastic energy cycling, mimicking the natural Achilles tendon’s energy-storage function.
- A direct application of the mass-spring framework: simple physics-based models can guide assistive-device design.
Slide 20
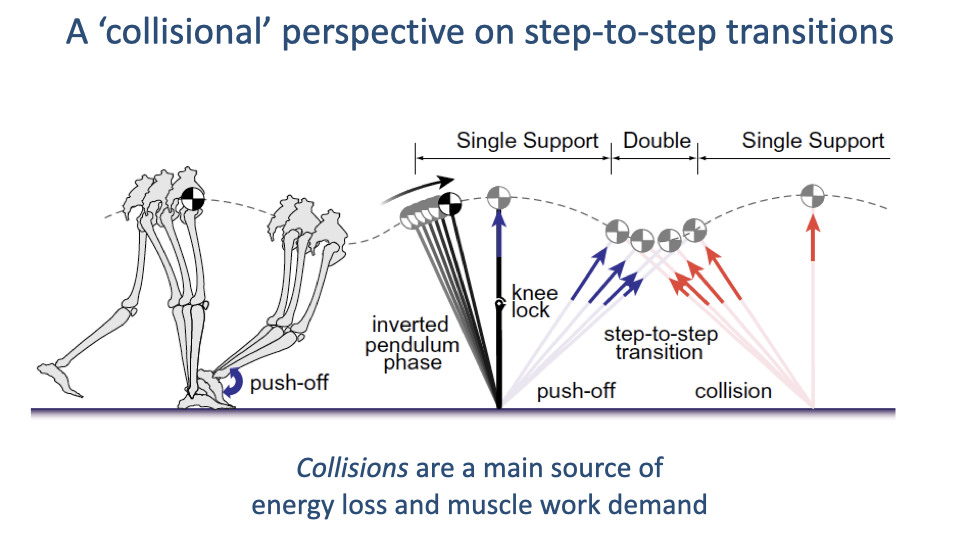
The Collisional Perspective
- During the double-support phase of walking, the trailing leg pushes off while the leading leg collides with the ground.
- Push-off adds mechanical energy; the collision dissipates energy.
- The amount of push-off work needed is directly proportional to the collisional energy loss — making collisions the central determinant of muscular work in walking.
Slide 21
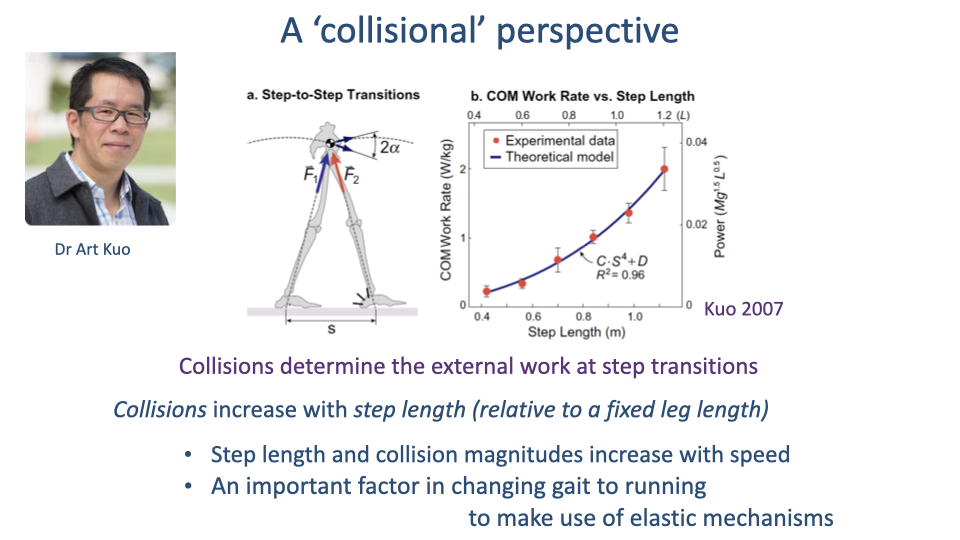
Collision Cost Scales as Step Length to the Fourth Power
- Center-of-mass work scales roughly as step length to the fourth power, with R² = 0.96.
- As walking speed (and step length) increases, the collisional cost explodes — a major reason humans switch to running at higher speeds, where elastic mechanisms can offset some of the cost.
Slide 22
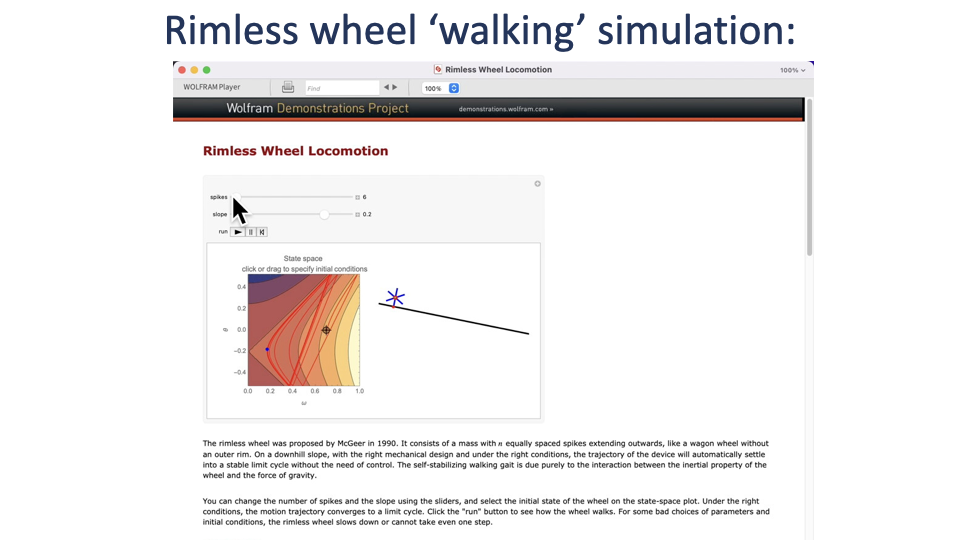
Rimless Wheel — A Mechanical Demonstration of Collisions
- A rimless wheel with n spikes rolling down a fixed slope is a simple physical model of legged walking.
- With fewer spokes (longer effective step length), more energy is lost at each collision and the wheel rolls slower.
- With more spokes (shorter steps), collisions are smaller and the wheel rolls faster.
- The slope is constant, so this isolates the effect of collision geometry on speed.
Slide 23
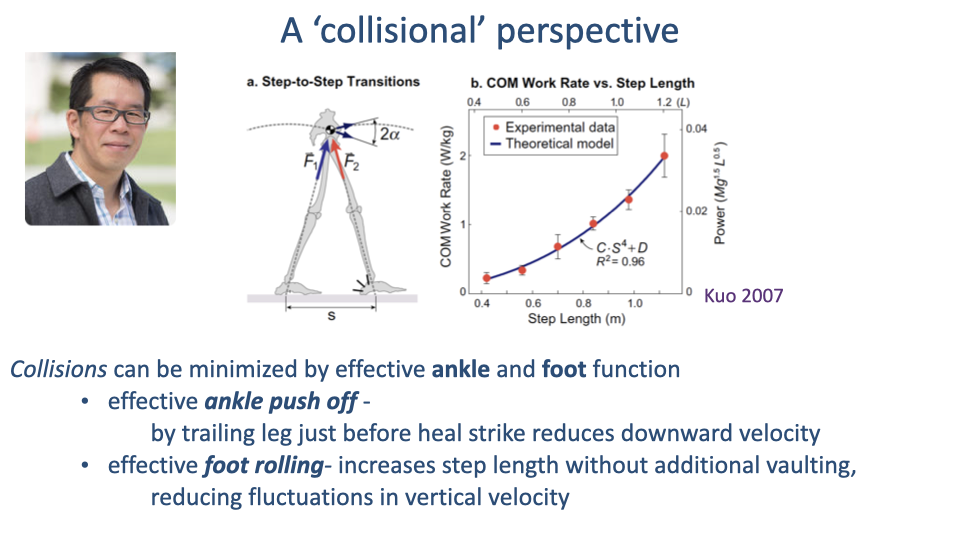
Two Ways to Reduce Collisional Cost
- Ankle push-off by the trailing leg just before heel strike of the leading leg reverses some of the body’s downward velocity, shrinking the upcoming collision.
- Foot rolling during stance — the human foot’s plantar geometry acts like a wheel, translating the center of pressure smoothly from heel to toe.
- A demonstration with two seven-sided polygons (one with concave sides, one with convex sides) shows that even small convex curvature on the contact surface dramatically reduces collisional losses — a simple mechanical explanation for why human feet are large and curved (see also Adamczyk, Collins & Kuo studies of foot curvature).
Slide 24
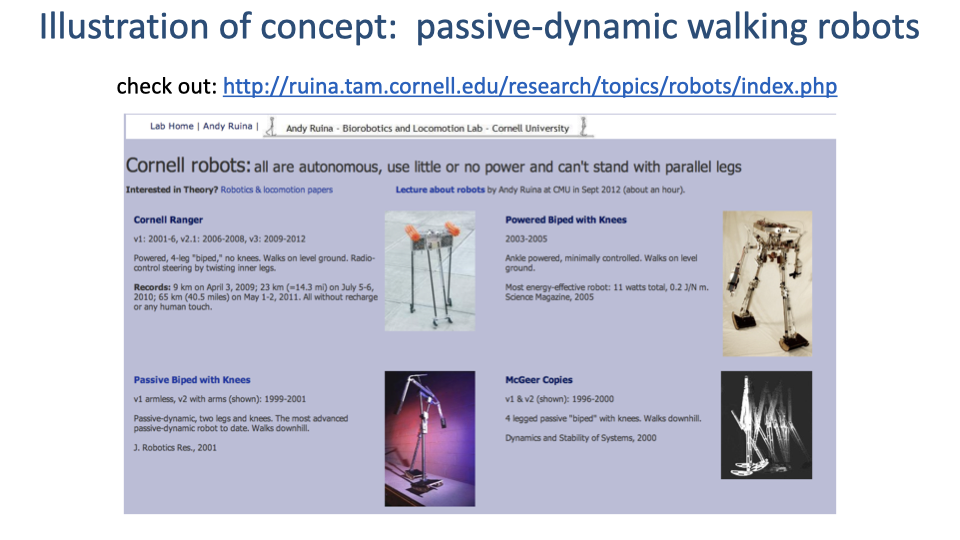
Passive-Dynamic Walking Robots
- Robots designed around the same principles — minimal actuation, rolling foot contact, ankle push-off, locked knees during mid-stance — can walk reasonably well on essentially no power.
- McGeer’s classic passive walkers descend a slope powered only by gravity.
- Concrete demonstration that the physics of collisions and elastic cycling are the dominant determinants of bipedal walking — not active neural control.
Slide 25
Transition — Forces and Speed
- Transition into the next section: how GRF magnitudes scale with running speed.
Slide 26
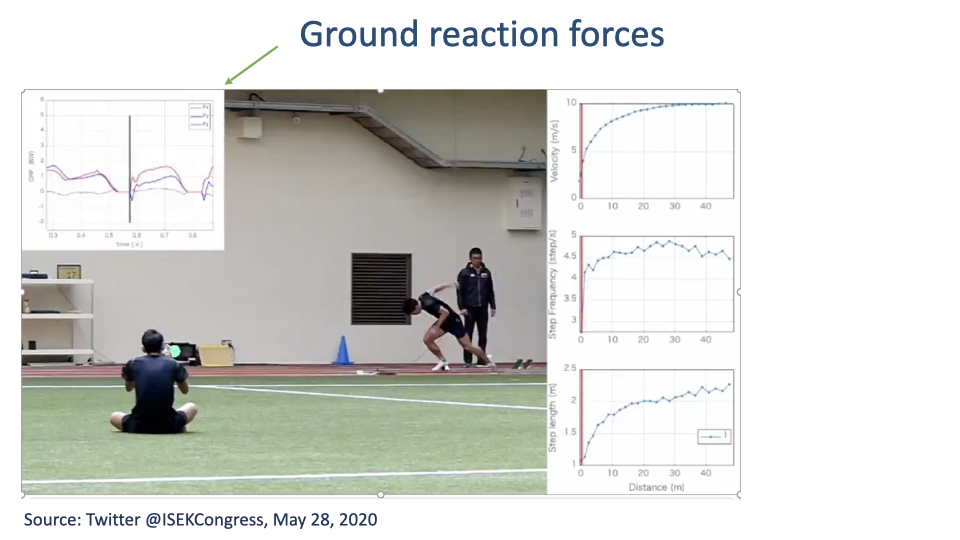
Acceleration vs. Steady Speed
- During the acceleration phase, the fore-aft GRF is net positive at every step — the runner is adding energy.
- As the runner reaches a steady speed, the fore-aft GRF shifts to its standard biphasic pattern (negative then positive, net zero).
- Posture also shifts — a forward lean during acceleration straightens out at steady speed.
Slide 27
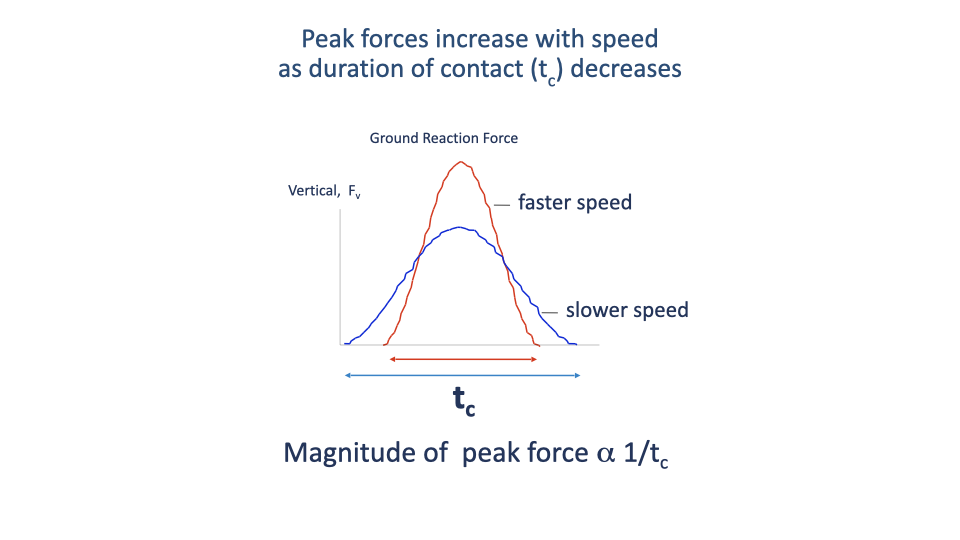
Why Peak Force Grows with Speed
- Average vertical GRF must equal body weight across each step.
- As speed rises, the stance time tc shrinks and the aerial time grows — so the peak vertical force must rise to keep the time-integrated average constant.
- Roughly: peak GRF $\propto 1/t_c$.
Slide 28
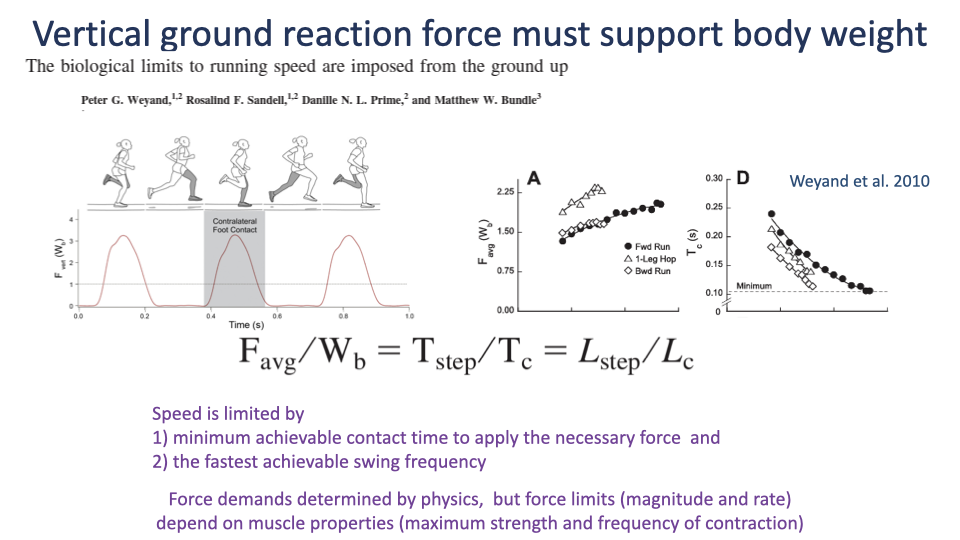
What Limits Top Running Speed
- The required average vertical GRF can be predicted from gait timing alone:
- Across normal running, one-legged hopping, and backward running, this relationship holds.
- Top speed is set by:
- The minimum achievable contact time to apply the necessary force.
- The fastest achievable swing frequency.
- Force demands come from physics; force limits come from muscle strength and contraction frequency.
Slide 29
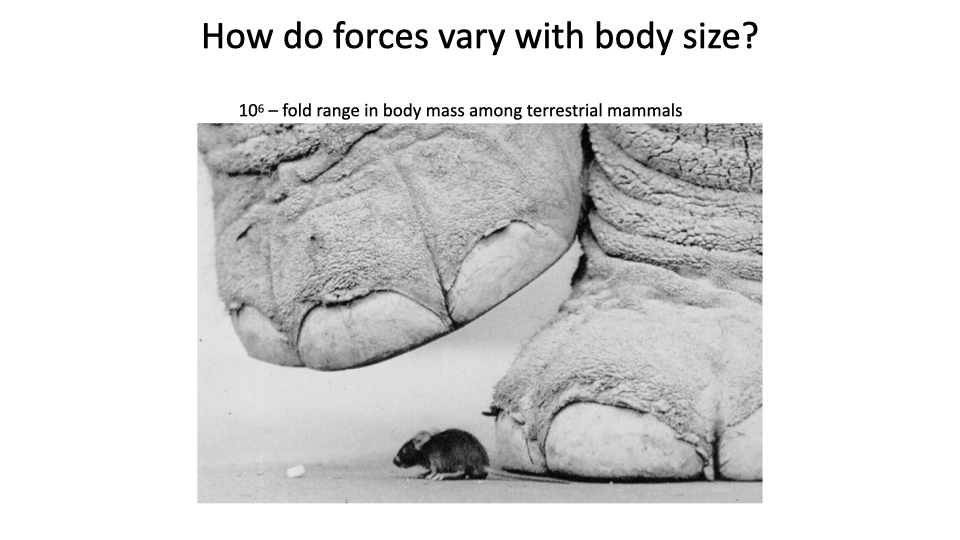
Scaling Across Body Size
- Terrestrial mammals span a ~106-fold range in body mass (mouse to elephant).
- Across this enormous range, the physics of legged locomotion demands very different postural and architectural solutions — the topic of the next slides.
Slide 30
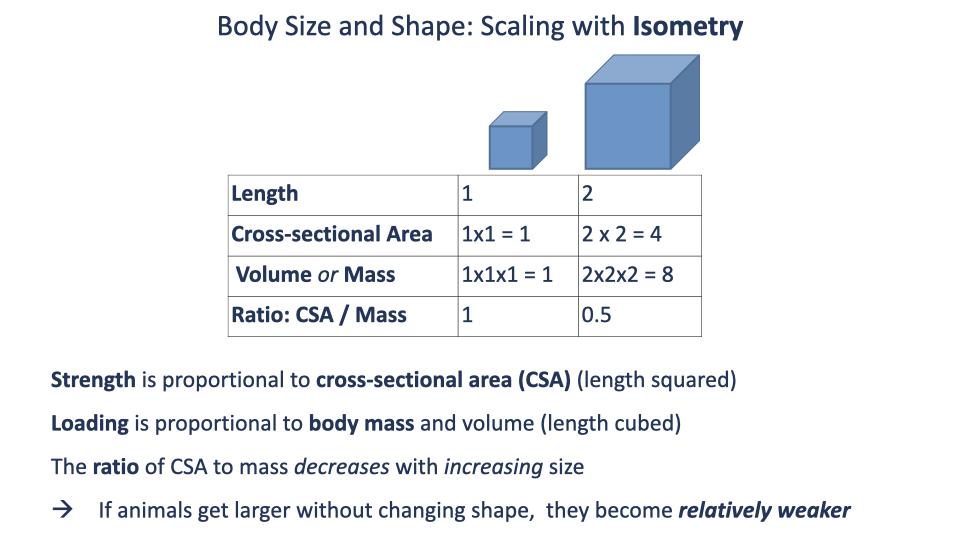
Geometric Scaling — Why Bigger Animals Are Relatively Weaker
- Strength scales with cross-sectional area (length2).
- Body mass (and weight loading) scales with volume (length3).
- The ratio CSA / mass ∝ 1/length — so larger isometric animals are relatively weaker.
- Without compensating shape change, an elephant-sized animal would lack the structural margin to support its own weight.
Slide 31
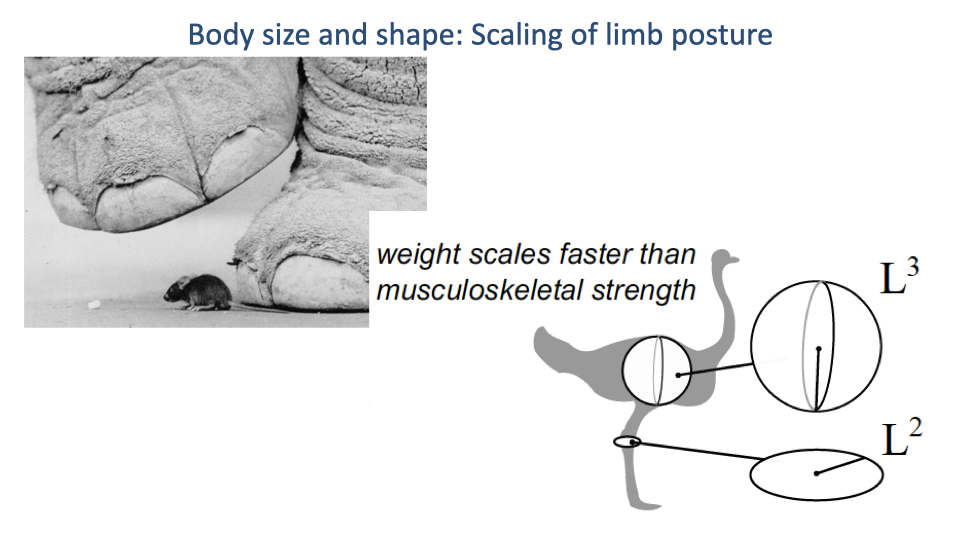
How Animals Solve the Scaling Problem
- Larger animals change shape rather than scaling isometrically — bones become proportionally thicker, and limb postures become more upright.
- Sets up the key scaling relationship of the next slide: effective mechanical advantage.
Slide 32
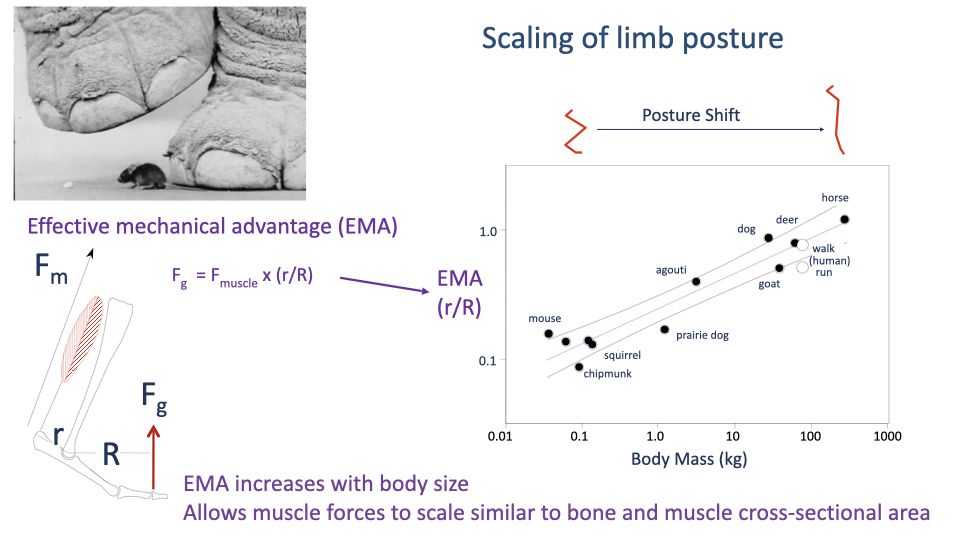
Effective Mechanical Advantage Scales With Body Size
- Effective mechanical advantage:
- Larger animals adopt straighter limb postures that increase EMA — moving the GRF closer to the joint center, reducing the muscle force required.
- Across mammals, EMA scales positively with body mass — allowing peak muscle (and bone) forces to scale with cross-sectional area, preventing structural failure.
- (This is the same Biewener 1989 result reviewed in Lecture 14.)
Slide 33
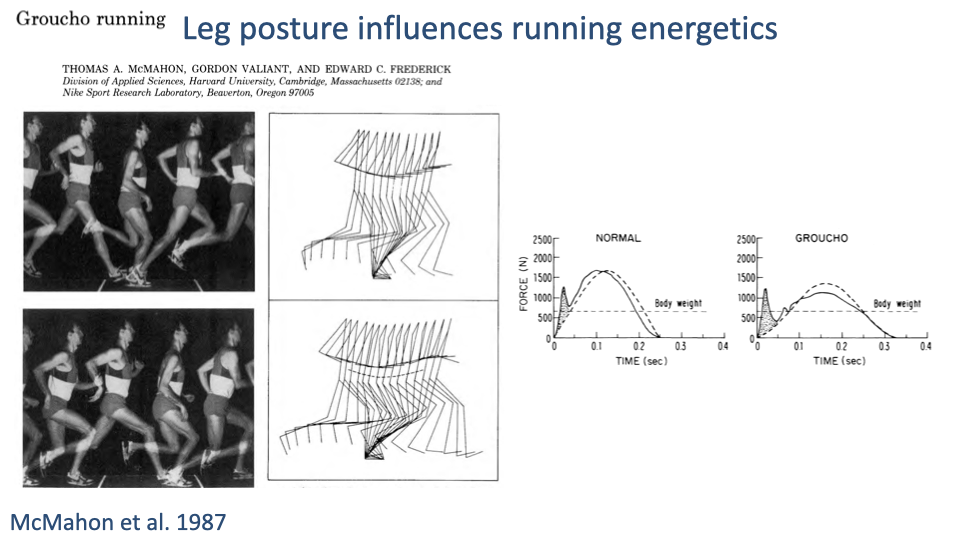
Crouched Posture Raises Muscular Effort
- McMahon’s classic Groucho running experiment: subjects run with deliberately flexed knees.
- Crouched posture moves the GRF moment arm R further from the joint center → larger muscle force required for the same GRF.
- Vertical GRF profiles also become smoother (reduced impact peak) — but at a steep metabolic cost.
Slide 34
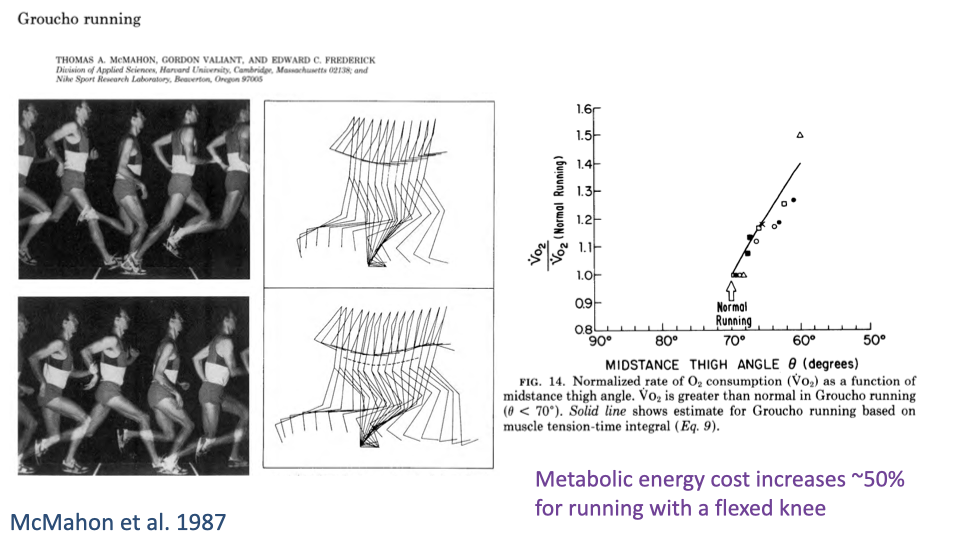
Groucho Running Costs ~50% More Energy
- Running with a deeply flexed knee raises the metabolic cost of running by ~50% above normal upright posture.
- The mechanism is exactly the lever-system equation $F_{muscle} = F_g \times R/r$ — a larger R demands a larger muscle force, which costs more ATP per stride.
- A direct demonstration that leg posture is a primary determinant of the energy cost of locomotion.
Slide 35
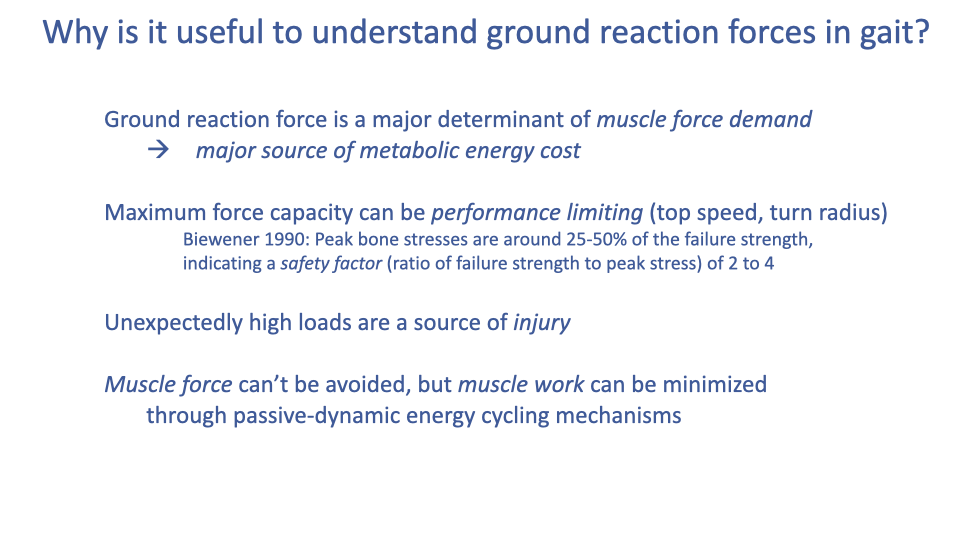
Why GRF Matters
- GRF magnitude sets the muscle force demand — and hence the metabolic energy cost.
- Maximum force capacity can be performance-limiting (top speed, sharpest turn radius).
- Skeletal safety factor is typically 2–4 — peak bone stress is normally 25–50% of failure strength; unexpectedly high loads cause injury.
- Muscle force can’t be avoided, but muscle work can be minimized through passive-dynamic energy cycling (springs, pendulums).
Slide 36
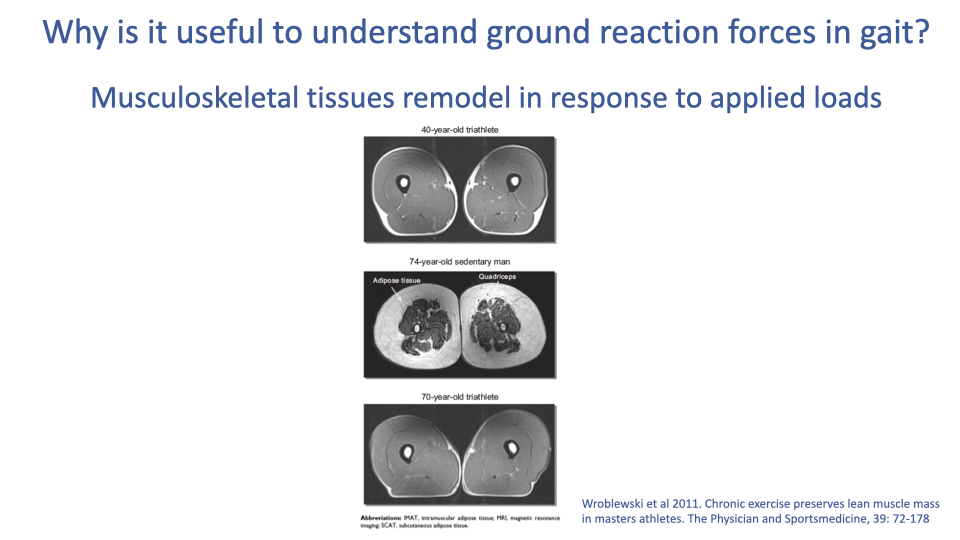
Tissue Remodeling Across the Lifespan
- Musculoskeletal tissues remodel in response to applied loads — both during training (Lecture 15) and across the lifespan.
- The MRI cross-sections compare three subjects at the same anatomical level:
- 40-year-old triathlete: large quadriceps, minimal adipose.
- 74-year-old sedentary: small quadriceps, extensive intramuscular and subcutaneous adipose.
- 70-year-old triathlete: quadriceps essentially indistinguishable from the 40-year-old.
- Chronic exercise preserves lean muscle mass into older age — strong evidence for the role of mechanical loading in long-term tissue maintenance.
Slide 37
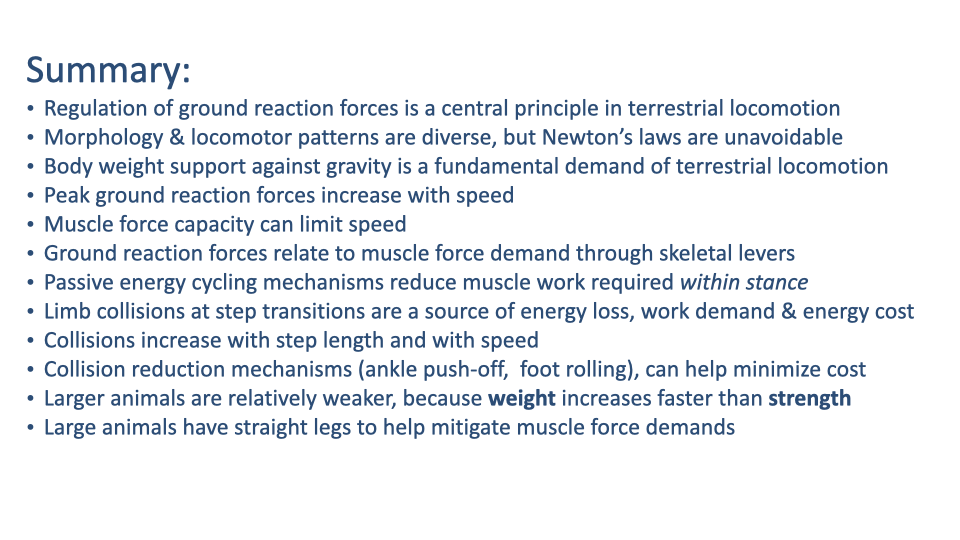
Summary
- The regulation of GRFs is the central principle of terrestrial locomotion. Newton’s laws are unavoidable.
- Body-weight support against gravity is a fundamental demand; peak GRFs rise with speed because contact time shrinks.
- Muscle force capacity can limit running speed and turning ability.
- GRFs translate into muscle force demands through skeletal lever systems (Lecture 13–14 EMA framework).
- Passive-dynamic energy cycling (inverted pendulum, elastic spring) reduces muscle work within stance — but cannot eliminate force demands or step-to-step collisions.
- Collisions at step-to-step transitions are the dominant source of mechanical work demand; they grow with step length (~s4) and with speed.
- Ankle push-off and foot rolling reduce collision losses.
- Larger animals are relatively weaker by isometric scaling and compensate with straighter limb postures (higher EMA).
Key Equations
| Equation | Name | Description |
|---|---|---|
| $\sum F_{vertical} = Mg + F_{legs} = 0$ | Vertical force balance | Average vertical force from the legs equals body weight across an integer number of strides. |
| $F_{avg}/W_b = T_{step}/T_c = L_{step}/L_c$ | Weyand step-cycle equation | Predicts the average vertical GRF (in body weights) from the ratio of step duration to stance duration. |
| $F_{peak} \propto 1/t_c$ | Peak force vs. contact time | As speed rises, contact time shrinks and peak vertical GRF must rise to maintain weight support. |
| $\text{COM work} \propto s^4$ | Kuo step-length scaling | Center-of-mass work rate at step transitions scales approximately as the fourth power of step length. |
| $F_{muscle} = F_g \times R/r$ | Limb lever equation | Muscle force needed to balance the GRF at a joint, with r = muscle moment arm and R = GRF moment arm. |
| $\text{EMA} = r/R$ | Effective mechanical advantage | Ratio of muscle to GRF moment arms; rises with body mass as posture straightens. |
| Strength $\propto L^2$, Mass $\propto L^3$ | Isometric scaling | Strength grows with surface area, mass with volume — larger isometric animals are relatively weaker. |
Glossary of Key Terms
| Term | Definition |
|---|---|
| Center of mass (CoM) | The single point at which the body’s mass can be approximated as concentrated for whole-body dynamics. |
| Ground reaction force (GRF) | The force the ground exerts on the foot — equal and opposite to the force the foot exerts on the ground (Newton’s 3rd law). |
| Force platform | An instrumented plate that measures the three components (vertical, fore-aft, medio-lateral) of GRF in real time. |
| Stance phase | The portion of the stride cycle when the foot is on the ground. |
| Aerial phase | The portion of the stride cycle when no foot is on the ground (running, hopping). |
| Double support | The portion of a walking stride when both feet are on the ground. |
| Duty factor (DF) | Fraction of the stride cycle spent in stance; > 0.5 for walking, < 0.5 for aerial running. |
| Mass-spring model | A point-mass body on a massless springy leg; reproduces GRF magnitudes and timing in bouncing gaits across diverse legged animals. |
| Inverted pendulum model | The walking analogy in which the body vaults over a stiff stance leg, exchanging gravitational and kinetic energy out of phase. |
| Bouncing gait | A locomotion pattern (running, hopping, trotting) in which gravitational and kinetic energies fluctuate in phase and elastic structures cycle the energy. |
| Inverted pendulum | The walking mechanism: gravitational PE peaks at mid-stance while KE is minimum, allowing passive energy exchange. |
| Step-to-step transition | The brief interval at the end of one stance and the start of the next when the trailing leg pushes off and the leading leg collides. |
| Collision | The energy-dissipating impact at heel strike when the leading leg comes down with downward velocity that must be reversed. |
| Push-off | Trailing-leg work that adds energy to the body; effective push-off just before heel strike reduces the upcoming collision. |
| Foot rolling | The continuous translation of the center of pressure from heel to toe during stance, made possible by the foot’s curved geometry — reduces collision losses. |
| Rear-foot strike | A running foot-strike pattern (heel first) producing a small early impact peak in the vertical GRF; common in shod runners. |
| Forefoot strike | A running foot-strike pattern (ball of foot first) with smoother GRF rise; uses the foot arch as a spring; common in barefoot runners. |
| Effective mechanical advantage (EMA) | Ratio of muscle moment arm to GRF moment arm (r/R); rises with body mass and is roughly constant within a species. |
| Isometric scaling | Geometric scaling in which all linear dimensions grow in proportion; under isometry, strength (∝ L²) grows slower than mass (∝ L³). |
| Allometric scaling | Scaling with body size in which proportions change — e.g., the postural shift that raises EMA in larger mammals. |
| Safety factor | Ratio of failure stress to peak operating stress; bone safety factor is typically 2–4 in locomotion. |
| Cost of transport (CoT) | Metabolic energy required to move a unit body mass over a unit distance (J kg⁻¹ m⁻¹) — the central efficiency metric for locomotion. |
| Groucho running | Running with a deeply flexed knee and lowered center of mass; dramatically increases muscle force demand and metabolic cost (~50%). |
| Passive-dynamic walking | Bipedal locomotion driven by gravity (or minimal actuation) plus mechanical-system geometry; demonstrated in McGeer-style passive walkers. |
| Running blade prosthesis | Carbon-fiber prosthetic foot designed to mimic the elastic energy cycling of the natural Achilles tendon. |