Lecture 15: Integrative Muscle Function — Training Effects on Muscle
Slide 1
- Continuing the integrative muscle sequence — moving from the structural and architectural levels of Lectures 11–14 to the plastic adaptive responses of muscle.
- Today’s focus: the basic principles of training, and how endurance and resistance training each alter muscle physiology.
Slide 2
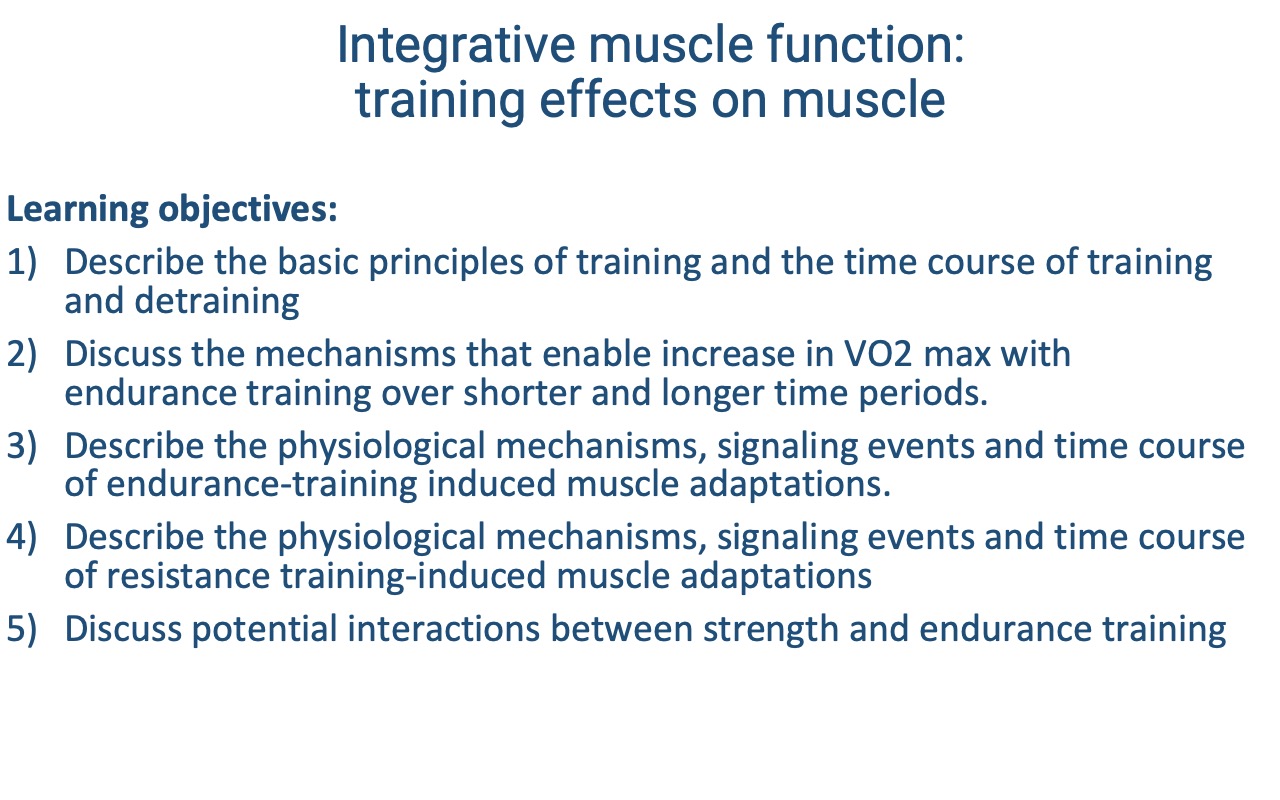
Learning Objectives
- Describe the basic principles of training and detraining and their time courses.
- Discuss the mechanisms that enable increases in VO2 max with endurance training over short and longer time periods.
- Describe the physiological mechanisms, signaling events, and time course of endurance-training-induced muscle adaptations.
- Describe the physiological mechanisms, signaling events, and time course of resistance-training-induced muscle adaptations.
- Discuss potential interactions between strength and endurance training (concurrent training).
Slide 3
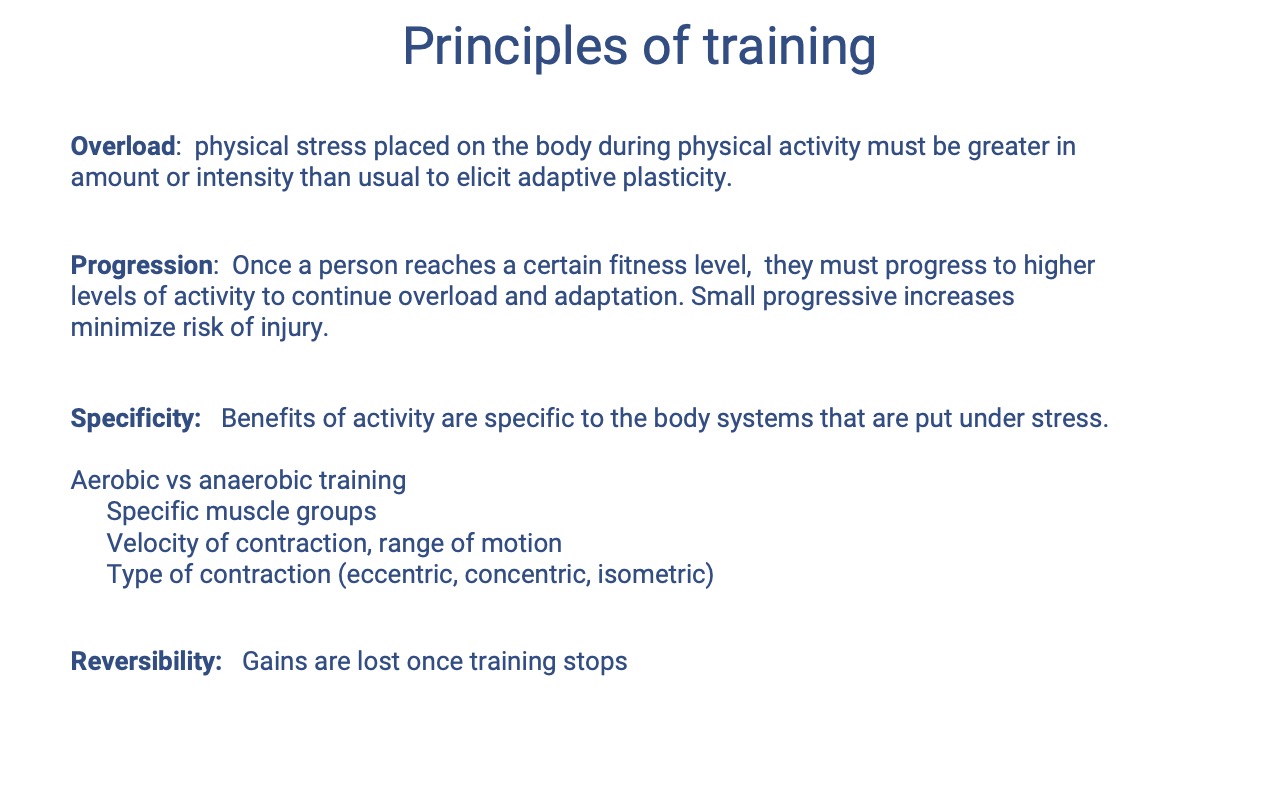
Four Core Principles of Training
- Overload — physical stress placed on a body system must be greater than usual in amount or intensity to elicit adaptive plasticity.
- Progression — once a fitness level is reached, the stimulus must continue to increase to drive further adaptation; small progressive increases minimize injury risk.
- Specificity — benefits are specific to the systems under stress, including:
- Aerobic vs. anaerobic training.
- Specific muscle groups (and even specific limbs — see Slide 11).
- Velocity of contraction and range of motion.
- Type of contraction (eccentric, concentric, isometric).
- Reversibility — gains are lost when training stops, but not all adaptations decay at the same rate.
Slide 4
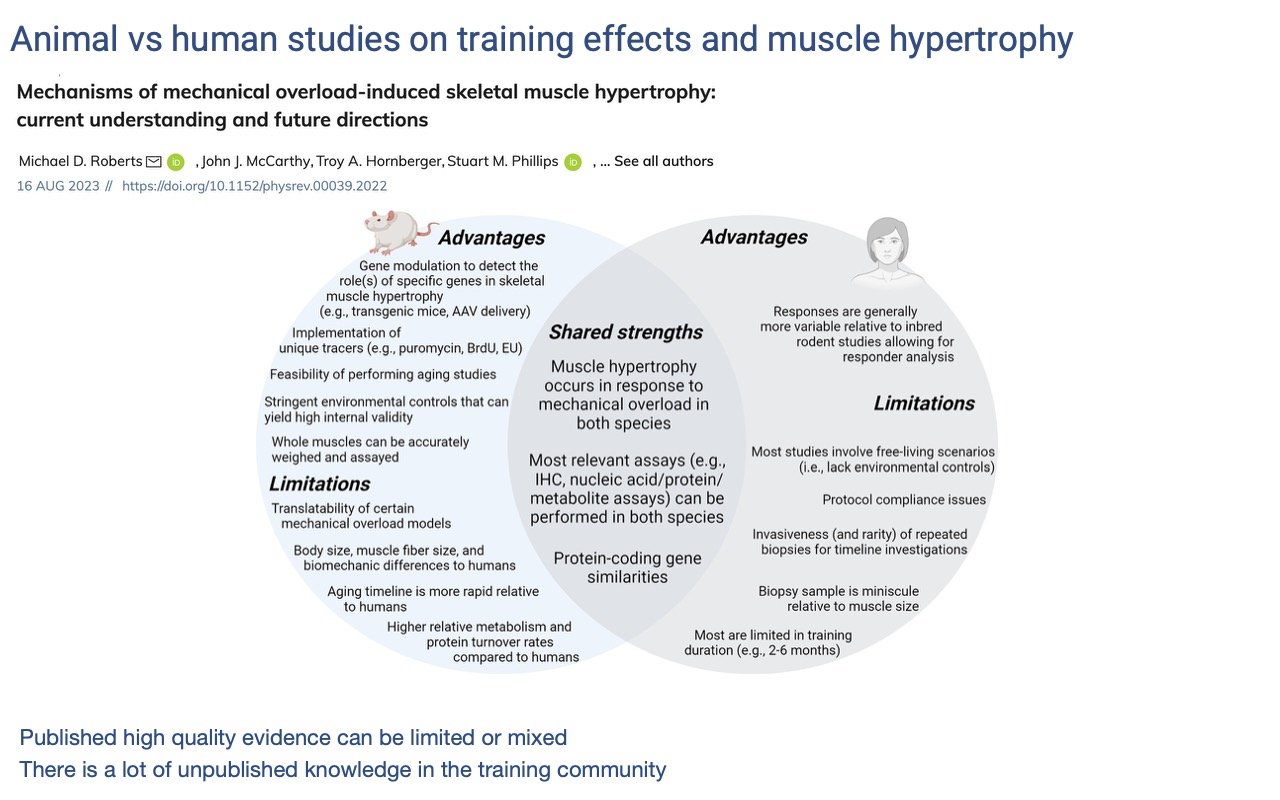
Strengths and Limitations of Training-Effect Studies
- Rodent models allow tight environmental control, gene manipulation, and full-muscle assays — but rodents differ from humans in body size, fiber types, aging timeline, and protein turnover, so results don’t always translate.
- Human studies apply directly to humans but have wide variation in baseline fitness, training history, and protocol compliance; biopsies are small and durations are typically short (2–6 months).
- Practical takeaway: published evidence on training effects is mixed in quality and tends to capture short-term adaptations; much practical knowledge resides in coaches and athletic trainers.
Slide 5
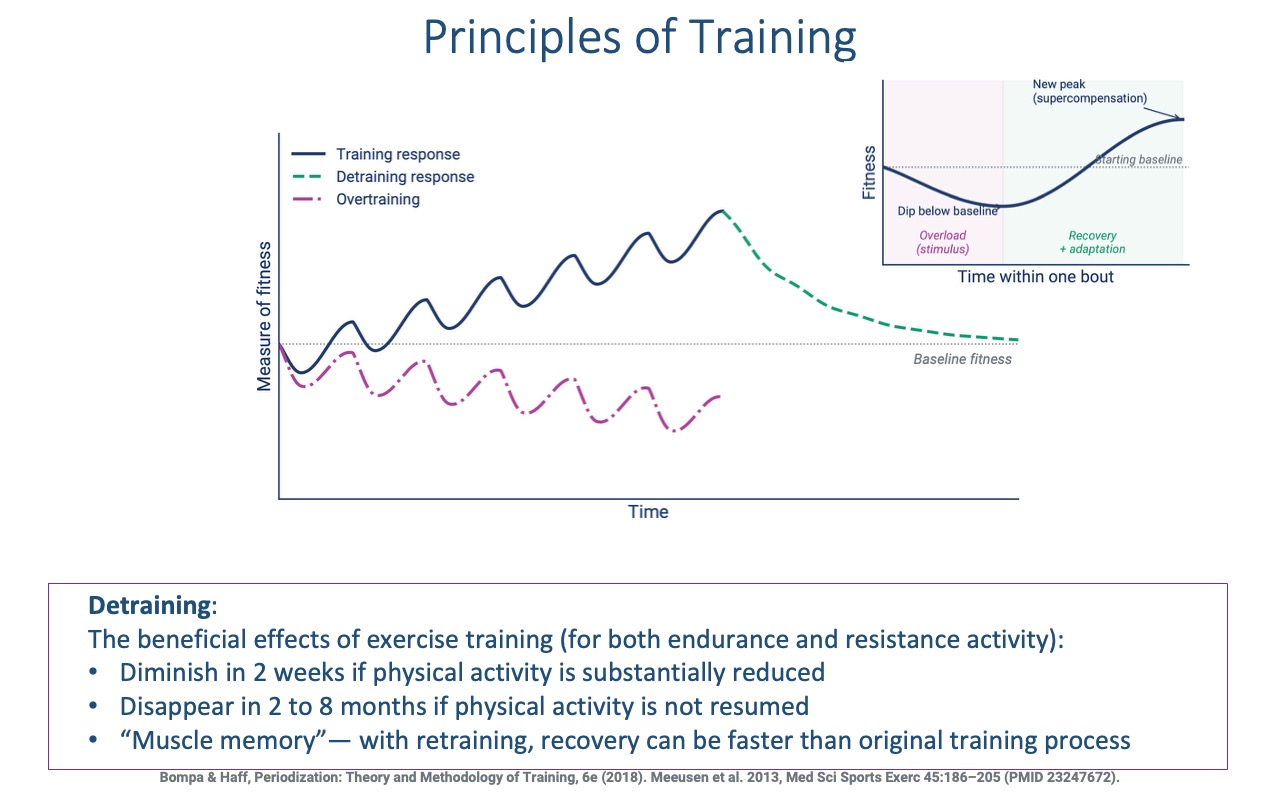
Training, Detraining, Overtraining, and Muscle Memory
- Training response (blue): each bout produces a brief dip from microdamage, followed by recovery to a new, higher baseline — the supercompensation cycle.
- Overtraining (magenta) occurs when the next bout starts before recovery is complete; performance progressively declines over time. Risk increases with poor nutrition, sleep, or high stress.
- Detraining (green dashed):
- Benefits diminish within ~2 weeks of substantially reduced activity.
- Benefits can fully disappear within 2–8 months without resumption.
- Muscle memory — recovery on retraining is faster than the original training process because of long-lasting cellular and epigenetic changes (revisited on Slides 19, 23–24).
Slide 6
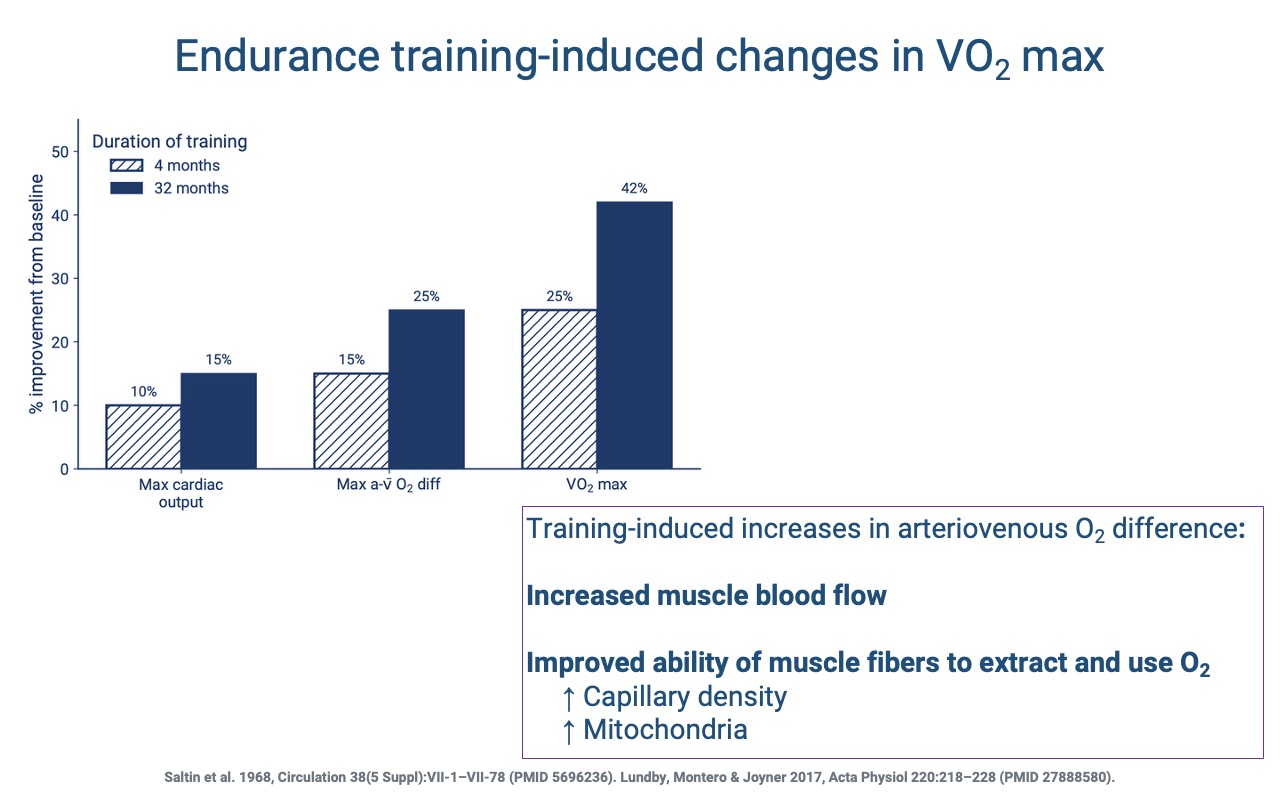
Short- vs. Long-Term Contributions to VO2 Max
- After ~4 months of endurance training, most of the gain in VO2 max comes from increased cardiac output (driven mainly by larger stroke volume).
- After ~32 months, additional gains come from a larger a-v O2 difference, driven by higher capillary density (shorter diffusion distance) and more mitochondria (larger tissue O2 sink).
- The longer-term peripheral adaptations require time because new capillaries and mitochondria must be built.
Slide 7
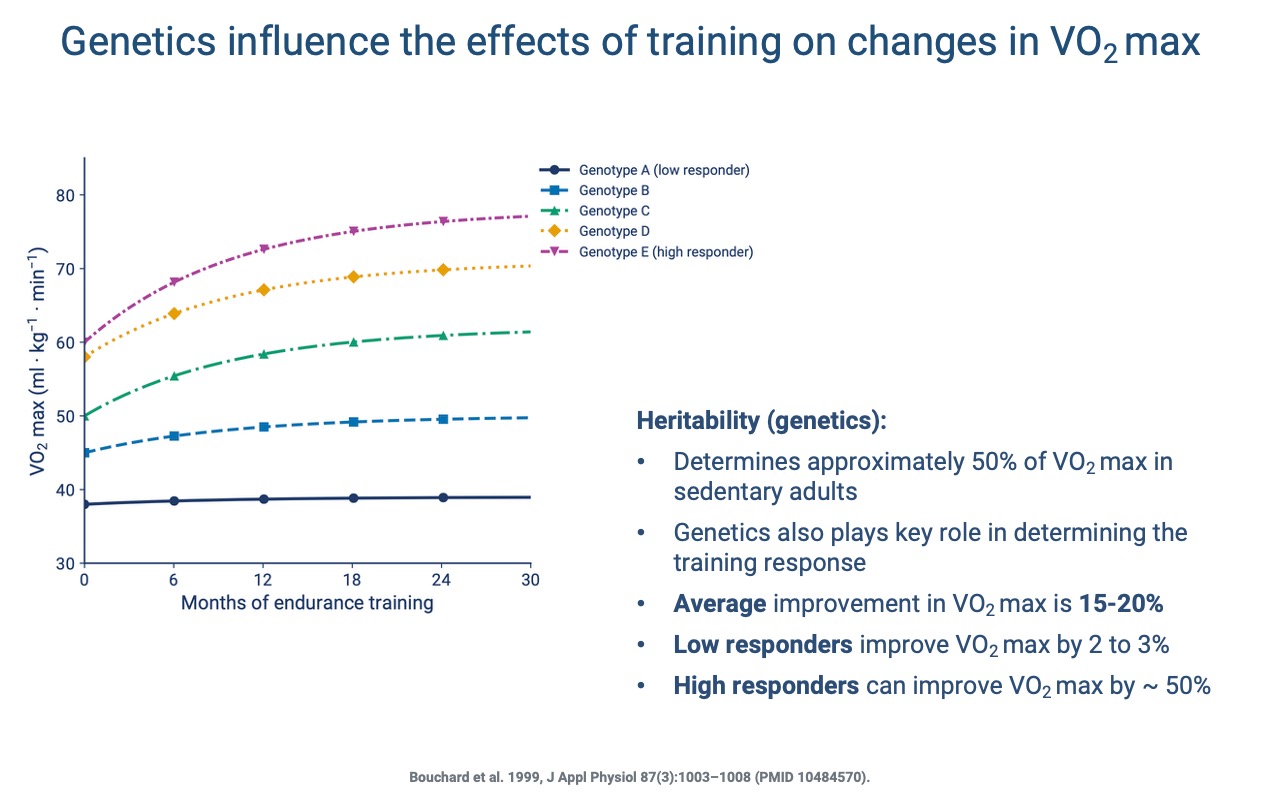
Genetic Variation in Trainability
- About 50% of the variation in VO2 max in sedentary adults is heritable.
- Genetics also influences the training response: average improvement is 15–20%, but low responders gain only 2–3% and high responders can gain ~50%.
- Even low responders gain many other benefits from training (cardiovascular health, strength, bone density) — VO2 max is one metric among many.
Slide 8
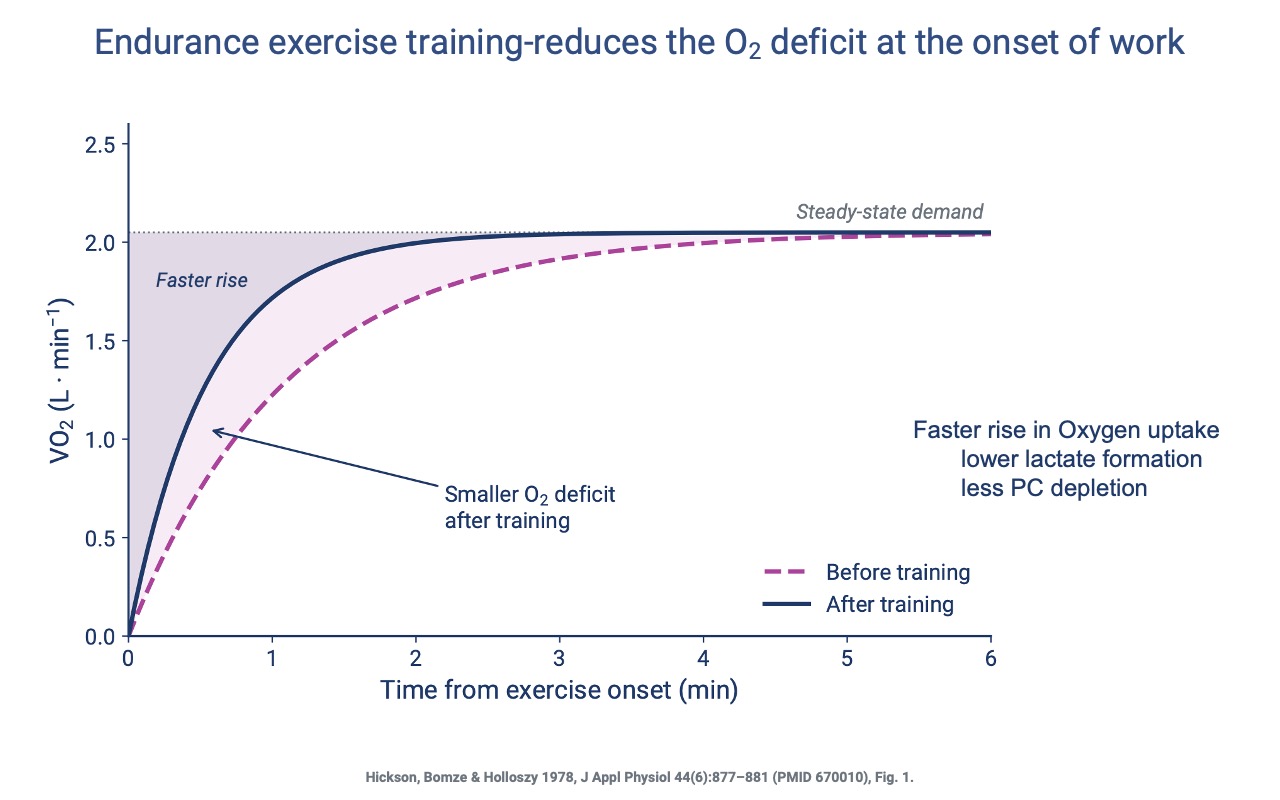
Faster O2 Kinetics After Training
- After endurance training, VO2 rises more quickly at the onset of exercise — the O2 deficit is smaller.
- A faster rise means less anaerobic ATP is required at the start: lower lactate accumulation and less phosphocreatine depletion, reducing the post-exercise excess oxygen consumption.
Slide 9
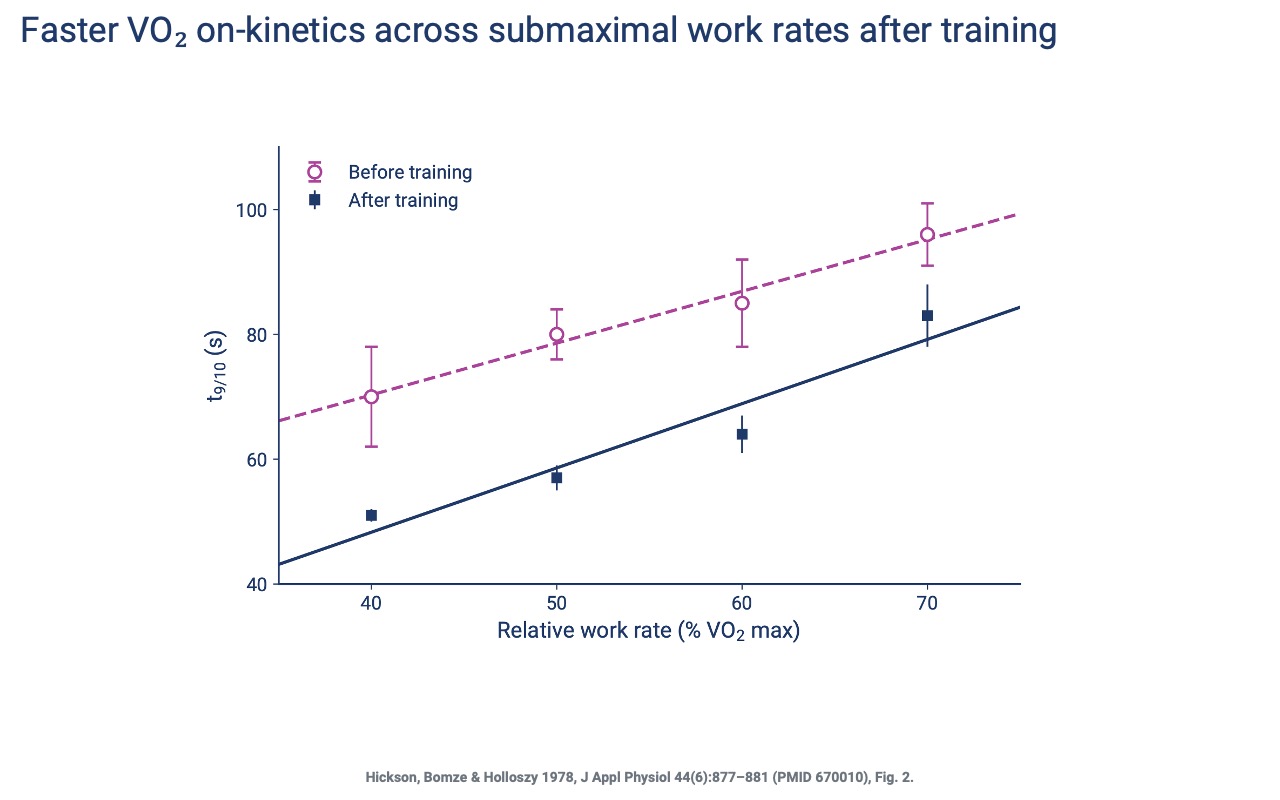
On-Kinetics Speed Up Across Submaximal Loads
- The faster on-kinetics shown on Slide 8 hold across all submaximal work rates after endurance training — t9/10 drops by roughly 20–30 seconds at every relative load.
- Practical impact: an athlete can transition into a steady metabolic state more quickly during interval work and during the early minutes of any continuous bout.
Slide 10
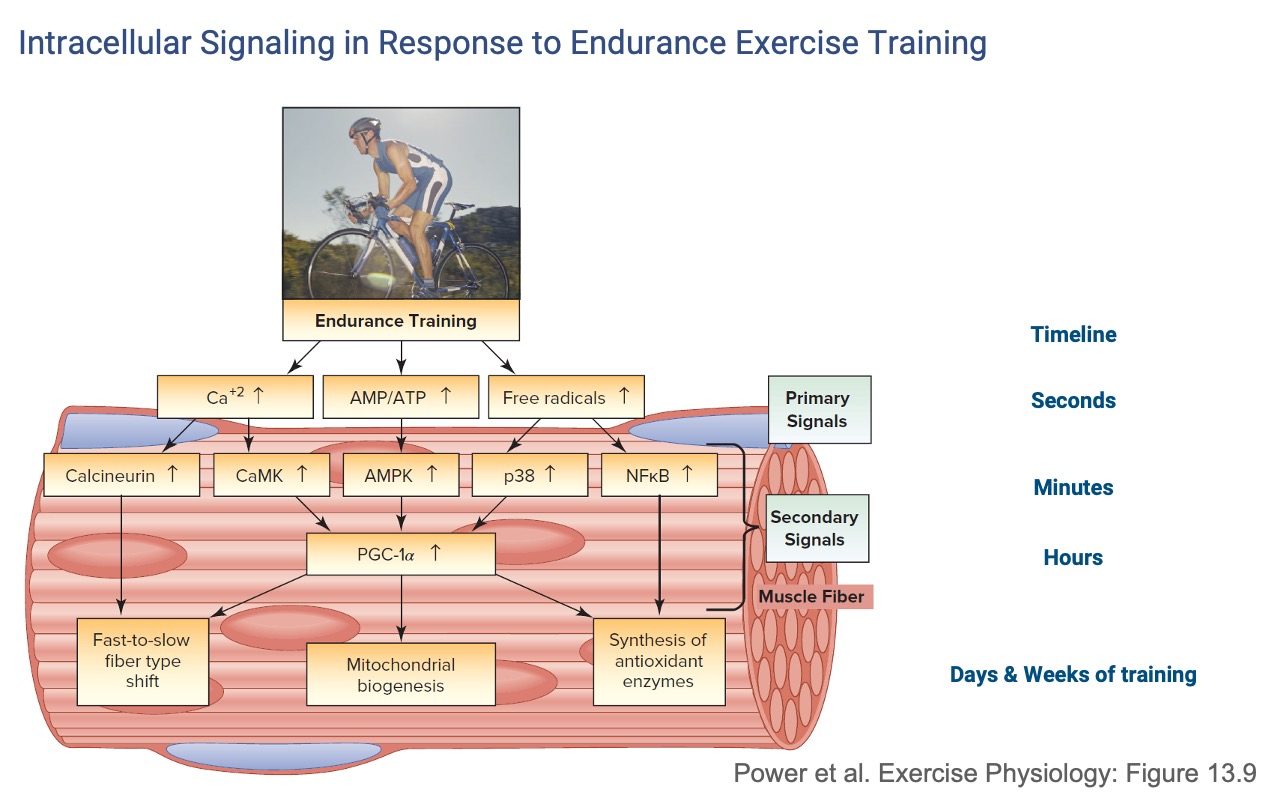
Endurance-Training Signaling Cascade
- Primary signals (seconds): increases in Ca2+ cycling, AMP/ATP ratio, and free radicals.
- Secondary signals (minutes–hours): Calcineurin, CaMK, AMPK, p38, NFκB — all converging on the master transcriptional coactivator PGC-1α.
- Long-term outputs (days–weeks): mitochondrial biogenesis, a small fast-to-slow fiber-type shift, and increased antioxidant enzyme synthesis.
- The signals are local — only fibers that actually contract receive the stimulus (see Slide 11).
Slide 11
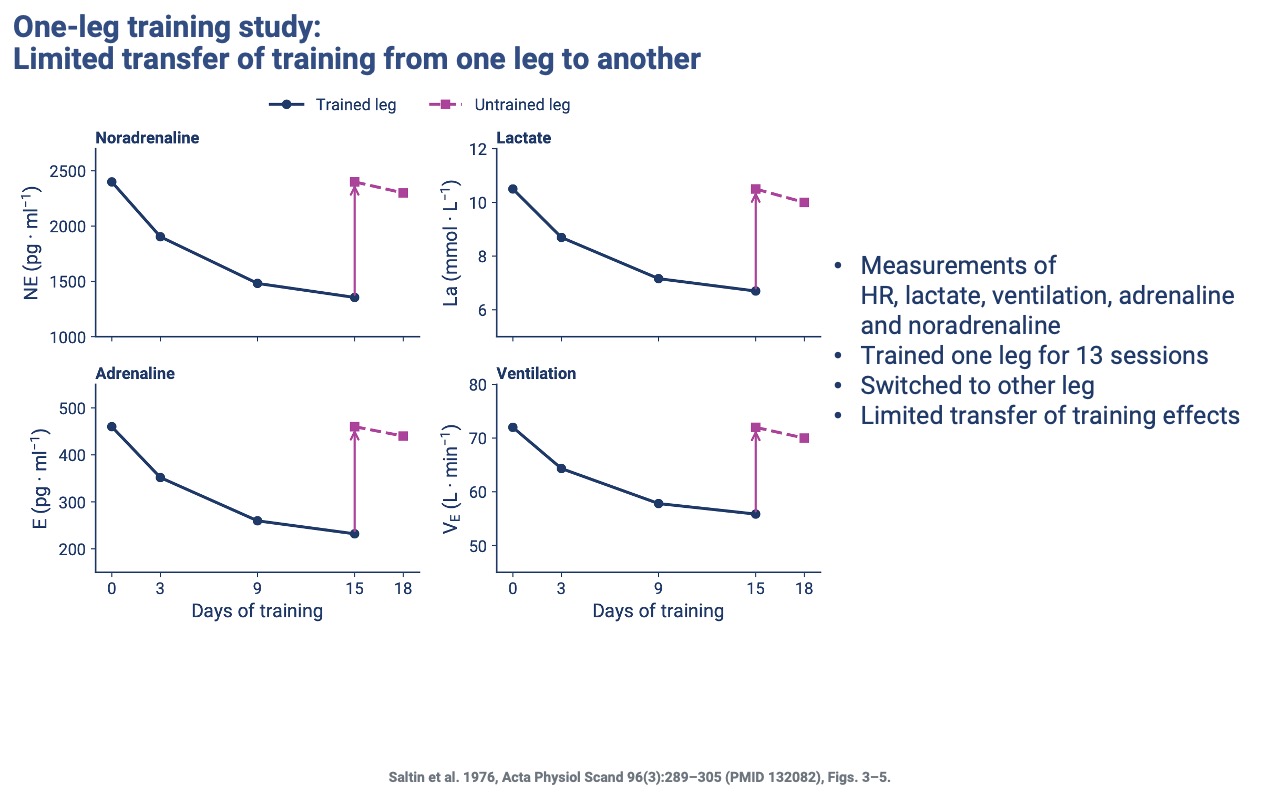
Training Adaptations Are Local — One-Leg Study
- Subjects trained one leg for 13 sessions, then switched to the other leg.
- Whole-body responses (lactate, adrenaline, noradrenaline, ventilation) progressively dropped during one-leg training, then returned to near-baseline when the untrained leg began training.
- Confirms that training adaptations are specific to the muscles doing the work — even systemic responses are driven by the trained tissue, not by circulating signals alone.
- This finding supports the use of one leg as an internal control in many training-physiology studies.
Slide 12
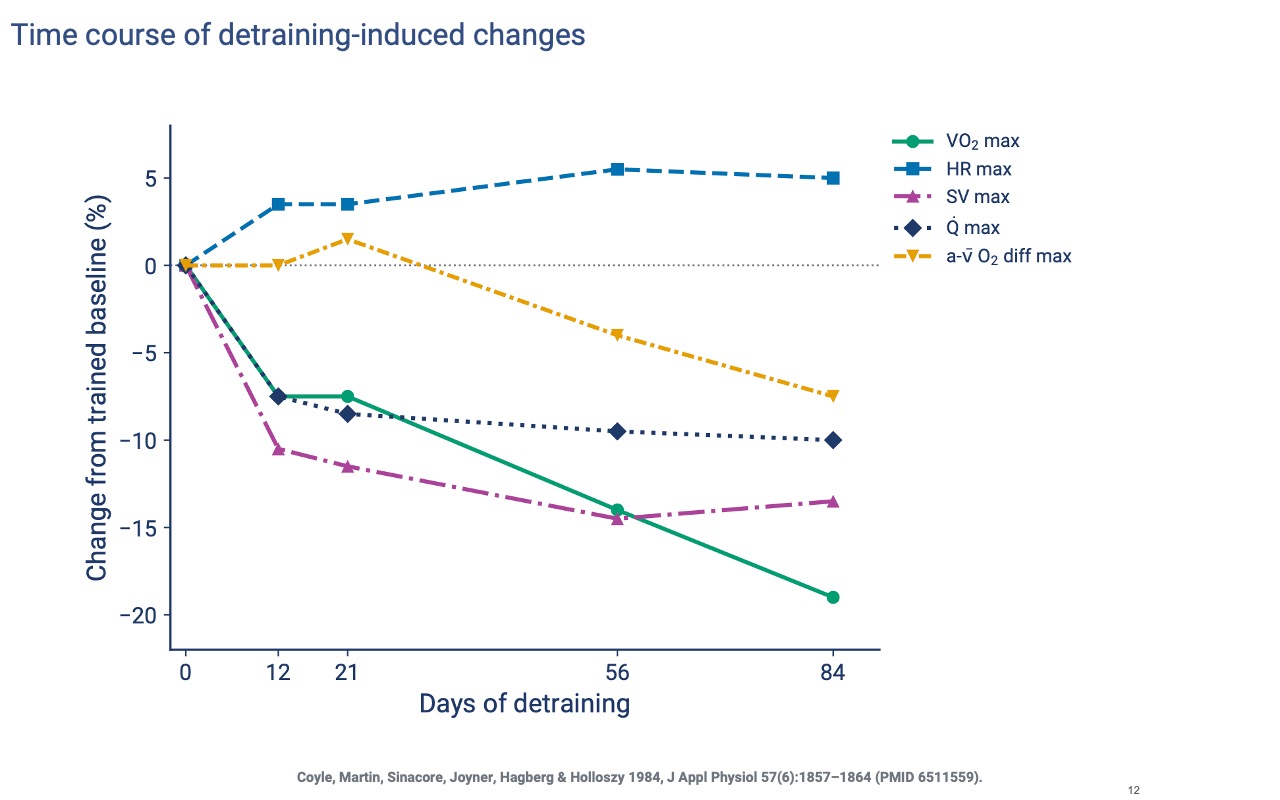
Detraining — Two Different Decay Rates
- Stroke volume and cardiac output drop within the first two weeks of detraining — the most rapid changes.
- The a-v O2 difference declines much more slowly, mostly between weeks 8 and 12, because mitochondrial and capillary adaptations take longer to reverse.
- VO2 max tracks the combined loss of central and peripheral adaptations.
Slide 13
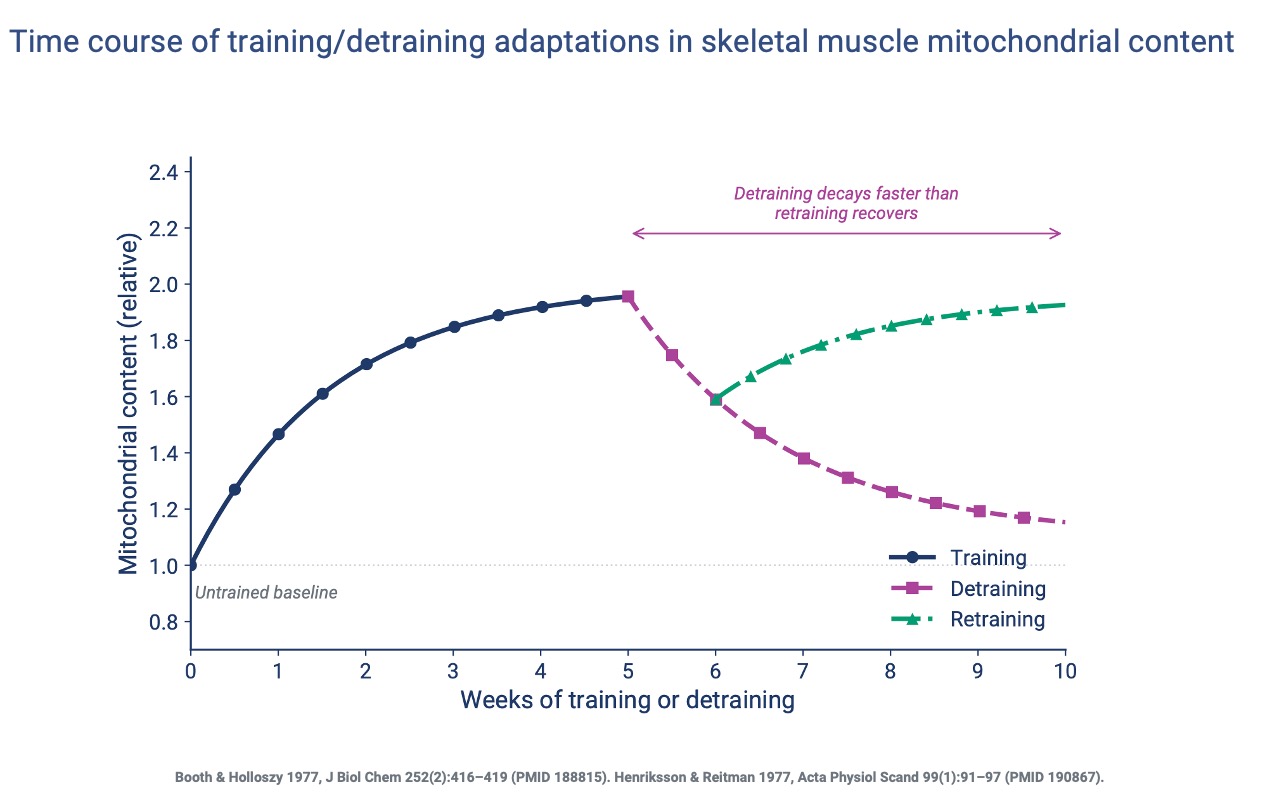
Mitochondrial Content — Training, Detraining, Retraining
- Mitochondrial content nearly doubles in 5 weeks of training, then plateaus unless workload is increased.
- After detraining, the steepest losses occur in the first ~2 weeks, with continued slow decay.
- Retraining recovers prior content within ~4 weeks — a clear example of muscle memory at the mitochondrial level.
Slide 14
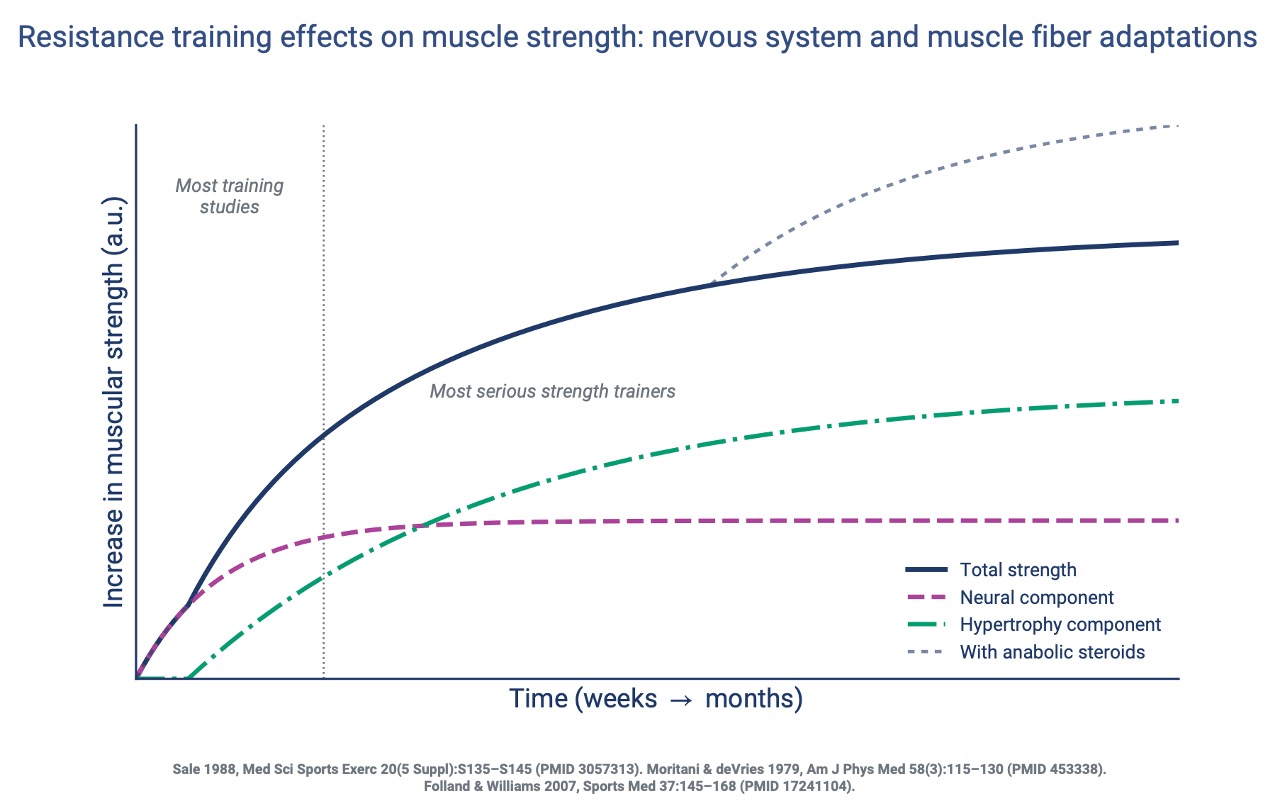
Two Phases of Strength Gain
- The early strength gains from resistance training (~2–8 weeks) are dominated by the nervous system — increased neural drive and improved coordination, not yet by larger fibers.
- Hypertrophy rises more slowly and is the dominant contributor over longer training durations.
- Most short-duration studies (the gray vertical line) capture mostly the neural phase, missing later hypertrophy gains.
Slide 15
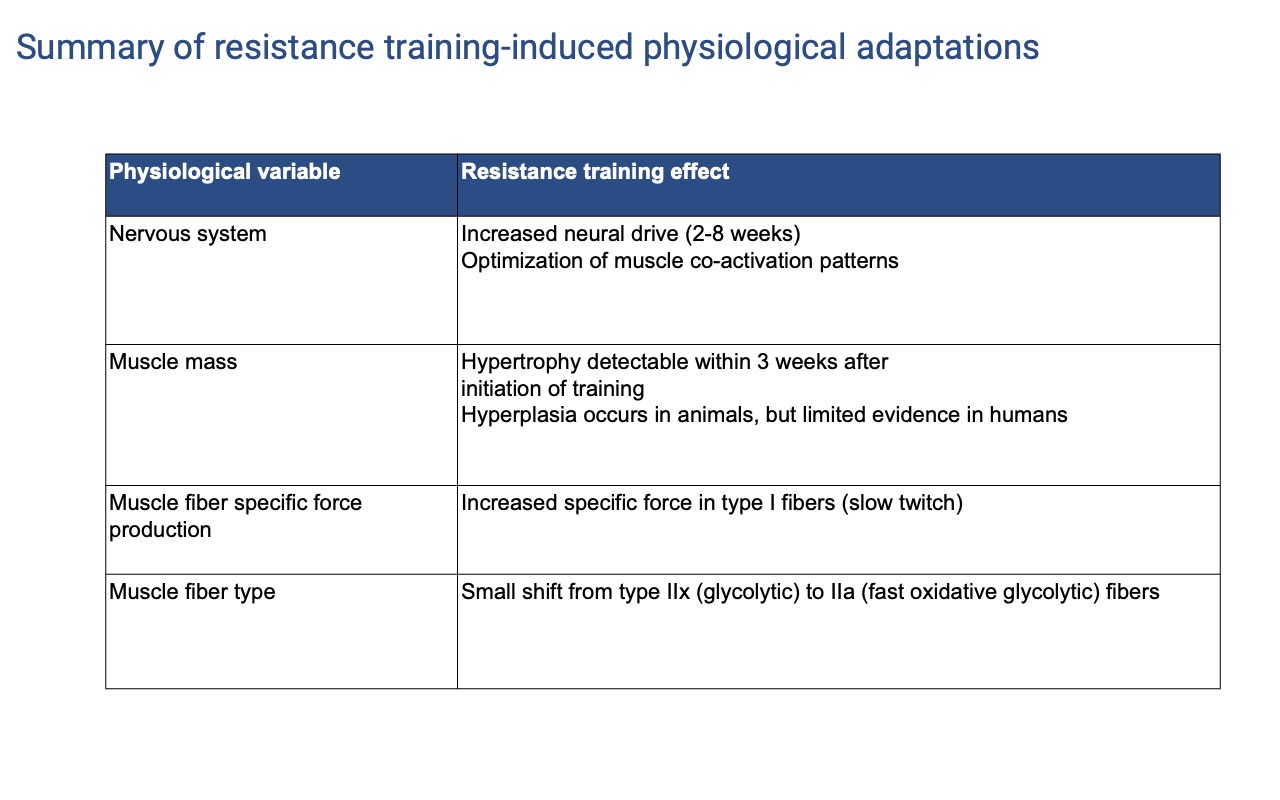
Resistance Adaptations — Part 1 (Neural and Fiber)
| Variable | Resistance training effect |
|---|---|
| Nervous system | Increased neural drive (2–8 weeks); optimization of muscle co-activation patterns |
| Muscle mass | Hypertrophy detectable within ~3 weeks; hyperplasia in animals but limited evidence in humans |
| Muscle fiber specific force | Increased specific force in type I (slow twitch) fibers |
| Muscle fiber type | Small shift from type IIx (glycolytic) to type IIa (fast oxidative glycolytic) fibers |
- One reason strength gains can outpace voluntary force capacity: maximum voluntary contraction does not recruit 100% of a muscle — the nervous system imposes a safety factor to protect bones and tendons. Training (and adrenaline) can partially override this.
Slide 16
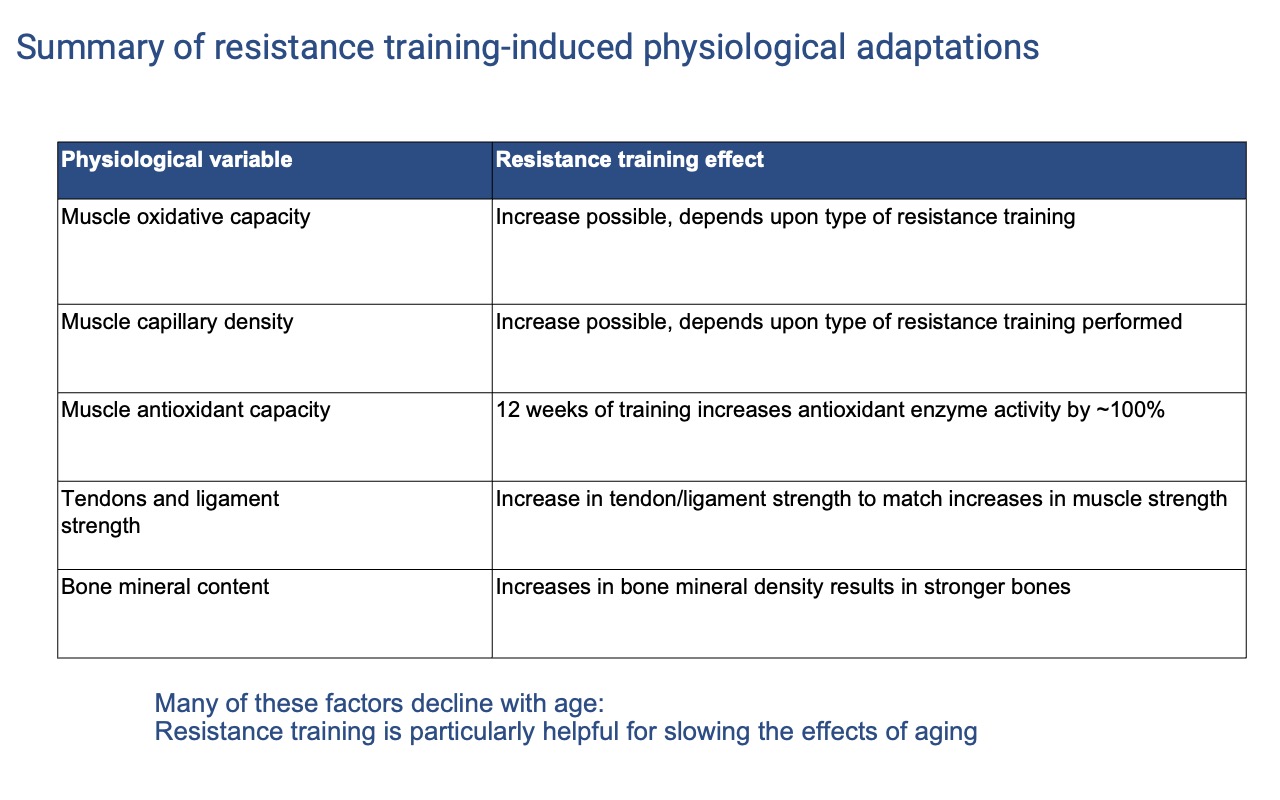
Resistance Adaptations — Part 2 (Tissue, Tendon, and Bone)
| Variable | Resistance training effect |
|---|---|
| Muscle oxidative capacity | Increase possible — depends on the type of resistance training (more if heart rate is elevated) |
| Muscle capillary density | Increase possible — depends on whether training imposes aerobic demand |
| Muscle antioxidant capacity | ~100% increase in antioxidant enzyme activity over 12 weeks |
| Tendon and ligament strength | Increase to match rising muscle strength — but slower than muscle, so injury risk is highest when muscle gains outpace connective-tissue remodeling |
| Bone mineral content | Increases in mineral density produce stronger bones |
- Many of these tissues decline with age — making resistance training a particularly effective intervention for older adults.
Slide 17
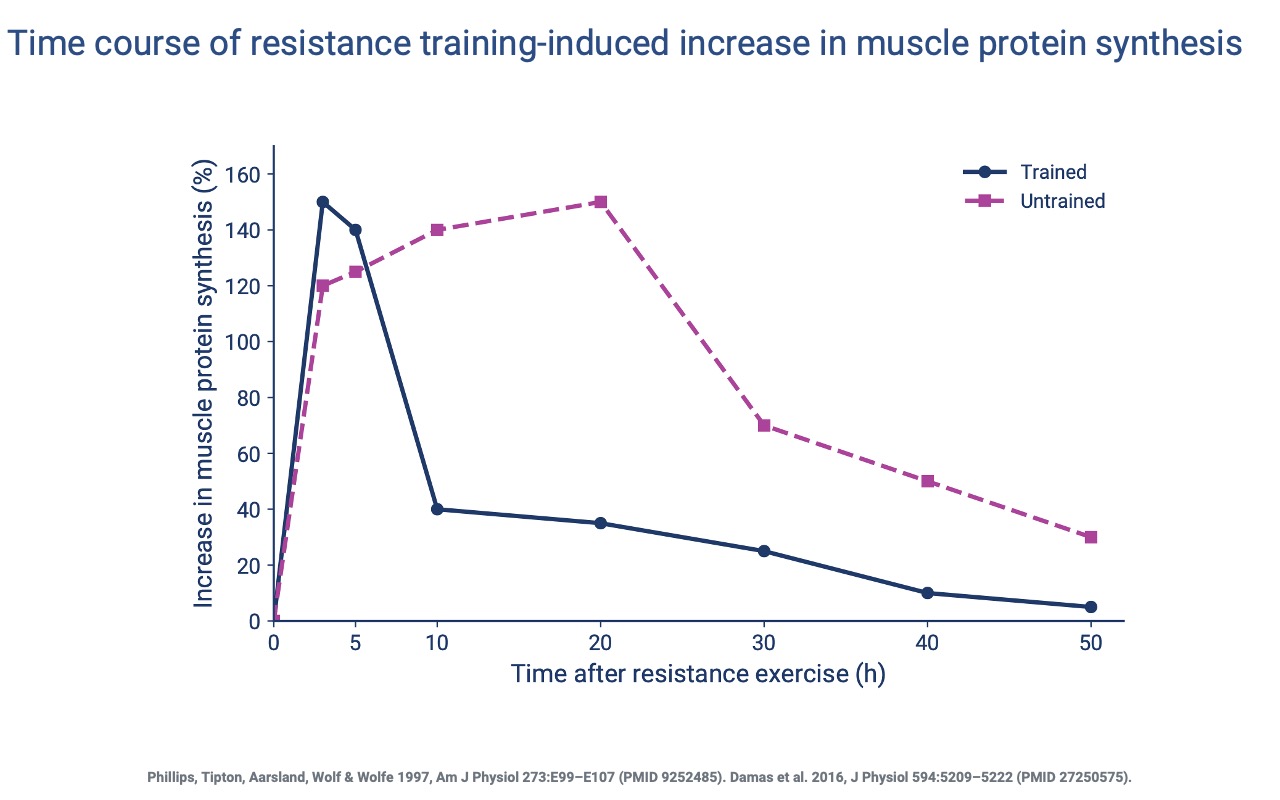
Trained Muscle Synthesizes Protein More Rapidly and Briefly
- In untrained subjects, the protein-synthesis response is slow and prolonged (peak at ~20 h, lasting >40 h).
- In trained subjects, the response is rapid (peak at 3 h) but shorter-lived — a more focused, efficient response that allows faster recovery between training bouts.
- This shift requires more nuclei per fiber to support the higher rate of protein synthesis (Slide 19).
Slide 18
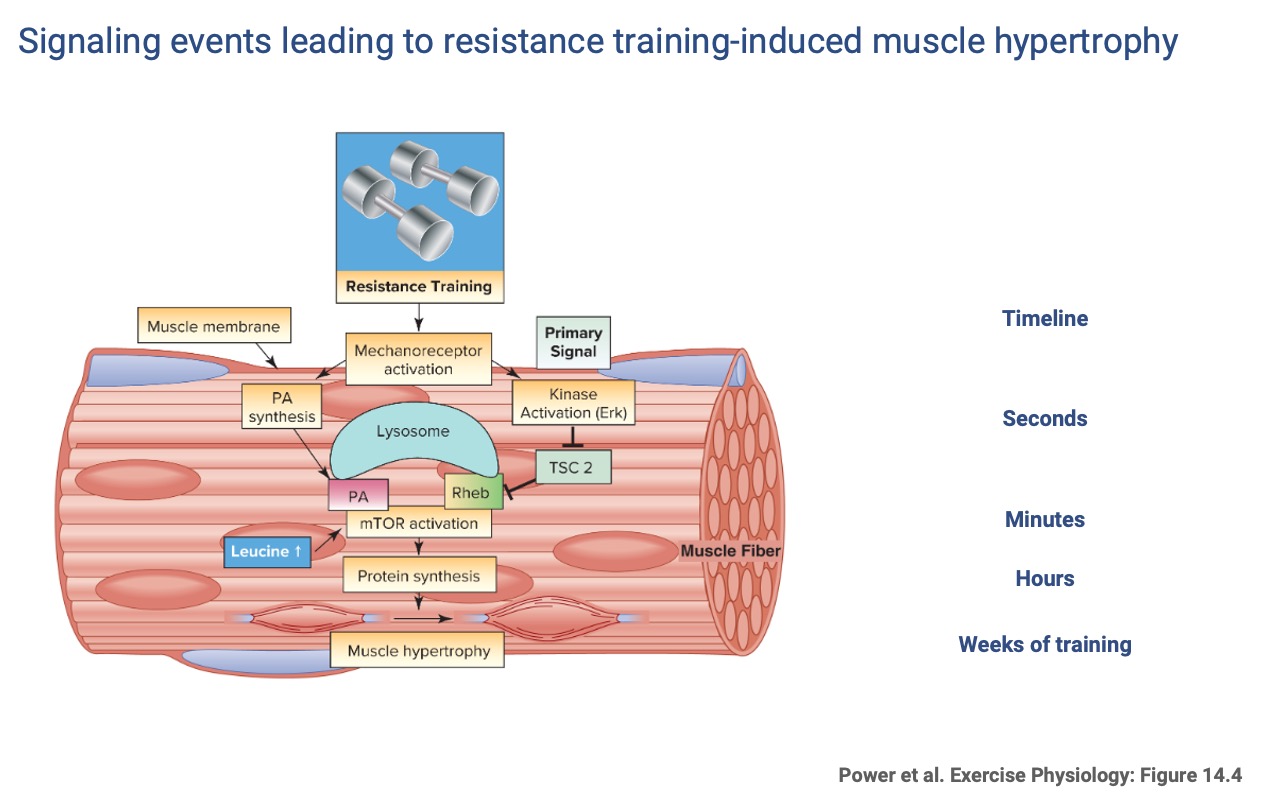
Resistance-Training Signaling Cascade
- Primary signal (seconds): mechanoreceptor activation in the muscle membrane.
- Secondary signals (minutes): kinase activation (Erk) inhibits TSC2, releasing Rheb, which combines with phosphatidic acid (PA) to activate mTOR (mammalian target of rapamycin). Dietary leucine also activates mTOR.
- mTOR drives protein synthesis (hours) and ultimately muscle hypertrophy (weeks).
- Compare to the endurance pathway (Slide 10) — the two cascades are distinct and, as Slide 22 shows, can interfere with each other.
Slide 19
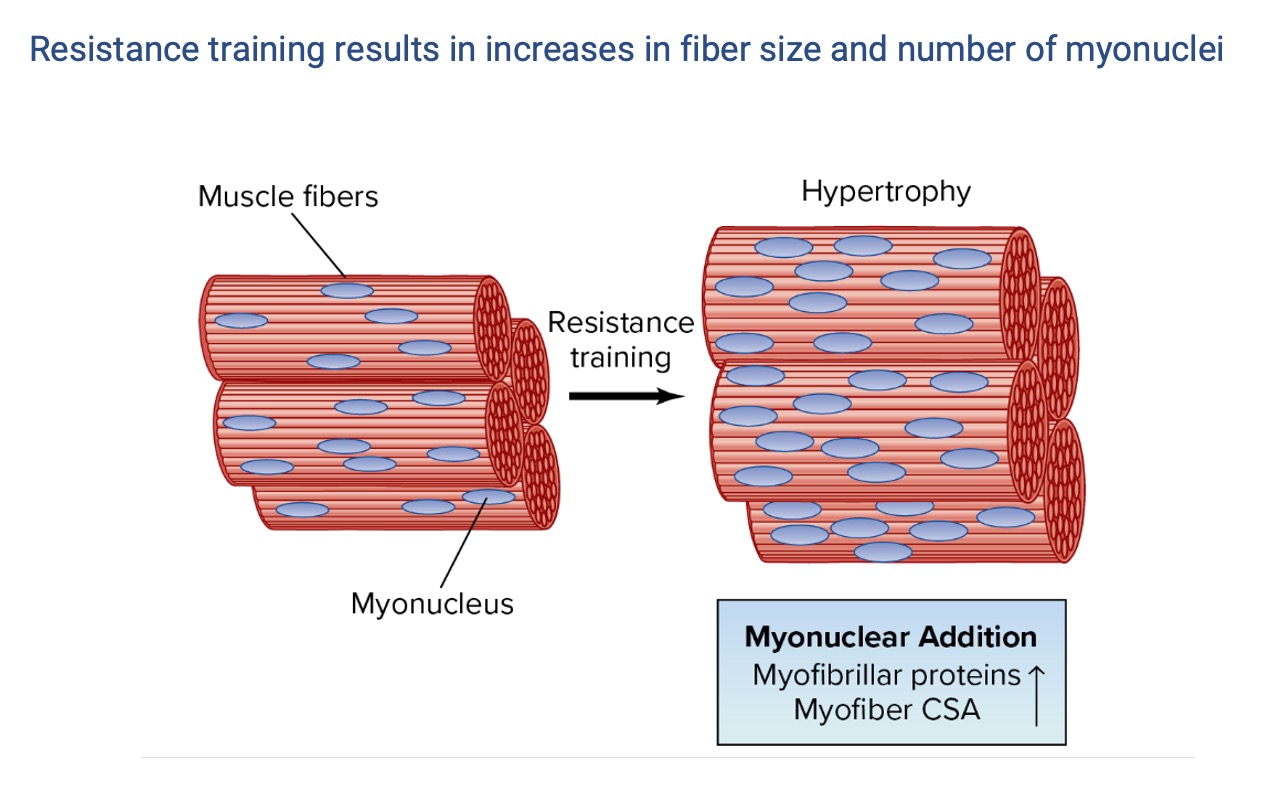
Hypertrophy Adds Both Protein and Nuclei
- Resistance training in humans produces hypertrophy (larger fibers) and an increase in the number of myonuclei per fiber — but not more fibers (no convincing hyperplasia in humans).
- More nuclei expand each fiber’s myonuclear domain, increasing its capacity for rapid protein synthesis in response to subsequent bouts.
- These added nuclei are retained during detraining — the cellular basis for muscle memory (Slide 23).
Slide 20
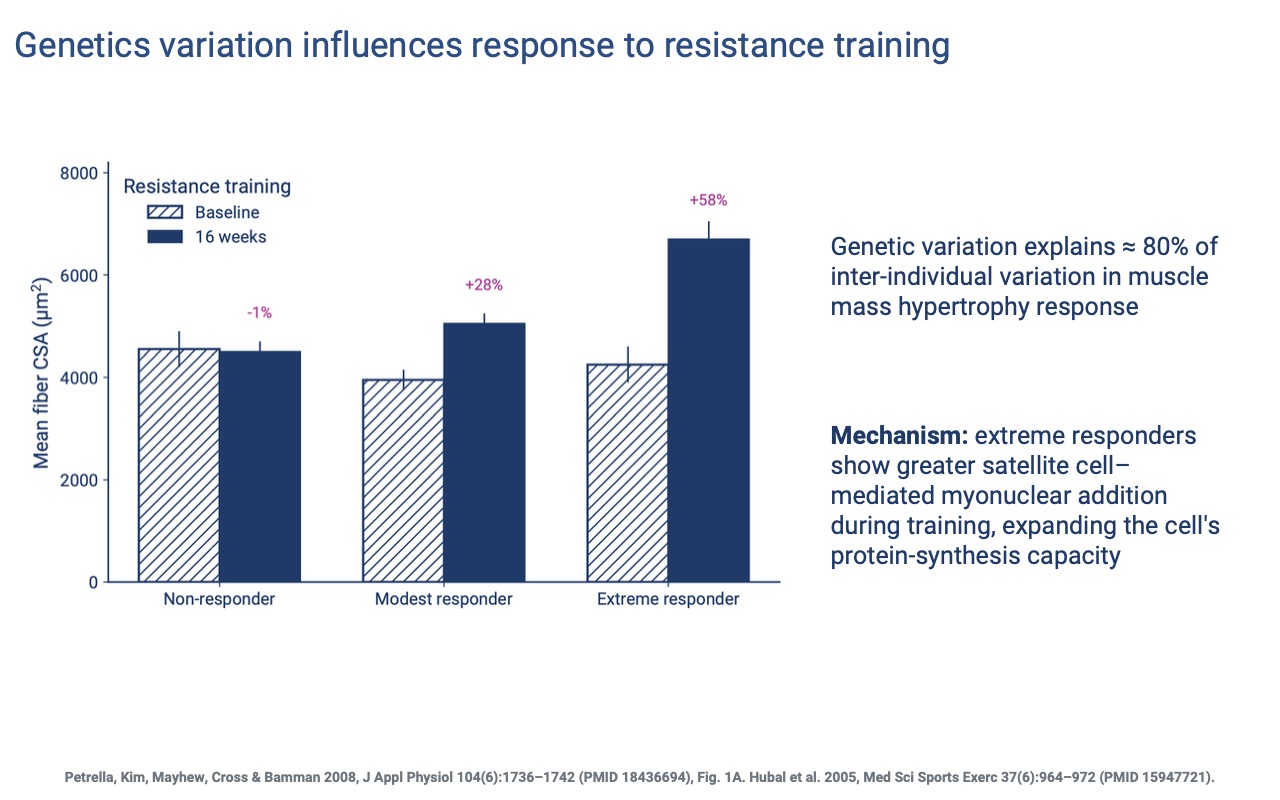
Genetic Variation in Hypertrophy Response
- ~80% of inter-individual variation in muscle hypertrophy response is heritable — even larger than the genetic component of VO2 max trainability (Slide 7).
- Non-responders show essentially no fiber growth over 16 weeks; extreme responders can gain +58% CSA.
- Mechanism: extreme responders show greater satellite-cell-mediated myonuclear addition, expanding each fiber’s protein-synthesis capacity.
Slide 21
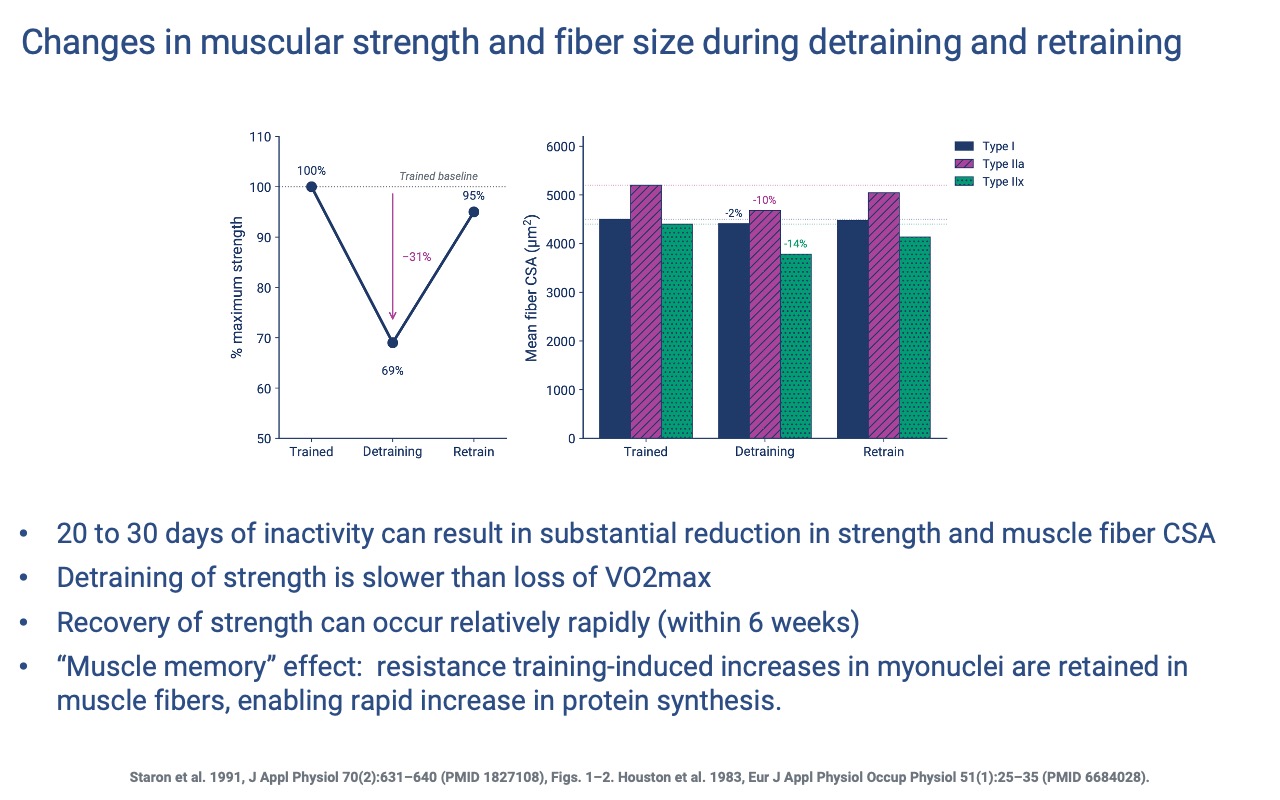
Detraining and Retraining of Strength
- 20–30 days of inactivity can reduce strength by ~30% and shrink fiber CSA across all fiber types — with the largest losses in type IIx (−14%).
- Strength loss is slower than VO2 max loss.
- Retraining restores strength to near-baseline within ~6 weeks — supported by the retained extra myonuclei (Slide 19).
Slide 22
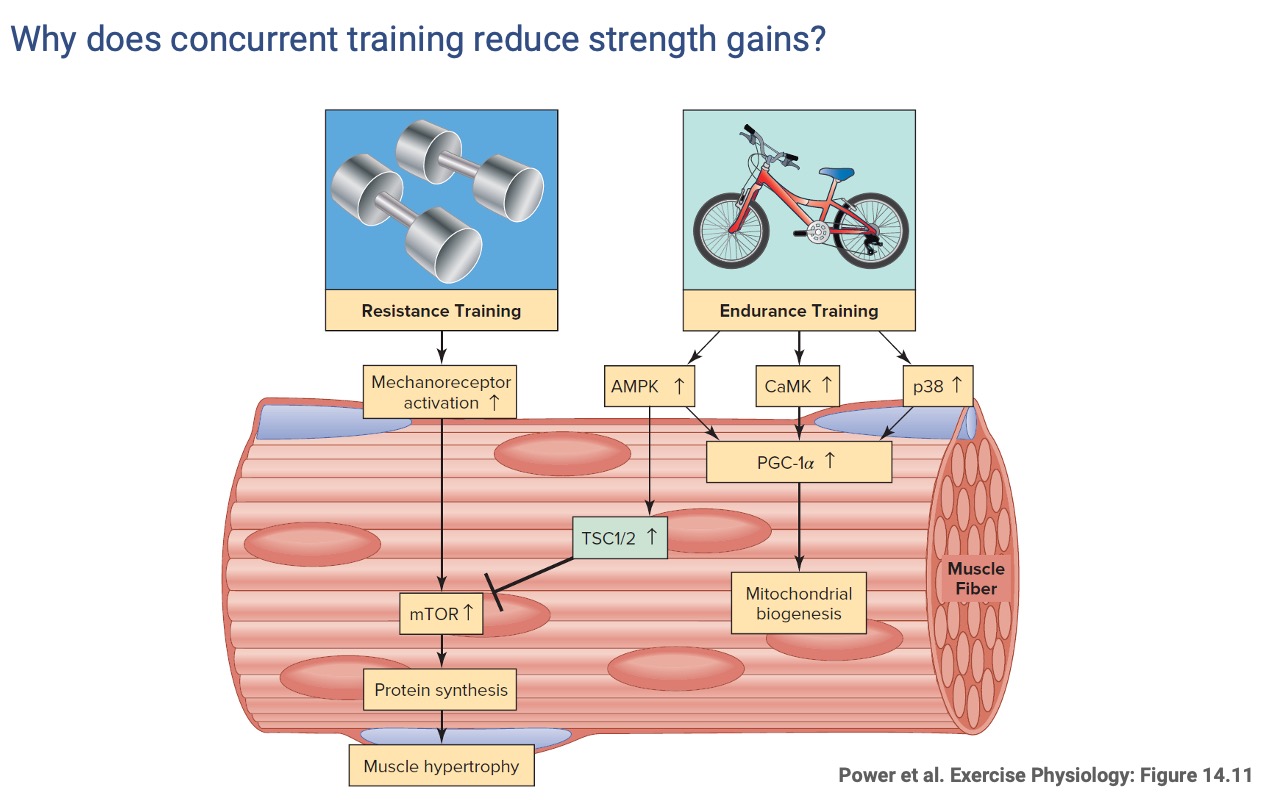
Concurrent Training — Endurance Signaling Inhibits Hypertrophy
- Endurance training activates AMPK, which activates TSC1/2, which inhibits mTOR.
- Combining endurance and resistance training in the same session can therefore blunt strength gains relative to resistance training alone.
- Practical implication: training program design should match the specific performance goal (most sports require some balance of both).
Slide 23
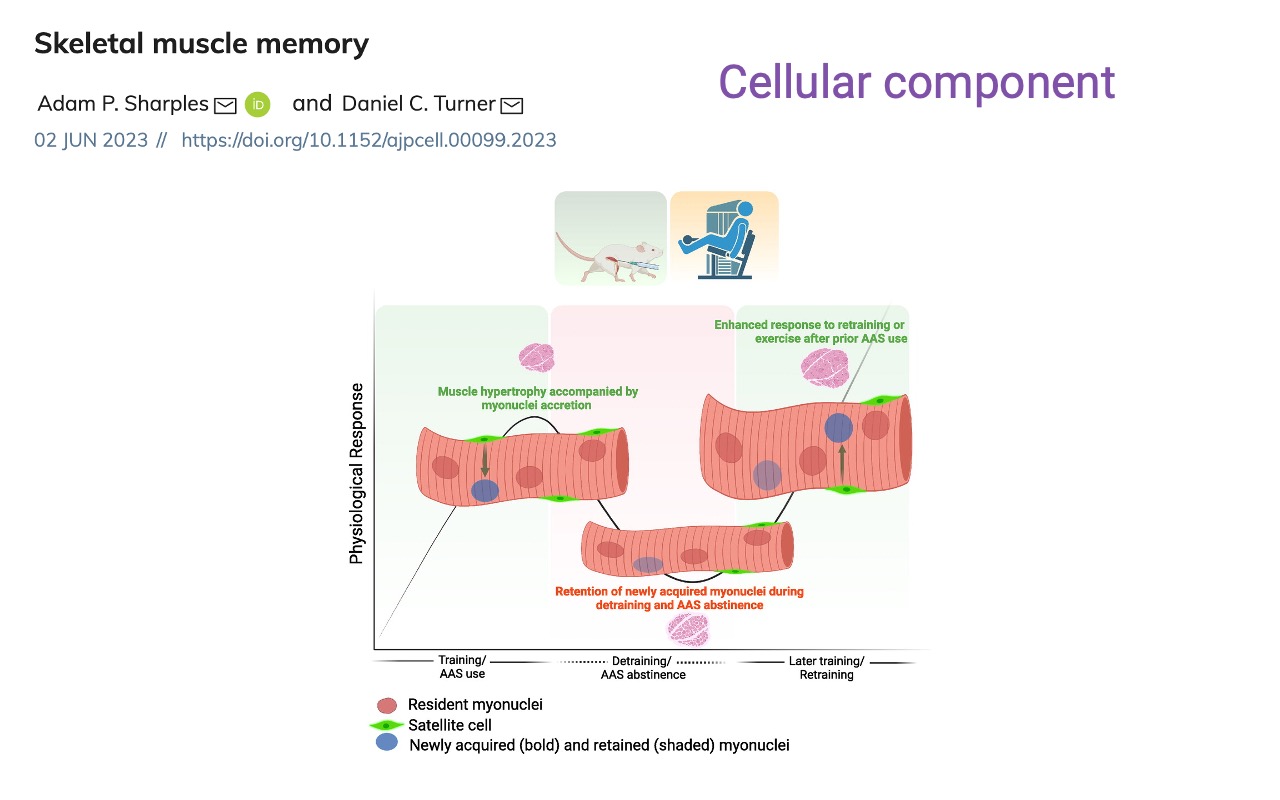
Muscle Memory — Cellular Basis
- During training, satellite cells donate new myonuclei to growing fibers.
- During detraining, fibers shrink but the extra myonuclei are retained.
- On retraining, the retained nuclei give the fiber a “head start” on protein synthesis — producing the enhanced response (faster recovery to prior strength) seen in Slide 13 and Slide 21.
Slide 24
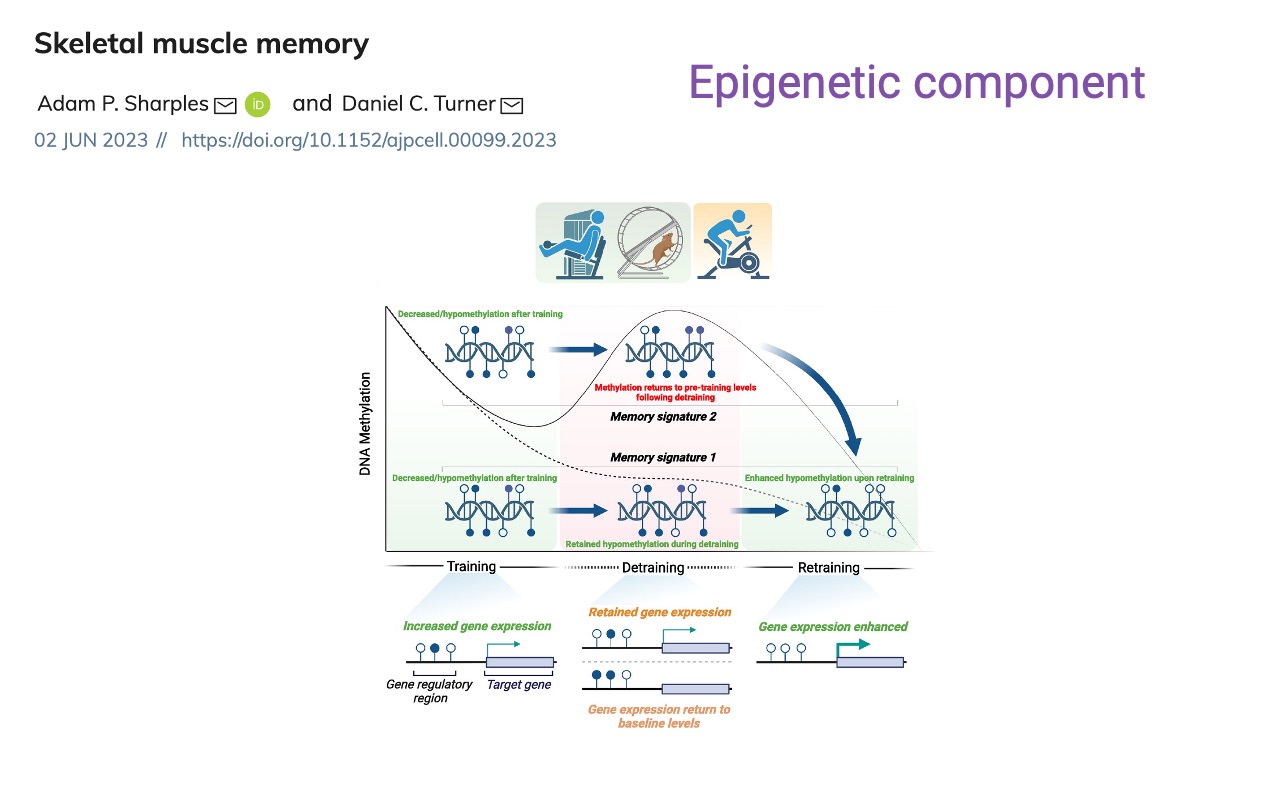
Muscle Memory — Epigenetic Basis
- A second mechanism for muscle memory is DNA methylation at gene regulatory regions.
- Signature 1: hypomethylation is retained through detraining, enabling enhanced gene expression on retraining.
- Signature 2: methylation returns to pre-training levels during detraining but responds more strongly on the next round.
- These epigenetic changes complement the cellular (myonuclear) memory — together they explain why prior training accelerates retraining.
Slide 25
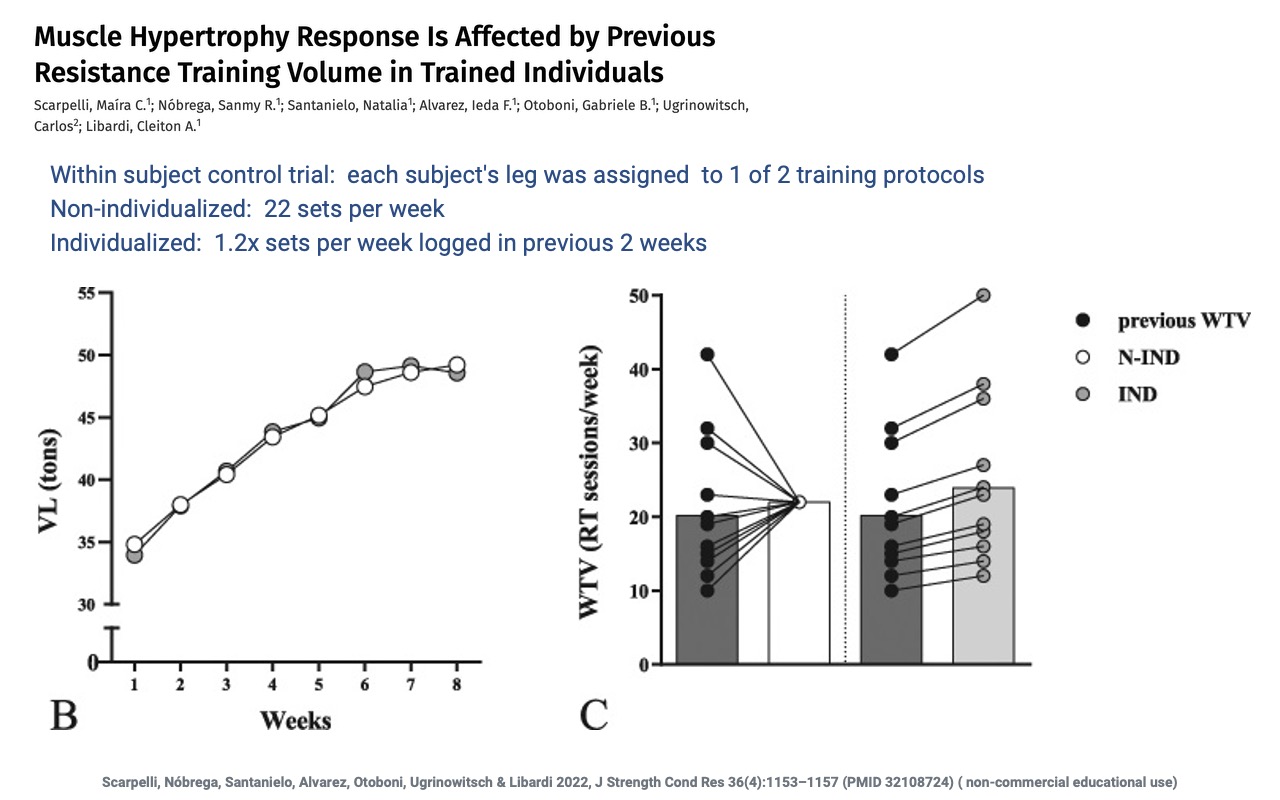
Adapting Training Volume to Prior History
- A within-subject design: each subject’s two legs received different protocols — non-individualized (22 sets/week) vs. individualized (1.2× the subject’s logged volume from the prior 2 weeks).
- Both protocols increased vastus lateralis cross-sectional area over 8 weeks, but the individualized protocol was tuned to each subject’s recent training history.
- Sets up the next slide, which shows the difference in hypertrophy gain.
Slide 26
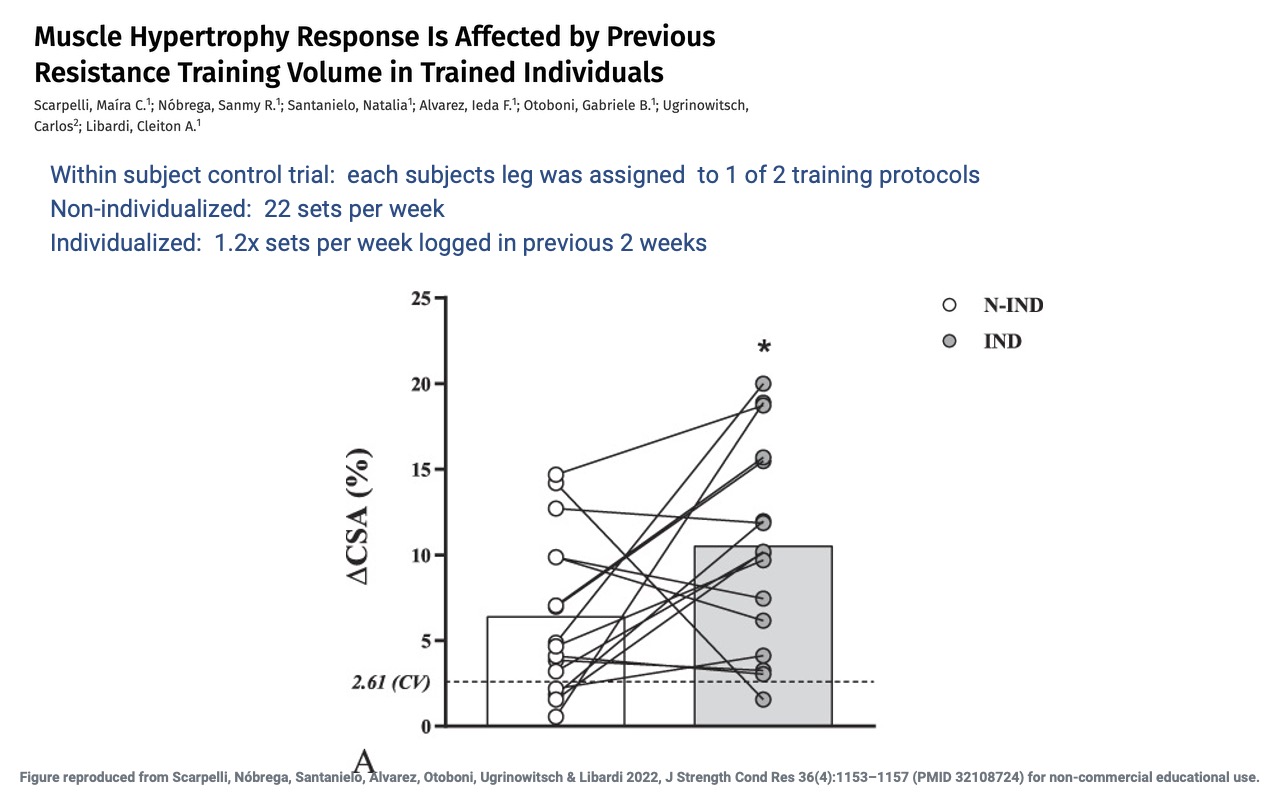
Individualized Volume Yields Greater Hypertrophy
- The individualized protocol produced ~10.5% ΔCSA vs. ~6.5% for non-individualized — a statistically significant advantage.
- Suggests that for already-trained individuals, matching training volume to recent training history drives larger hypertrophy than a fixed protocol.
- Aligns with the principle of progressive overload: progress requires stimulus relative to the individual’s current state, not an absolute target.
Slide 27
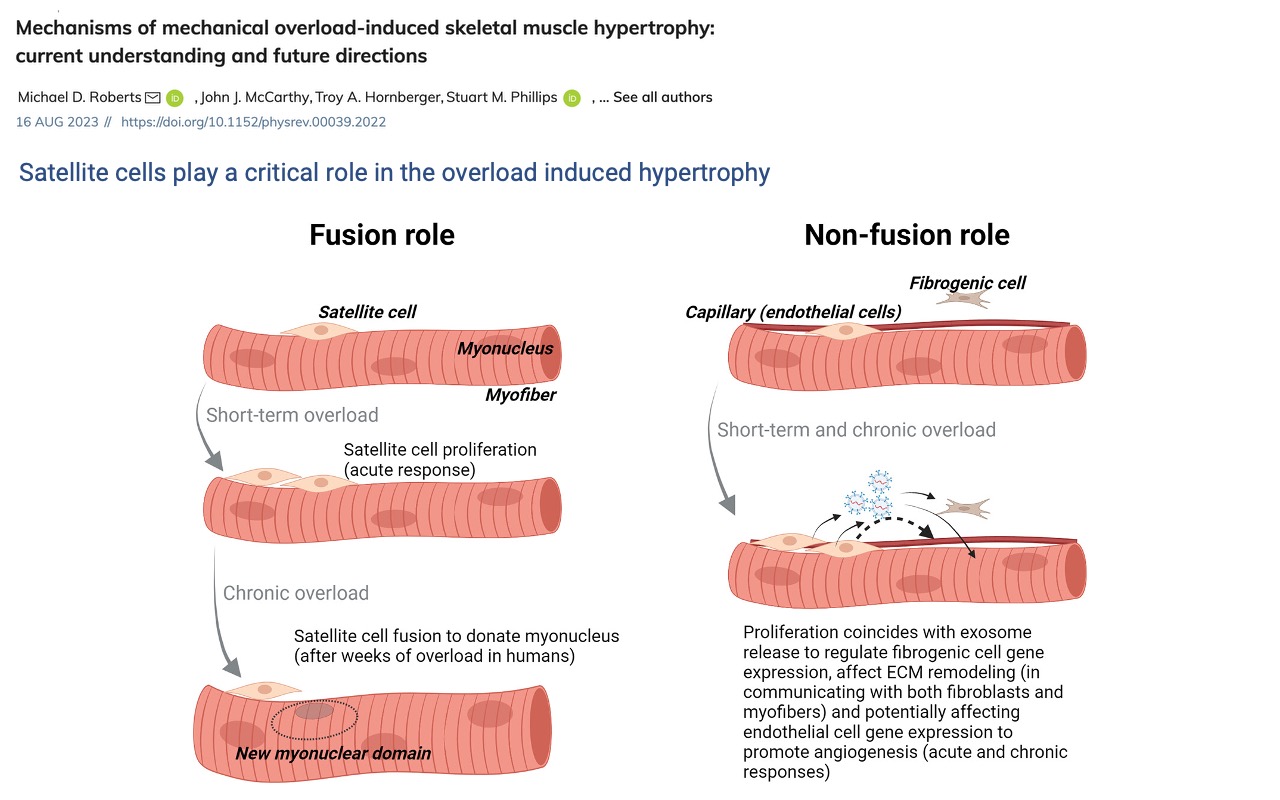
Two Roles for Satellite Cells in Hypertrophy
- Fusion role — under chronic overload, satellite cells donate myonuclei to existing fibers (the cellular basis of Slide 19).
- Non-fusion role — satellite cells release exosomes that modulate gene expression in fibroblasts and endothelial cells, supporting ECM remodeling and angiogenesis in step with hypertrophy.
- Both roles position satellite cells as the central regulator of long-term muscle adaptation.
Slide 28

Class Activity — Open Questions on Muscle
- A reflection prompt to close the muscle physiology unit.
- Students were asked to identify a topic of greatest curiosity and a remaining area of confusion — useful for guiding the Friday review.
Slide 29
Learning Objectives — Recap
- Training principles — overload, progression, specificity, reversibility — set the stimulus and time course of all adaptations. Detraining shows two distinct decay rates, and prior training accelerates retraining (“muscle memory”).
- Endurance training raises VO2 max in two phases: rapid central gains (cardiac output, stroke volume) over months, and slower peripheral gains (capillary density, mitochondria) over years.
- Endurance signaling uses Ca2+, AMP/ATP, and free radicals → AMPK/CaMK → PGC-1α → mitochondrial biogenesis.
- Resistance signaling uses mechanoreceptor activation → mTOR → protein synthesis → hypertrophy + myonuclear addition.
- Concurrent training can blunt strength gains because endurance signaling (AMPK) inhibits mTOR.
Glossary of Key Terms
| Term | Definition |
|---|---|
| Overload | Physical stress greater than usual in amount or intensity that elicits adaptive plasticity in the trained system. |
| Progression | The need to continually increase the training stimulus once a fitness level is reached; small progressive increases minimize injury risk. |
| Specificity | Adaptations are specific to the body systems, muscle groups, contraction types, velocities, and ranges of motion trained — they do not transfer broadly (e.g., the one-leg study, Slide 11). |
| Reversibility | Loss of training-induced gains when training stops; cardiovascular adaptations decay fastest, peripheral and structural adaptations more slowly. |
| Supercompensation | The recovery cycle in which fitness dips below baseline immediately after an overload bout, then rebounds above baseline during recovery and adaptation. |
| Overtraining | Progressive decline in performance when training stress exceeds recovery capacity; risk increases with poor nutrition, sleep, or high stress. |
| Detraining | Decline in fitness after training stops. Beneficial effects diminish within ~2 weeks of substantially reduced activity and can fully disappear within 2–8 months. |
| Muscle memory | Faster regain of fitness on retraining than during the original training process — supported by retained myonuclei (cellular component) and DNA methylation patterns (epigenetic component). Mitochondrial content recovers within ~4 weeks and strength within ~6 weeks. |
| Cardiac output (Q) | Heart rate × stroke volume; rises with training mainly via increased stroke volume and accounts for most of the short-term VO2 max gain. |
| Stroke volume (SV) | Volume of blood ejected per heartbeat; the most rapidly trained — and most rapidly detrained — cardiovascular variable. |
| a-v O2 difference | Difference between arterial and venous O2 content; rises slowly with peripheral adaptation (capillary density, mitochondrial density) and accounts for most of the long-term VO2 max gain. |
| VO2 max | Maximal rate of oxygen consumption during exercise; the canonical metric of aerobic capacity. Average training improvement is 15–20%; ~50% of inter-individual variation is heritable. |
| Trainability | The magnitude of adaptive response to a given training stimulus. Strongly influenced by genetics: low responders may gain only 2–3% in VO2 max, while high responders can gain ~50%. ~80% of inter-individual variation in the hypertrophy response is heritable. |
| O2 deficit | Shortfall between O2 demand and O2 uptake at the start of exercise; reduced by training, which also lowers lactate accumulation and phosphocreatine depletion at onset of work. |
| PGC-1α | Master transcriptional coactivator that drives mitochondrial biogenesis after endurance training. |
| AMPK | AMP-activated protein kinase; an energy sensor that activates endurance signaling (via PGC-1α) and inhibits mTOR (via TSC1/2) — the molecular basis of concurrent-training interference. |
| mTOR | Mammalian target of rapamycin; the kinase that initiates protein synthesis in response to resistance-training mechanoreceptor activation. |
| TSC1/2 | Tuberous sclerosis complex; an inhibitor of mTOR activated by AMPK during endurance training. |
| Hypertrophy | Increase in muscle fiber size (cross-sectional area); the dominant long-term resistance-training adaptation in humans, detectable within ~3 weeks of training initiation. |
| Hyperplasia | Increase in muscle fiber number; observed in animal models but with limited evidence in humans. |
| Myonucleus / myonuclear domain | Each multinucleated muscle fiber’s nuclei and the cytoplasmic territory each nucleus supports; more myonuclei expand the fiber’s capacity for rapid protein synthesis during retraining. |
| Satellite cell | Resident muscle stem cell that proliferates and either fuses with fibers to donate new myonuclei (fusion role) or releases exosomes that regulate ECM remodeling and angiogenesis (non-fusion role). |
| Antioxidant enzyme capacity | Enzymatic capacity to neutralize free radicals produced during exercise; can rise by ~100% over 12 weeks of training. |
| Type I / IIa / IIx fibers | Slow oxidative / fast oxidative-glycolytic / fast glycolytic fiber types. Resistance training produces a small IIx → IIa shift; type IIx fibers shrink most during detraining. |
| Specific force | Force per unit cross-sectional area of contractile protein; rises in type I fibers with resistance training. |
| Maximum voluntary contraction (MVC) | Largest force a person can produce voluntarily; less than the muscle’s true maximum because the nervous system imposes a safety factor. Training (and adrenaline) can partially override this. |
| Concurrent training | Combined endurance + resistance training; can produce smaller strength gains than resistance alone because endurance signaling activates AMPK → TSC → inhibits mTOR. |
| Responder / non-responder | Individuals at the high or low end of the genetically influenced range of trainability for a given variable. |