Lecture 11: Introduction to Muscle Structure and Function 1 — Cellular Scale
Slide 1
- Opens the muscle physiology section of the course, shifting focus from the oxygen supply cascade to the structures that actually generate movement.
- Builds from the subcellular scale (contractile proteins, calcium handling) toward the whole-body scale across the next several lectures.
- Central theme: trade-offs are present at every structural level — between speed, force, fatigue resistance, and economy.
Slide 2
Learning Objectives
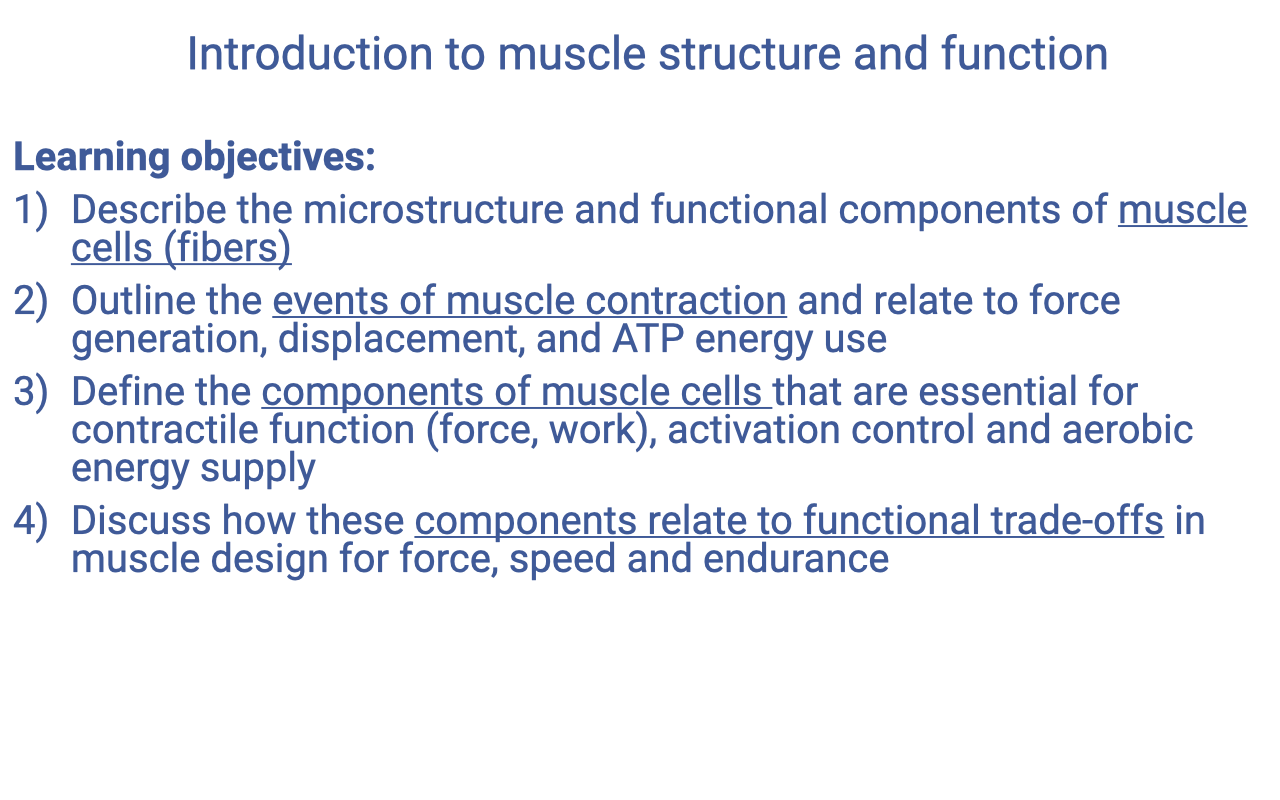
- Describe the microstructure and functional components of muscle cells (fibers).
- Outline the events of muscle contraction and relate them to force generation, displacement, and ATP energy use.
- Define the components of muscle cells that are essential for contractile function (force, work), activation control, and aerobic energy supply.
- Discuss how these components relate to functional trade-offs in muscle design for force, speed, and endurance.
Slide 3
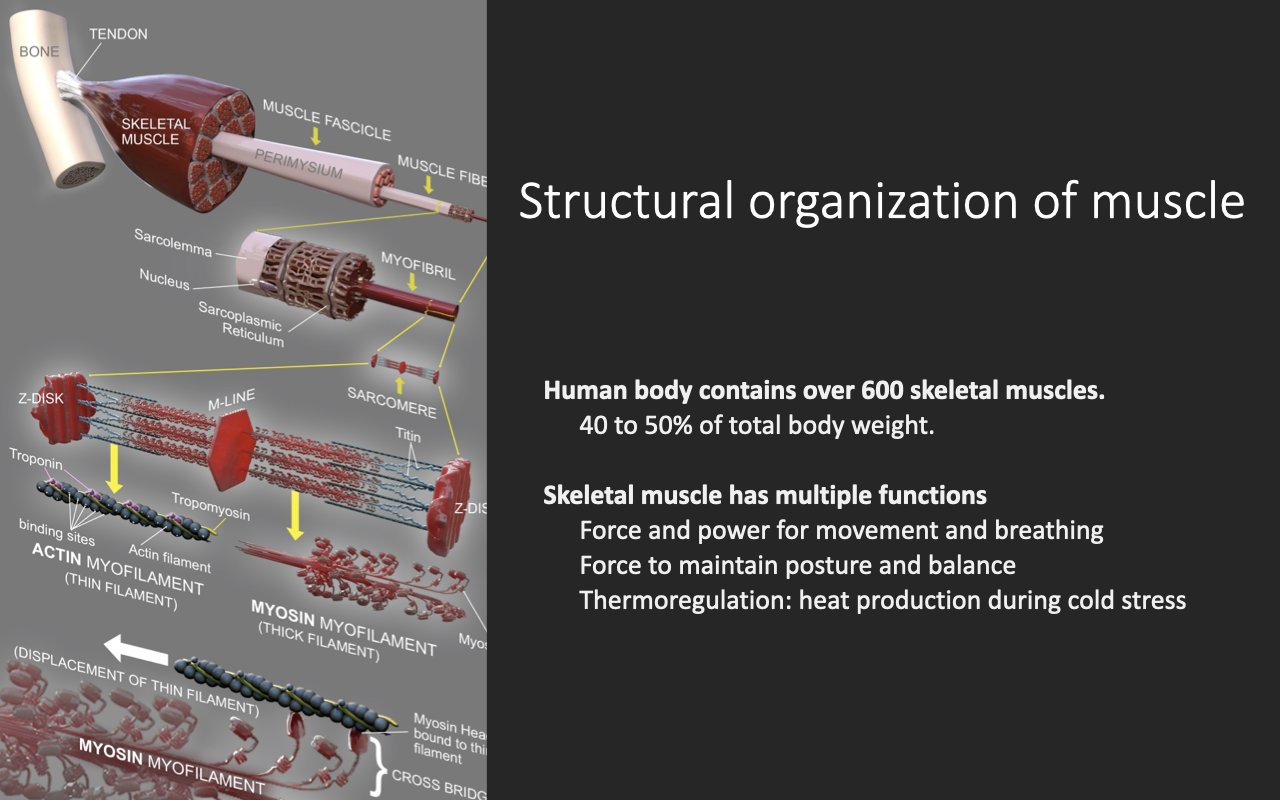
The Hierarchical Organization of Skeletal Muscle
- Skeletal muscle is organized hierarchically: whole muscle → fascicles → muscle fibers (myofibers) → myofibrils → sarcomeres (actin + myosin).
- The human body contains over 600 skeletal muscles, accounting for 40–50% of total body weight.
- Skeletal muscle serves multiple functions:
- Force and power for movement and breathing (e.g., diaphragm — failure is life-threatening).
- Postural and balance control via small tonic force production.
- Thermoregulation via shivering and basal heat production.
- Muscle function is also strongly temperature-dependent: outside its physiological temperature range, force, power, and efficiency all decline.
Slide 4
Muscle Fiber Anatomy and Specialized Terminology
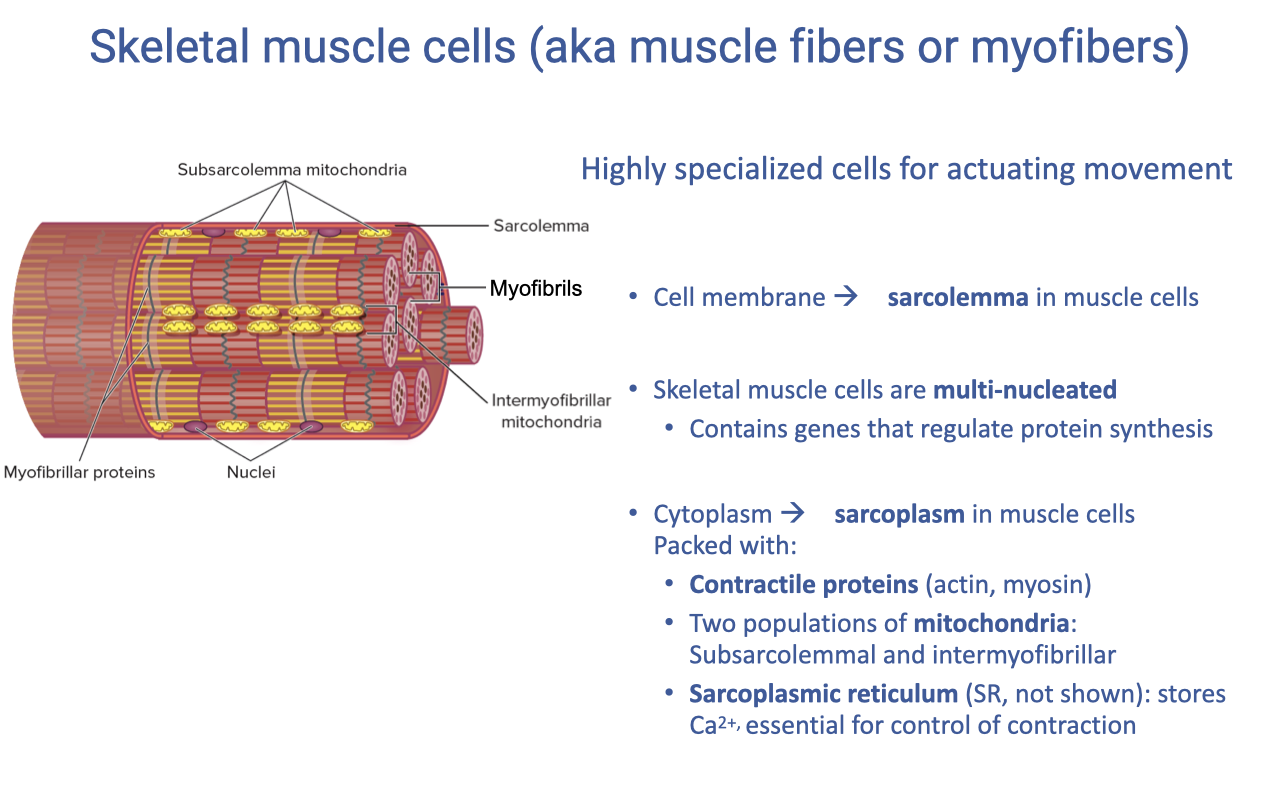
- Skeletal muscle cells (myofibers) are highly specialized for actuating movement, with much of the cell volume devoted to contractile machinery rather than typical organelles.
- Specialized terminology for muscle cells:
- Sarcolemma — the muscle cell membrane (specialized for transmitting action potentials).
- Sarcoplasm — the muscle cytoplasm.
- Sarcoplasmic reticulum (SR) — Ca2+ storage organelle (analogous to ER).
- Skeletal muscle is multi-nucleated with nuclei distributed along the fiber length, enabling rapid local regulation of protein synthesis in response to changing mechanical or metabolic demand.
- The sarcoplasm is packed with:
- Contractile proteins: actin, myosin, plus structural and regulatory proteins (titin, troponin).
- Mitochondria in two distinct populations (see next slide).
- Sarcoplasmic reticulum for Ca2+ handling.
Slide 5
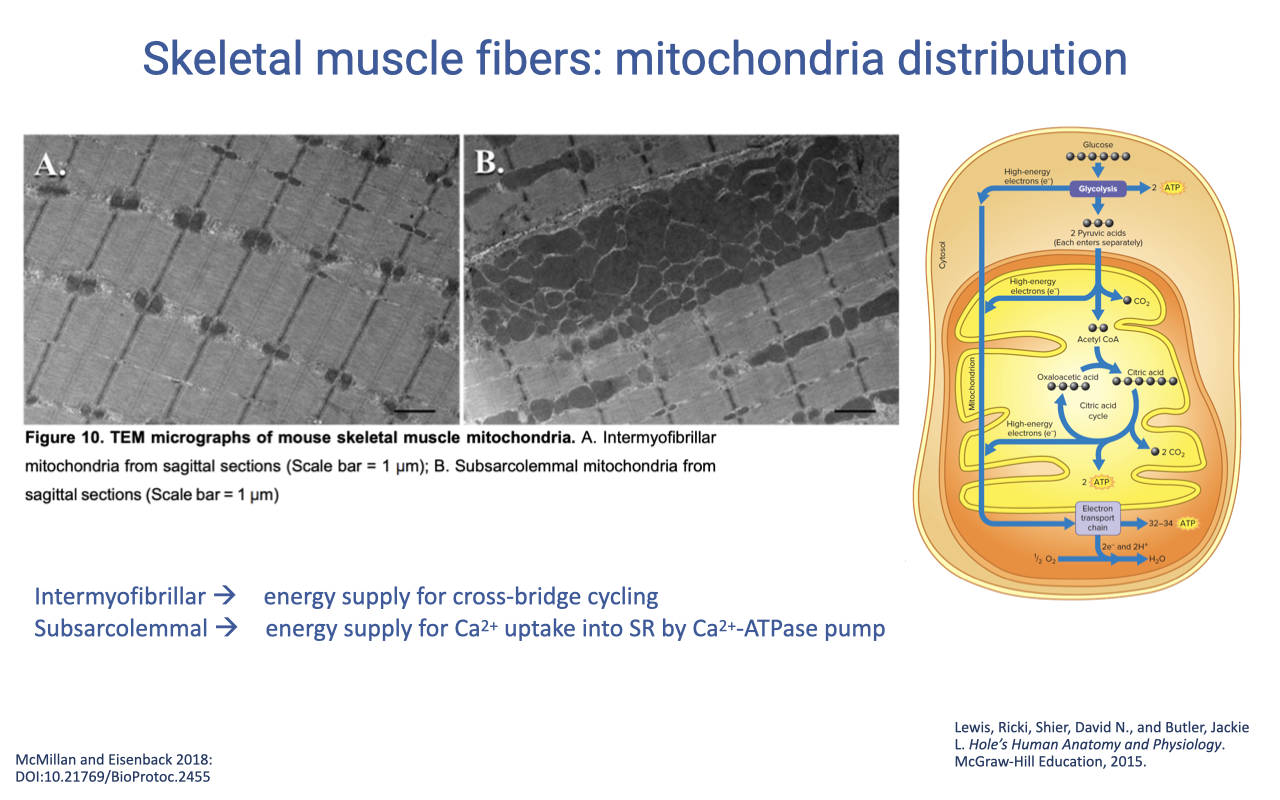
Two Populations of Mitochondria
- Skeletal muscle has two morphologically and functionally distinct mitochondrial populations:
- Intermyofibrillar mitochondria — distributed in arrays between contractile filaments; supply ATP for cross-bridge cycling.
- Subsarcolemmal mitochondria — packed beneath the sarcolemma; supply ATP for Ca2+ uptake into the SR by the Ca2+-ATPase pump.
- This spatial partitioning matches ATP production sites to local ATP-consuming machinery.
Slide 6
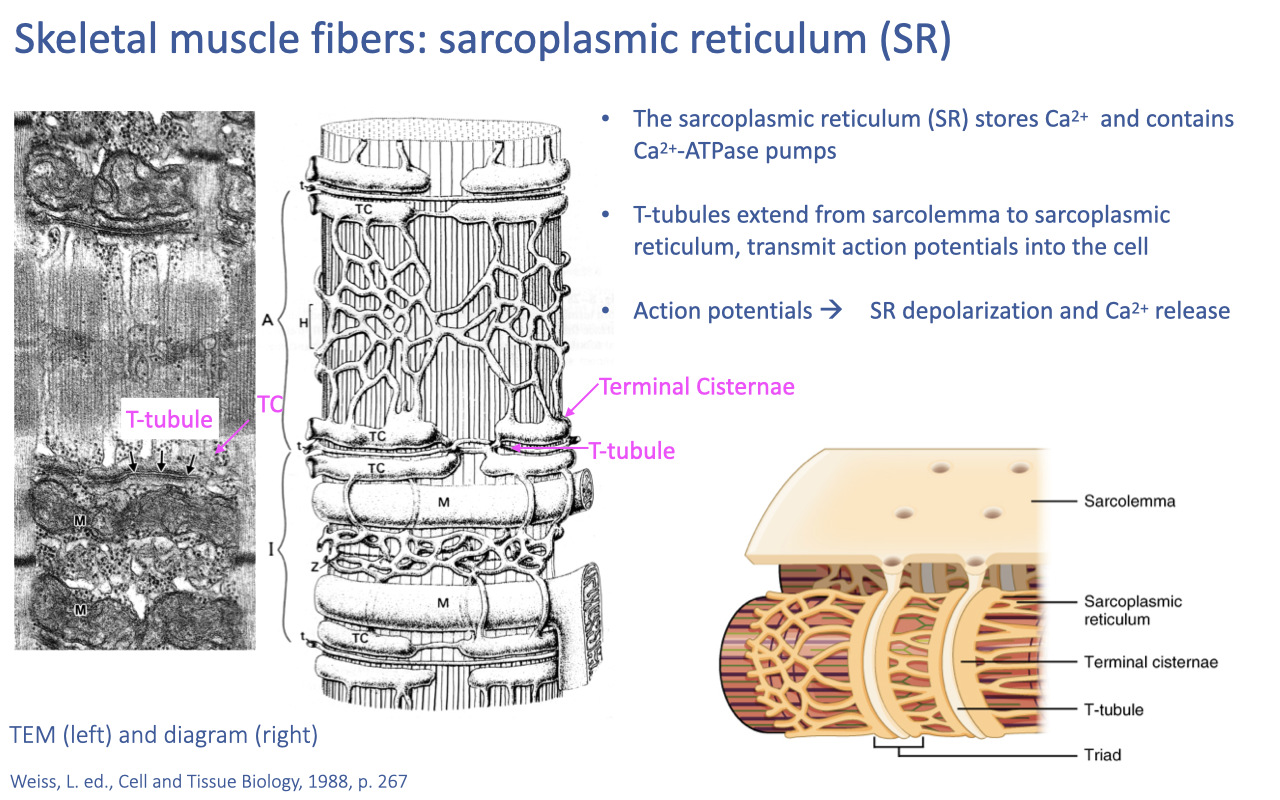
Sarcoplasmic Reticulum and Excitation–Contraction Coupling
- The sarcoplasmic reticulum (SR) is a dense network of tubules that stores Ca2+ and contains Ca2+-ATPase pumps for re-sequestering Ca2+ after each contraction.
- T-tubules are invaginations of the sarcolemma that extend into the cell interior, contacting the SR at the triad (T-tubule + two terminal cisternae).
- Excitation–contraction coupling: action potentials originate at the neuromuscular junction, propagate along the sarcolemma, are carried into the cell via T-tubules, depolarize the SR, and trigger Ca2+ release into the sarcoplasm.
Slide 7
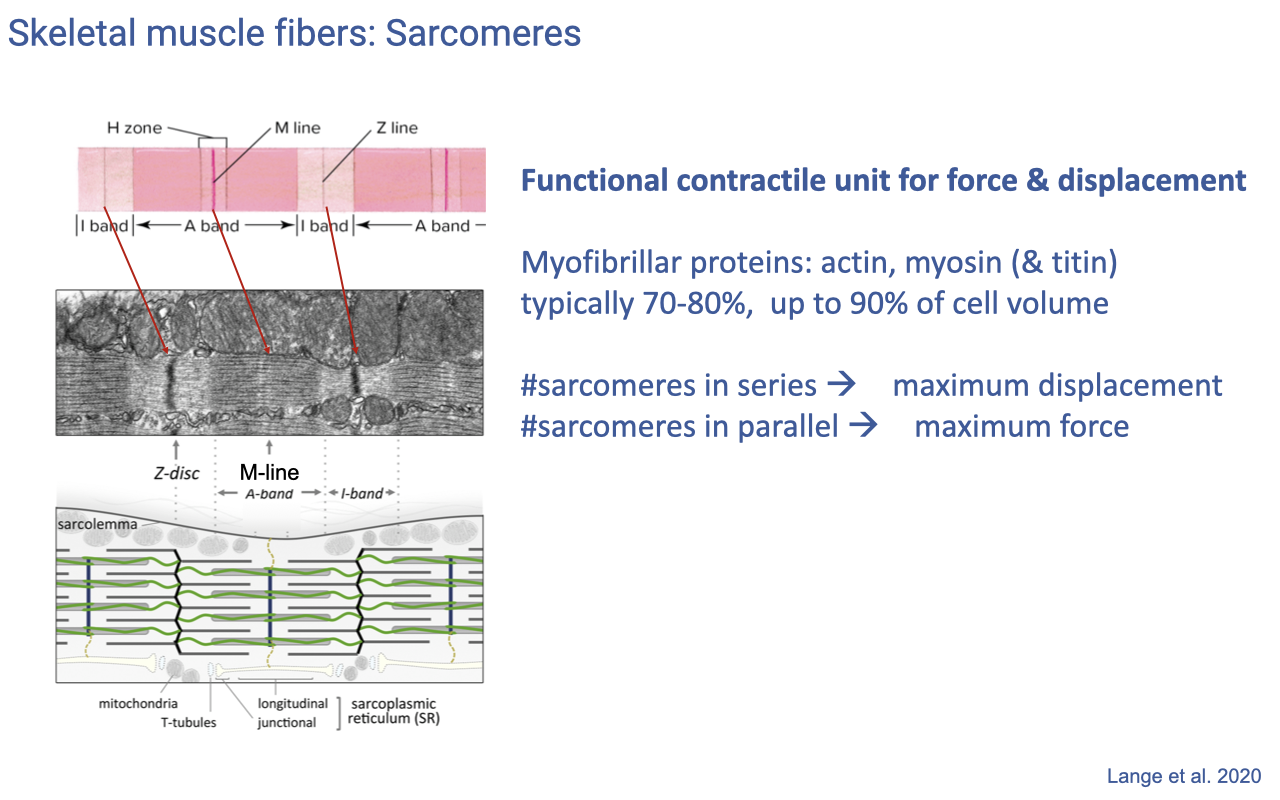
Sarcomeres — The Functional Unit of Force and Displacement
- The sarcomere is the functional contractile unit of muscle, defined between two Z-discs with overlapping actin (thin) and myosin (thick) filaments and the structural protein titin.
- Myofibrillar proteins typically occupy 70–80% (up to 90%) of muscle cell volume — leaving little room for organelles.
- Architectural rules linking sarcomere arrangement to function:
- Sarcomeres in series → determine maximum displacement (range of shortening).
- Sarcomeres in parallel (cross-section) → determine maximum force.
Slide 8
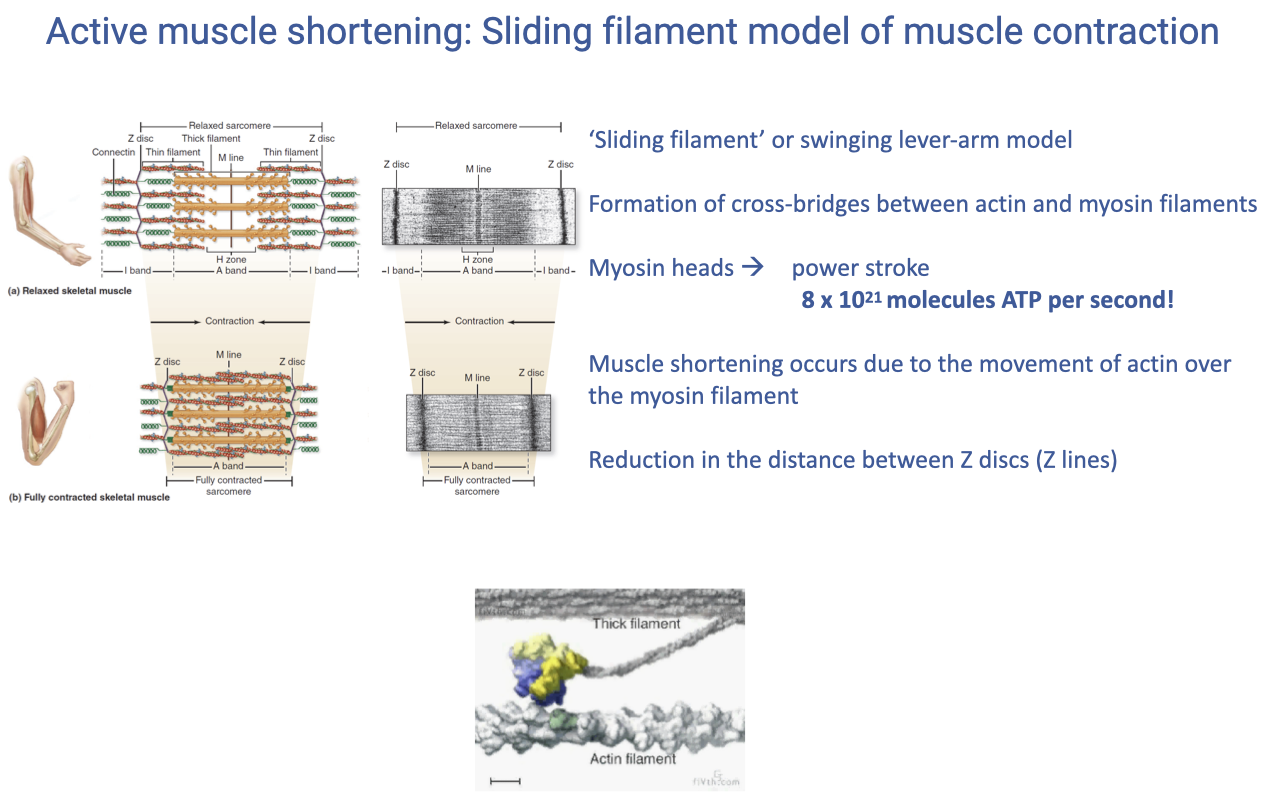
The Sliding Filament Model
- The sliding filament (or swinging lever-arm) model explains how molecular cross-bridge cycling produces sarcomere shortening.
- Cross-bridges form between myosin heads and actin binding sites; the myosin head undergoes a power stroke that ratchets actin past myosin.
- The result is shortening of the sarcomere — the Z-discs are pulled closer to the M-line — without any change in the length of the actin or myosin filaments themselves.
- The molecular flux is enormous: a contracting muscle can cycle ~$8 \times 10^{21}$ molecules of ATP per second across all of its myosin heads.
Slide 9
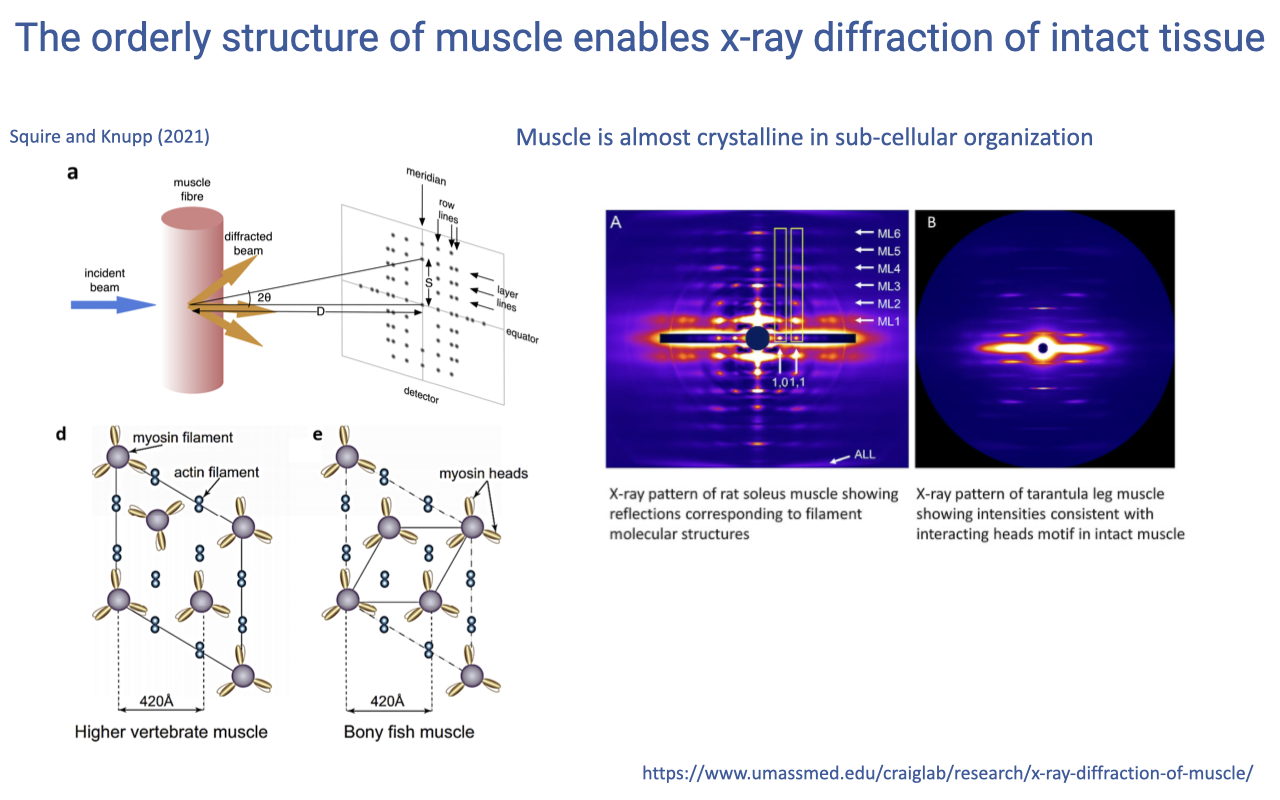
Crystalline Order Enables X-ray Diffraction in Living Muscle
- Muscle’s near-crystalline subcellular organization (a regular hexagonal lattice of actin and myosin filaments) makes it uniquely amenable to X-ray diffraction, an experimental technique normally used for crystallized molecules.
- Diffraction patterns from intact muscle (cobra, barnacle leg) show intense reflections corresponding to the regular spacing of contractile proteins.
- This allows direct measurement of molecular dynamics in living, intact muscle tissue — something impossible for almost any other vertebrate tissue.
Slide 10
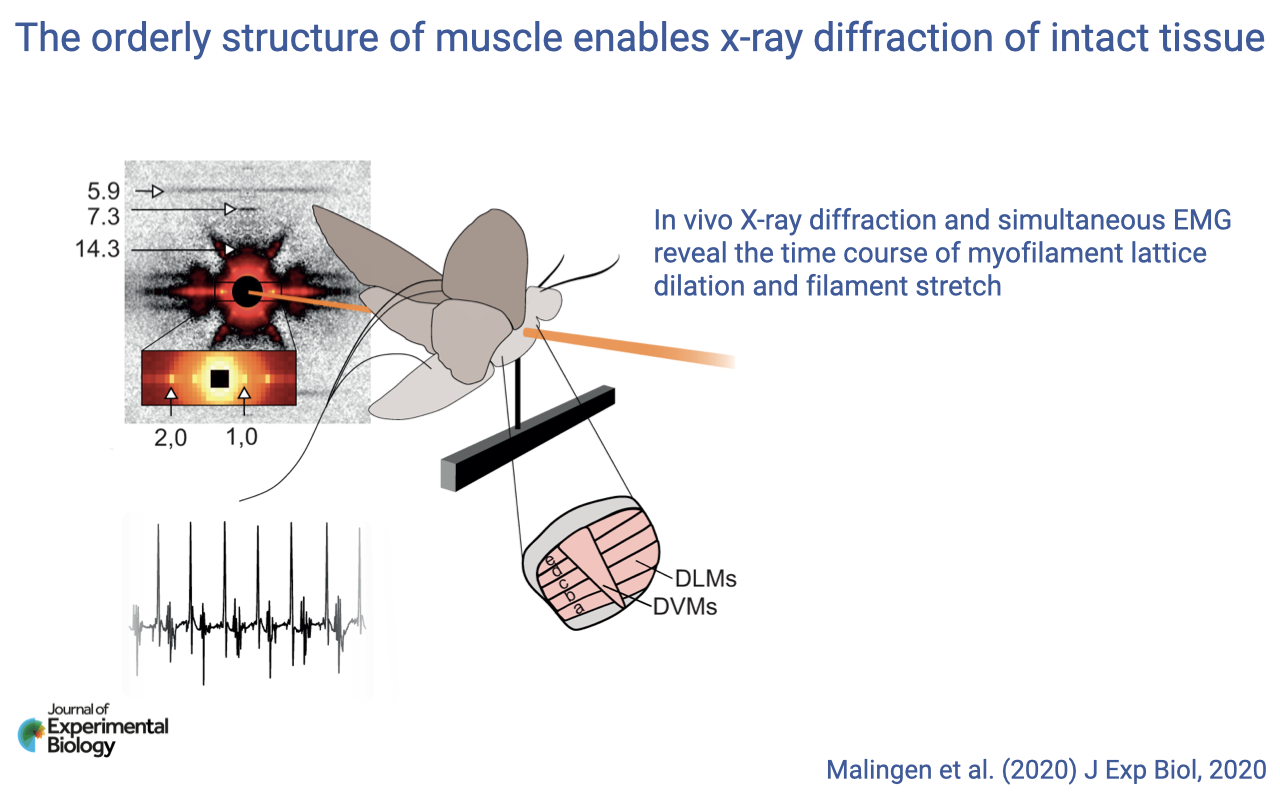
In Vivo X-ray Diffraction in Flying Insects
- Tethered insects such as hawkmoths can be flown inside an X-ray beam while their flight muscles (DLMs and DVMs) are simultaneously imaged and EMG-recorded.
- This setup reveals the time course of myofilament lattice dilation and filament stretch during real-time contractions.
- Demonstrates how muscle’s molecular organization allows researchers to integrate molecular dynamics with whole-body movement in a single experiment.
Slide 11
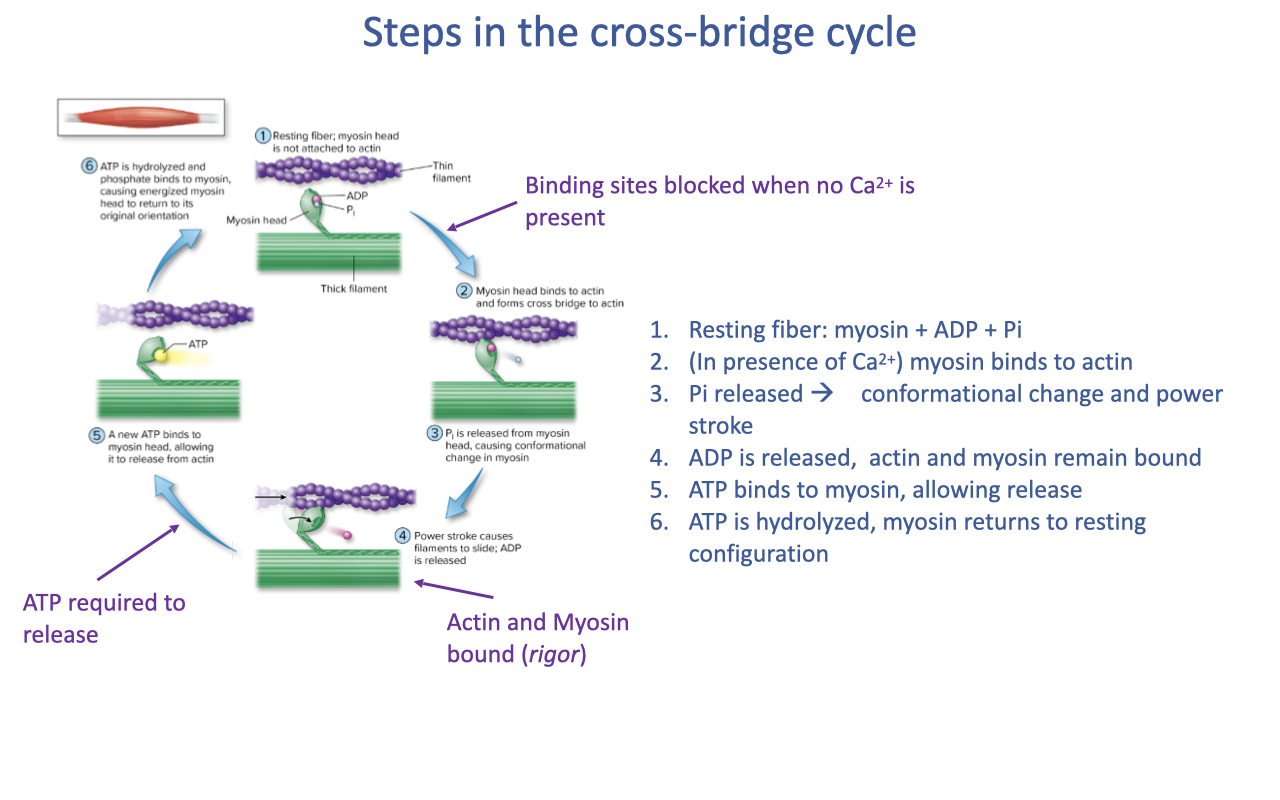
The Cross-Bridge Cycle (Six Classical Steps)
- Resting fiber: myosin head bound to ADP + Pi, not attached to actin.
- In the presence of Ca2+, troponin moves tropomyosin off actin’s binding sites; myosin binds to actin and forms a cross-bridge.
- Pi released from myosin → conformational change.
- Power stroke: actin slides past myosin, ADP released; myosin remains tightly bound (the rigor state).
- A new ATP binds to myosin → cross-bridge releases from actin.
- ATP is hydrolyzed to ADP + Pi, re-energizing the myosin head and returning it to its original orientation. Cycle repeats.
- ATP is required to release the cross-bridge, not to form it. This is why rigor mortis occurs after death — without ATP, cross-bridges remain bound until proteins denature.
Slide 12
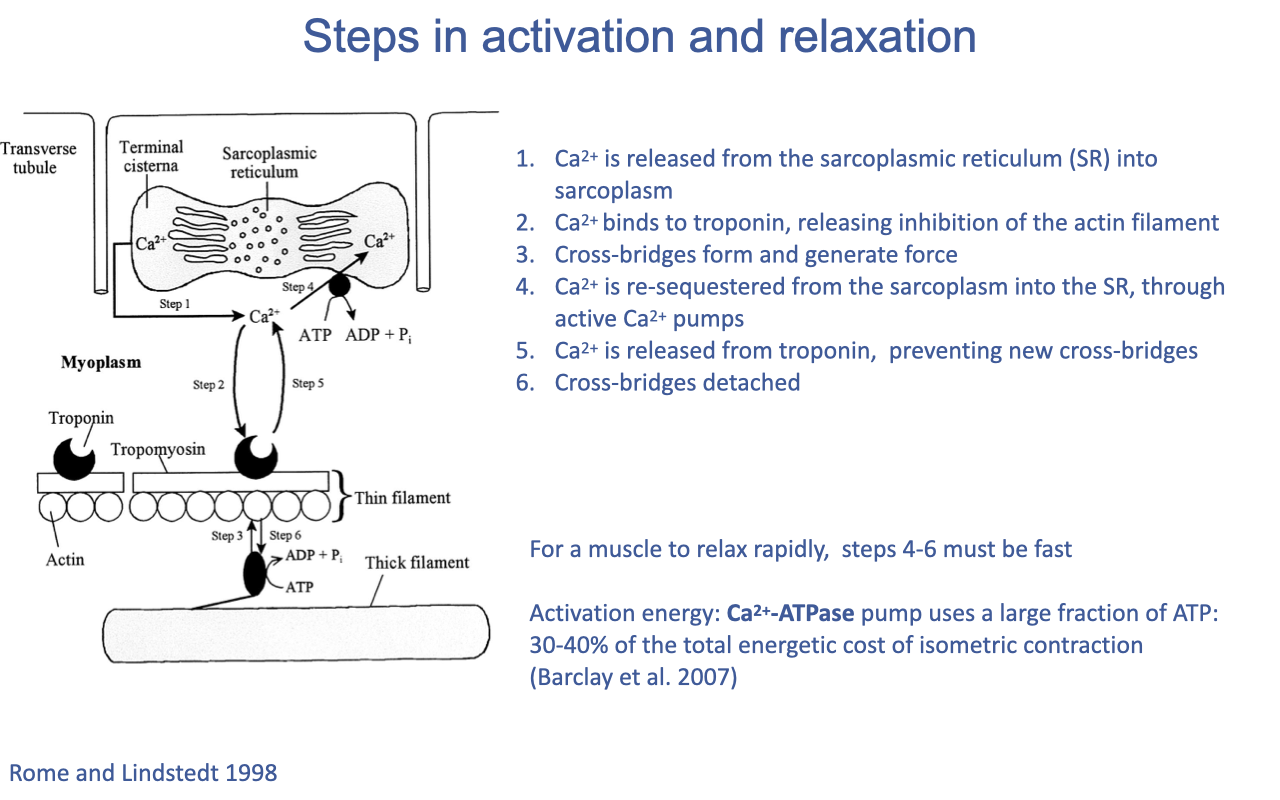
The Activation–Relaxation Cycle (Calcium Cycling)
- Action potential → Ca2+ released from SR into the sarcoplasm.
- Ca2+ binds troponin, displacing tropomyosin and exposing actin binding sites.
- Cross-bridges form, generate force, and cycle (links to Slide 11).
- Ca2+ is re-sequestered into the SR by Ca2+-ATPase pumps (SERCA).
- As sarcoplasmic [Ca2+] falls, Ca2+ dissociates from troponin → tropomyosin re-blocks binding sites → no new cross-bridges form.
- Existing cross-bridges complete their cycles and detach → relaxation.
- Speed of relaxation depends on steps 4–6 — that is, on Ca2+ re-sequestration kinetics.
- The Ca2+-ATPase pump is a major ATP consumer: an estimated 30–40% of the total energetic cost of isometric contraction is spent on calcium cycling (not cross-bridge cycling itself; Barclay et al. 2007).
Slide 13
![Slide titled "Twitch contraction kinetics vary by fiber type" with two pairs of plots from Rome and Lindstedt 1998. Panel A (left): toadfish red (r), white (w), and superfast (s) fibers at 16°C — top plot shows force vs. time, with red = slow twitch, white = fast twitch, superfast = much faster decay; bottom plot shows free [Ca²⁺] transients over time. Panel B (right): sonic fibers from toadfish (rs35) and rattlesnake (s16) at expanded time scale (~30× faster than panel A) — extremely rapid Ca²⁺ release and reuptake. Annotations: speed of contraction relates to (1) SR Ca²⁺-ATPase → Ca²⁺ dynamics, activation/relaxation rate; (2) troponin isoforms → actin–myosin binding; (3) myosin isoforms → cross-bridge cycling and detachment.](/E183_ExercisePhysiology/week05/images/lec11/slide-013.png)
Twitch Kinetics Vary By Fiber Type
- Single-fiber experiments allow simultaneous measurement of force and free [Ca2+] following an action potential.
- Across toadfish red, white, and superfast fibers, twitch duration spans more than an order of magnitude:
- Red (slow oxidative): long, slow twitch.
- White (fast glycolytic): shorter twitch.
- Superfast / sonic (toadfish swim bladder, rattlesnake tail-shaker): extraordinarily rapid Ca2+ release and reuptake — twitches complete in ~10–20 ms.
- Three molecular determinants of contraction speed:
- SR Ca2+-ATPase isoforms → Ca2+ cycling dynamics, activation/relaxation rate.
- Troponin isoforms → actin–myosin binding regulation.
- Myosin isoforms → cross-bridge cycling and detachment rate.
- Historically, myosin isoforms were the focus of fiber-type classification; modern work shows that all three vary together and contribute to fiber speed.
Slide 14
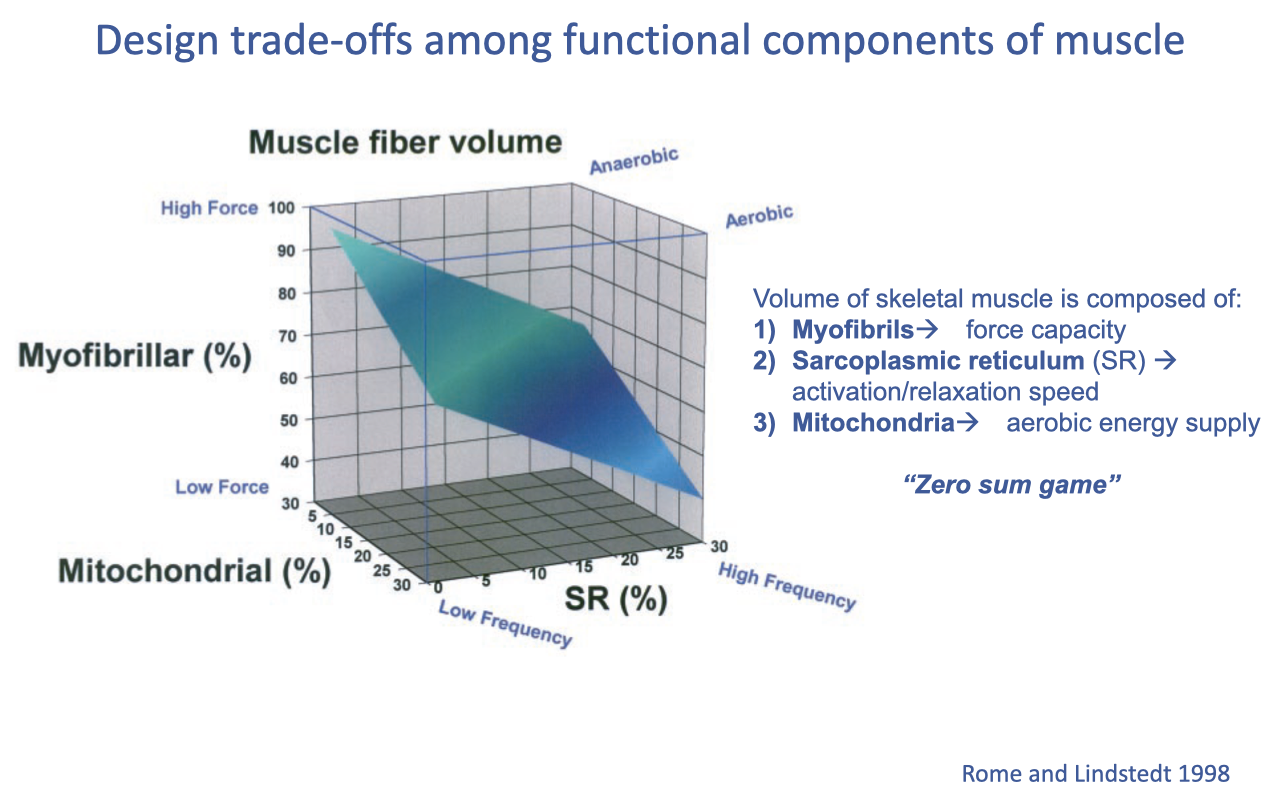
The “Zero-Sum Game” of Muscle Volume Fractions
- A given muscle fiber volume must be partitioned among three competing components:
- Myofibrils → force capacity
- Sarcoplasmic reticulum (SR) → activation/relaxation speed
- Mitochondria → aerobic energy supply
- Increasing one component necessarily reduces space available for the others — the “zero-sum game” (Rome & Lindstedt 1998).
- Approximate ranges:
- SR: ~5% (slower fibers) up to ~30% (superfast specialists).
- Mitochondria: ~5% (anaerobic fibers) up to ~30% (highly aerobic fibers).
- The remainder is myofibrils (70–90%).
- Result: muscle fibers occupy a continuum on this trade-off surface depending on their functional specialization.
Slide 15
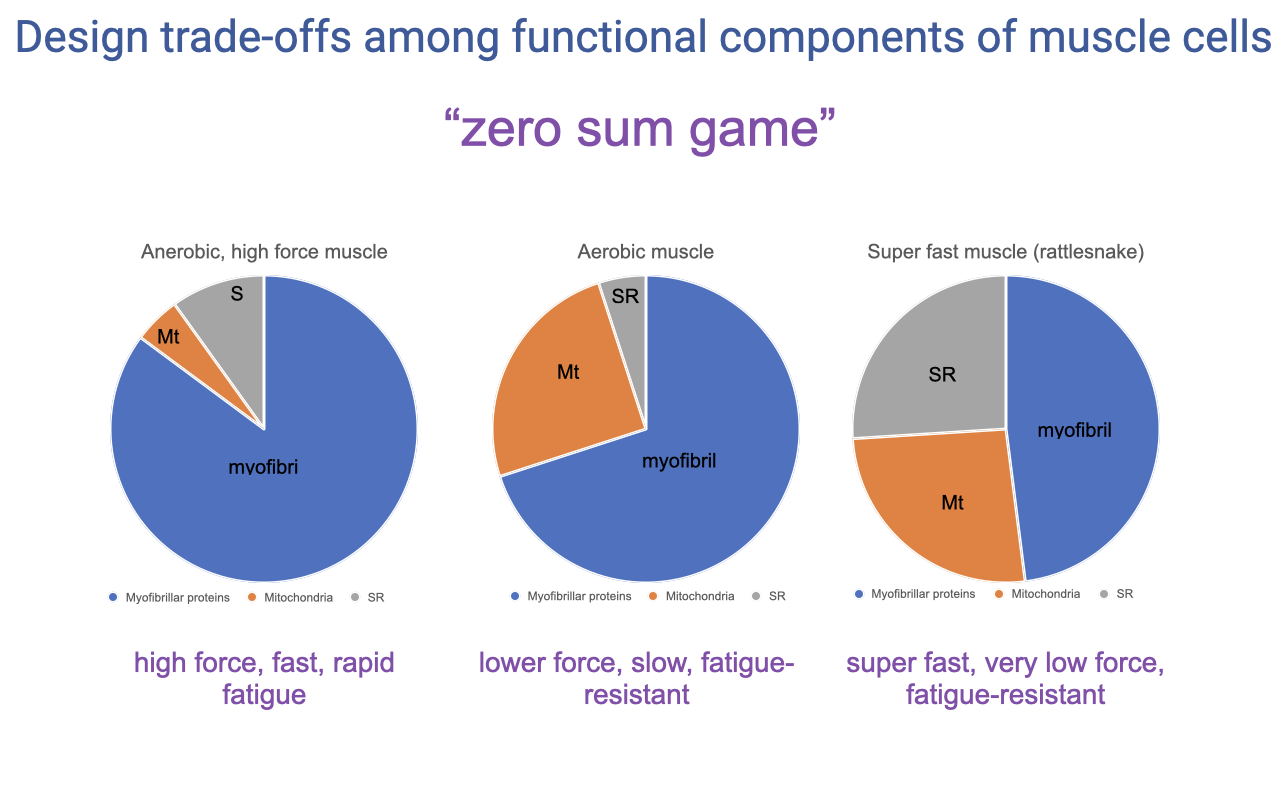
Three Cellular Designs Visualized
| Muscle type | Myofibrils | Mitochondria | SR | Functional profile |
|---|---|---|---|---|
| Anaerobic, high-force (e.g., white fiber) | ~85% | ~5% | ~10% | High force, fast, rapid fatigue |
| Aerobic (e.g., type I red fiber) | ~70% | ~25% | ~5% | Lower force, slow, fatigue-resistant |
| Super fast (e.g., rattlesnake tail-shaker) | ~50% | ~20% | ~30% | Super fast, very low force, fatigue-resistant |
- Each design reflects a different solution to the volume-fraction trade-off, optimized for a different functional role.
- Most vertebrate muscles are mixed fiber types — fish are an exception (red and white muscle in distinct anatomical compartments).
- Fiber type is highly plastic — cross-reinnervation experiments (transplanting nerves between fast and slow muscles) demonstrate that fiber type can switch in response to neural activation pattern.
Slide 16
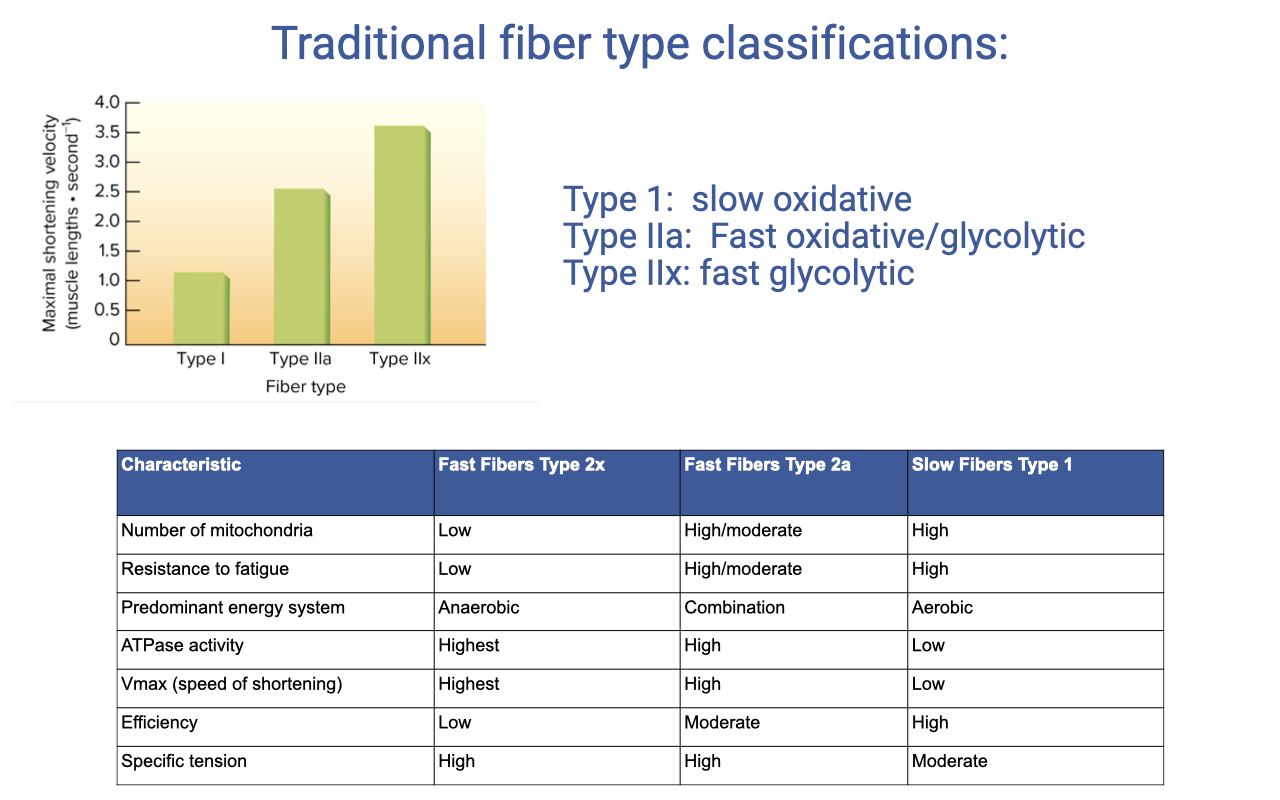
Traditional Fiber Type Classifications
- Three textbook categories, based on histochemical staining:
- Type I — slow oxidative
- Type IIa — fast oxidative/glycolytic
- Type IIx (also IIb in rodents) — fast glycolytic
- Maximum shortening velocity scales: Type IIx > IIa > I.
| Characteristic | Type IIx (fast glycolytic) | Type IIa (fast oxidative) | Type I (slow oxidative) |
|---|---|---|---|
| Number of mitochondria | Low | High/moderate | High |
| Resistance to fatigue | Low | High/moderate | High |
| Predominant energy system | Anaerobic | Combination | Aerobic |
| ATPase activity | Highest | High | Low |
| Vmax (speed of shortening) | Highest | High | Low |
| Efficiency | Low | Moderate | High |
| Specific tension | High | High | Moderate |
- Categories are useful but represent points on a continuum — within-fiber-type variation in mitochondrial, SR, and protein-isoform composition is substantial.
Slide 17
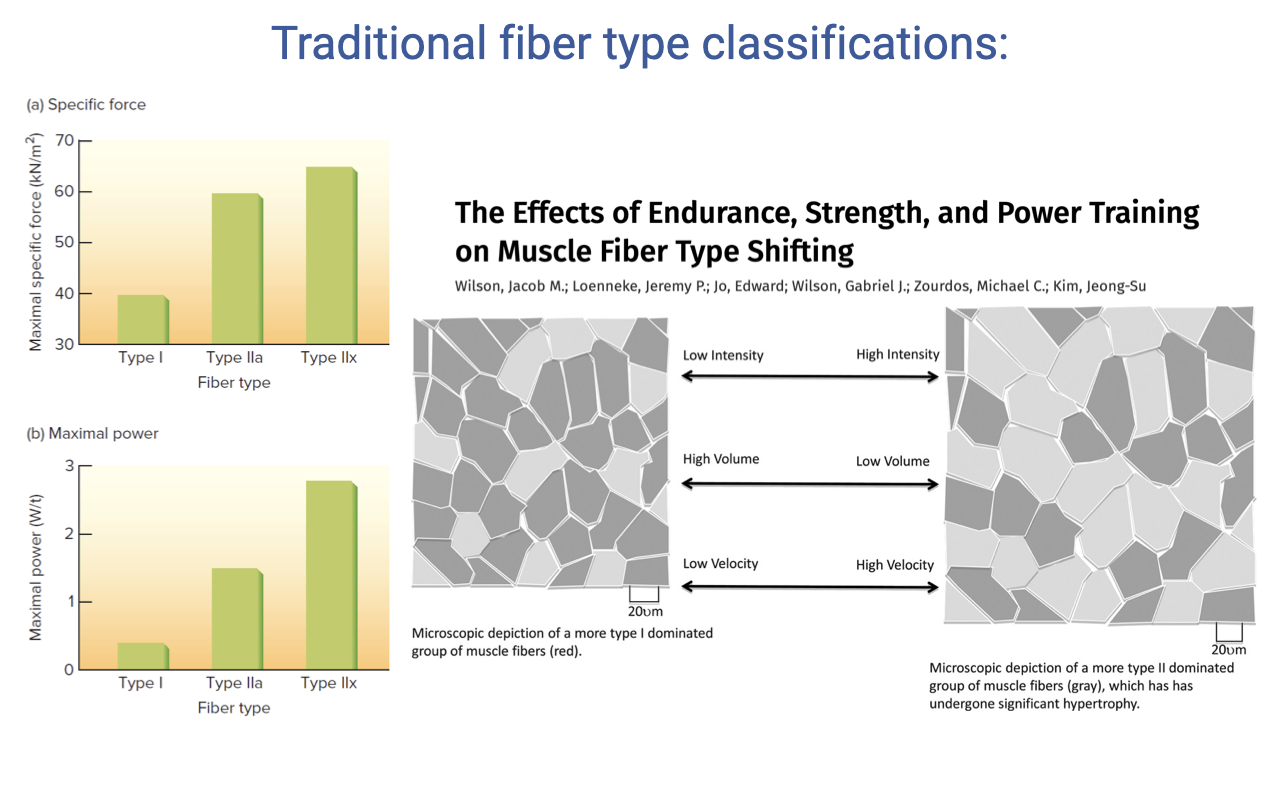
Fiber Type Shifts With Training
- Type II fibers have higher specific force and higher maximum power than Type I, but at the cost of fatigue resistance.
- Training-induced fiber type shifts:
- Endurance training (low intensity, high reps) → shift toward oxidative fibers (lower force, fatigue-resistant).
- High-intensity, low-rep strength/power training → shift toward fast glycolytic fibers (higher force, more fatigable).
- These shifts demonstrate the plasticity of fiber type within an individual.
Slide 18
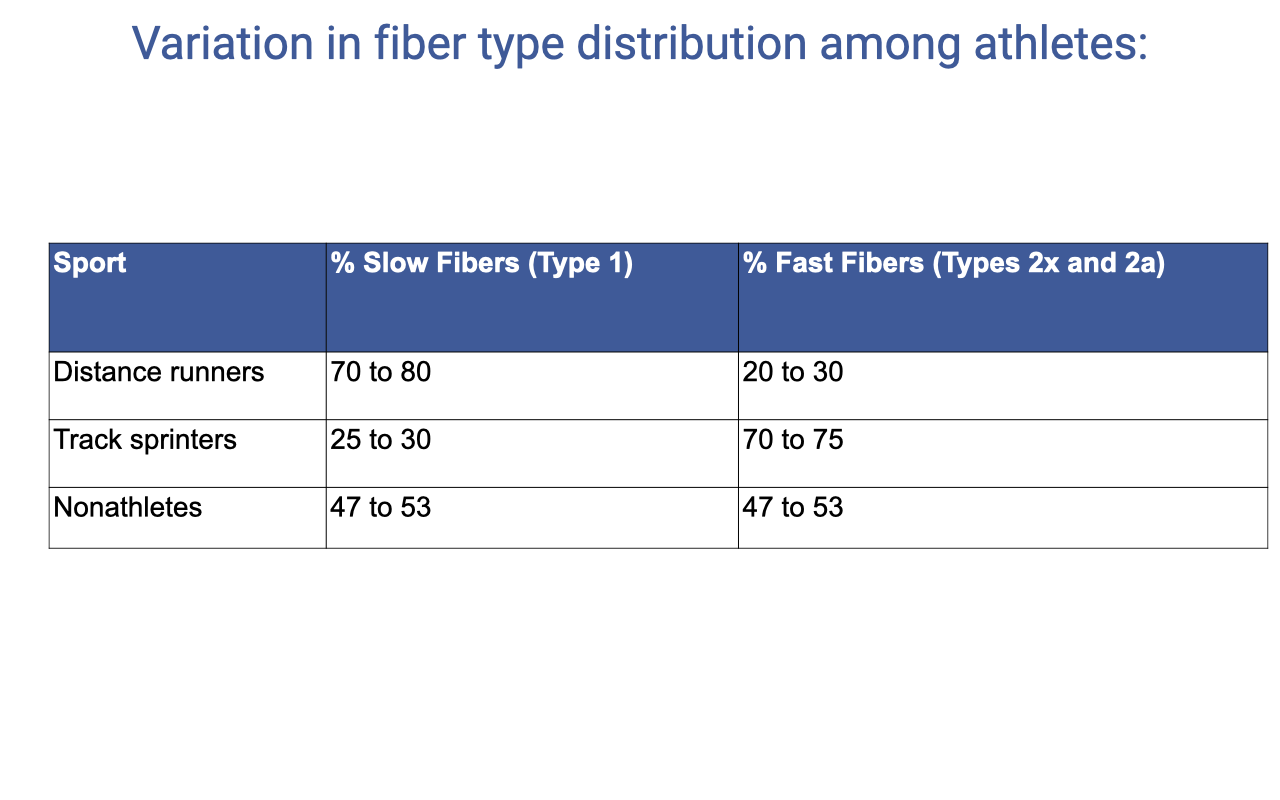
Fiber Type Distribution Across Athletes
| Sport | % Slow Fibers (Type I) | % Fast Fibers (Types IIx + IIa) |
|---|---|---|
| Distance runners | 70–80 | 20–30 |
| Track sprinters | 25–30 | 70–75 |
| Nonathletes | 47–53 | 47–53 |
- Differences reflect both training adaptations and genetic predisposition — these are difficult to disentangle in cross-sectional comparisons.
- Self-selection into sport is also a factor: individuals with naturally faster muscles may gravitate toward sprint events and vice versa.
Slide 19
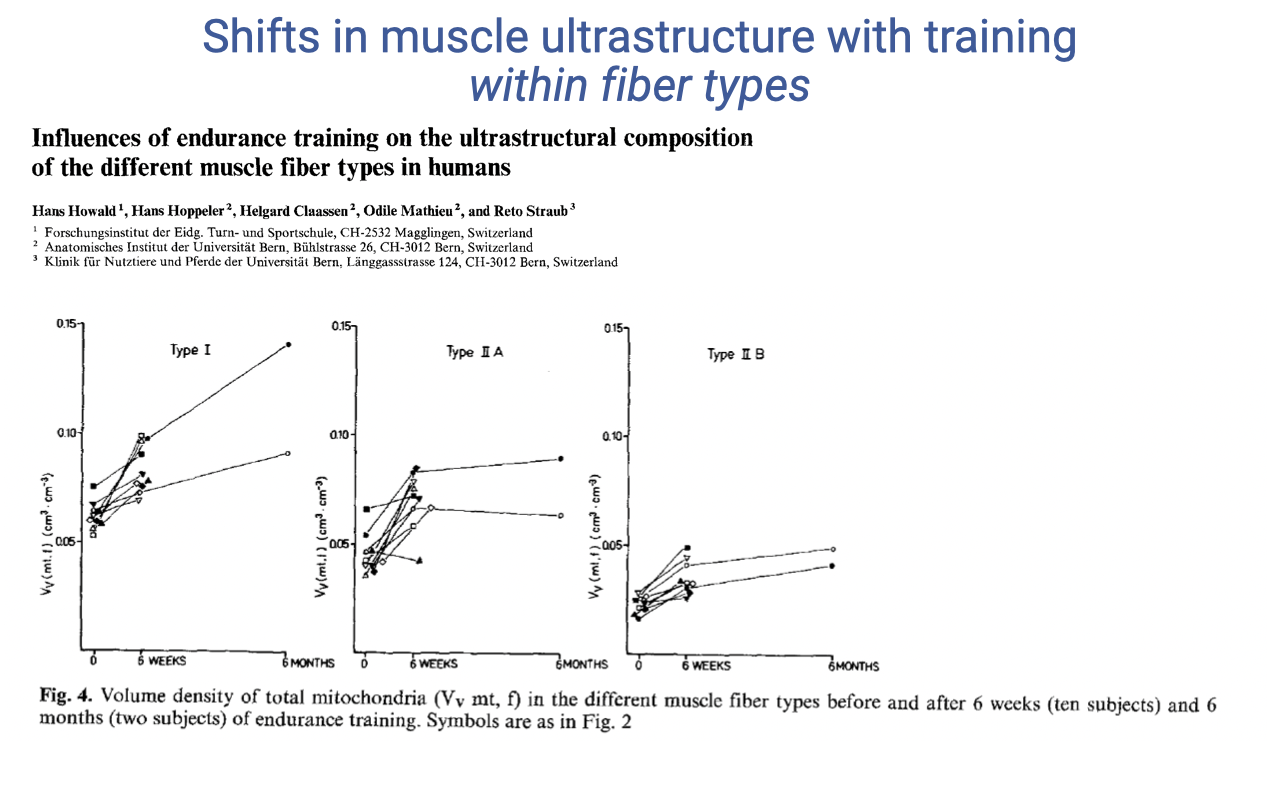
Endurance Training Increases Mitochondrial Volume in All Fiber Types
- Endurance training increases mitochondrial volume density in all three fiber types, not just slow fibers.
- Baseline differs: type I fibers start with higher mitochondrial density than IIA or IIB.
- Time course differs:
- Type IIB: rapid increase over 6 weeks, then plateau.
- Type I: continues to increase progressively through 6 months.
- Reinforces that fiber type is a continuum with substantial within-type plasticity — even “fast glycolytic” fibers acquire more mitochondria with endurance training.
Slide 20
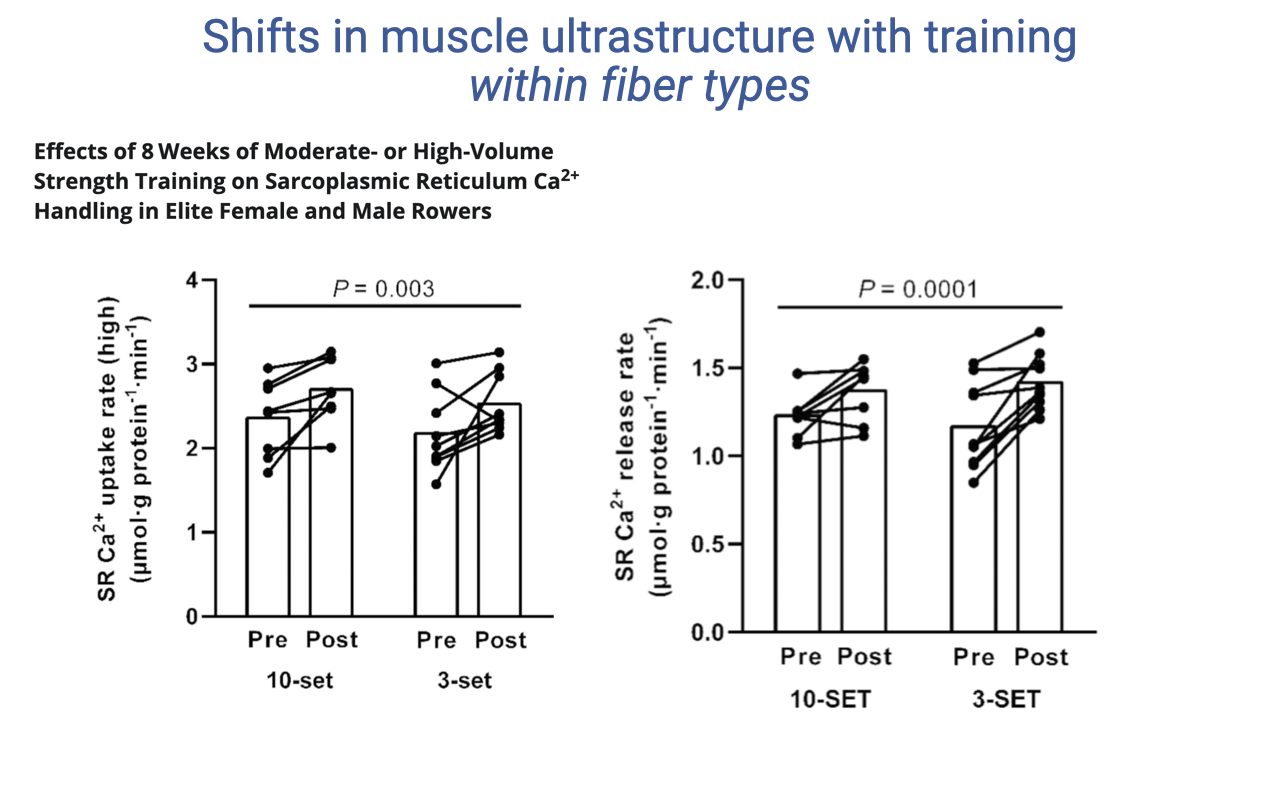
Strength Training Shifts SR Calcium Handling
- Eight weeks of strength training in elite rowers (under either 10-set or 3-set protocols) increased both:
- SR Ca2+ uptake rate (P = 0.003)
- SR Ca2+ release rate (P = 0.0001)
- Faster Ca2+ cycling enables faster contraction–relaxation — important when speed and force must be combined (as in rowing).
- Mechanistically, this likely reflects changes in SR amount and Ca2+-ATPase isoform expression, providing more rapid activation control.
Slide 21
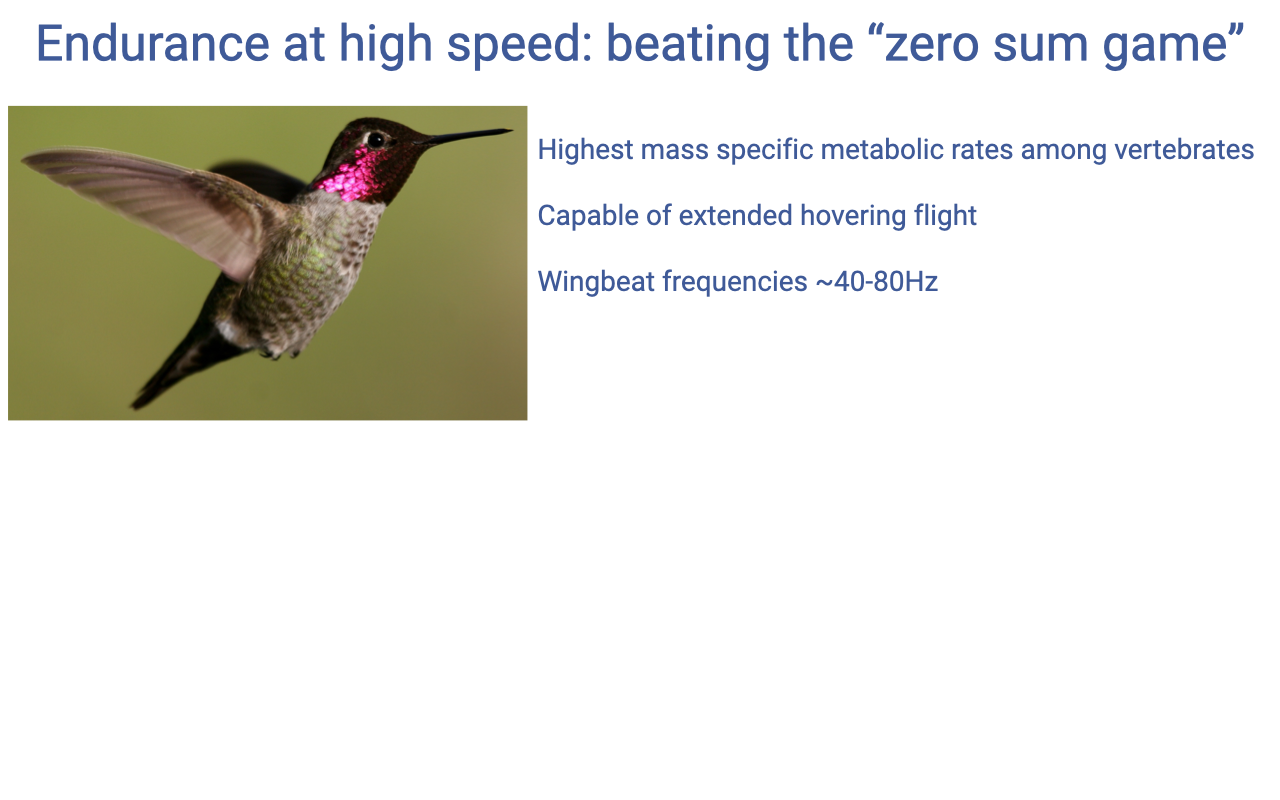
Hummingbirds — An Apparent Exception to the Zero-Sum Game
- Hummingbirds are physiological extremes:
- Highest mass-specific metabolic rates among vertebrates.
- Capable of sustained hovering flight (highly demanding aerobically and mechanically).
- Wingbeat frequencies of ~40–80 Hz — in the audible range when one is nearby.
- Their flight muscles seem to combine high force, high speed, and high endurance simultaneously — apparently challenging the zero-sum game framework.
Slide 22
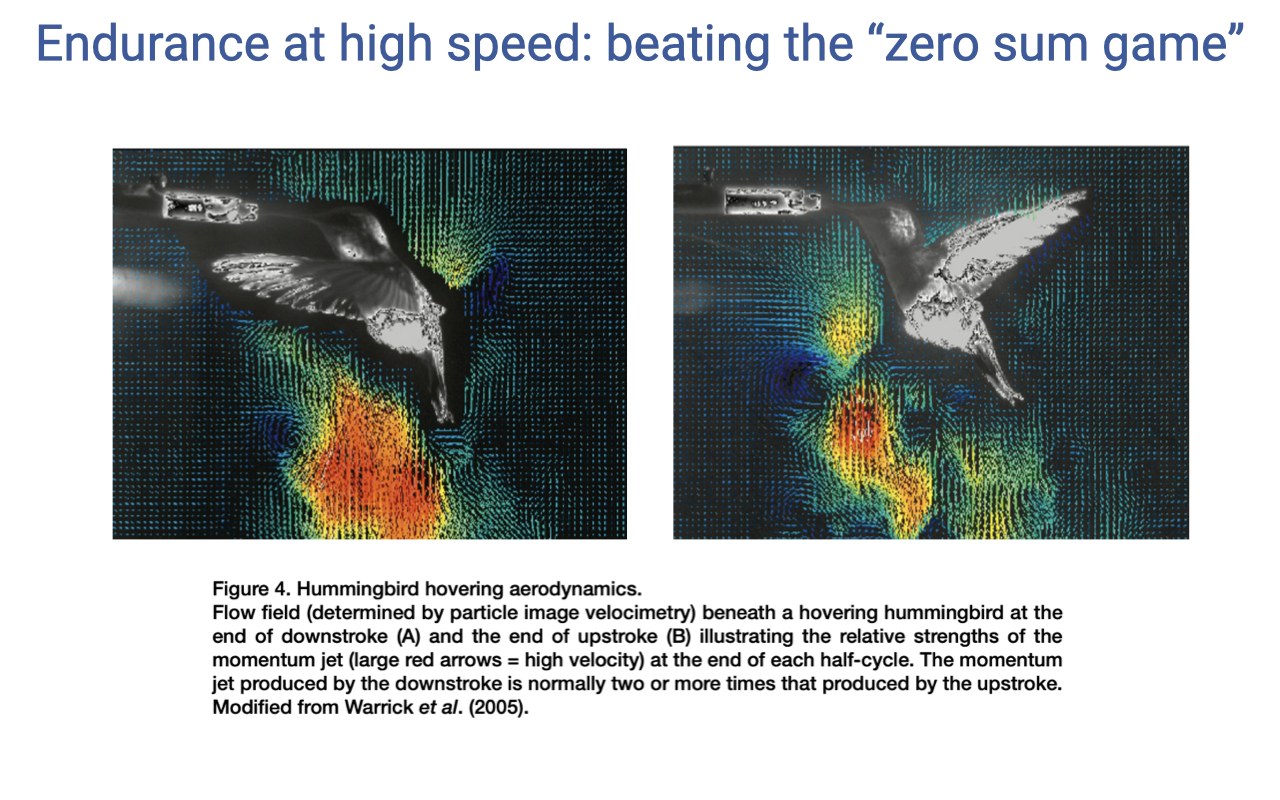
Hovering Aerodynamics Demand Lift on Both Strokes
- Particle-image-velocimetry (PIV) studies of hovering hummingbirds reveal downward momentum jets during both the downstroke and the upstroke.
- Most birds generate lift only on the downstroke; hummingbirds generate substantial lift on the upstroke as well, allowing true hovering.
- This places extreme power demands on both the downstroke and upstroke flight muscles.
Slide 23
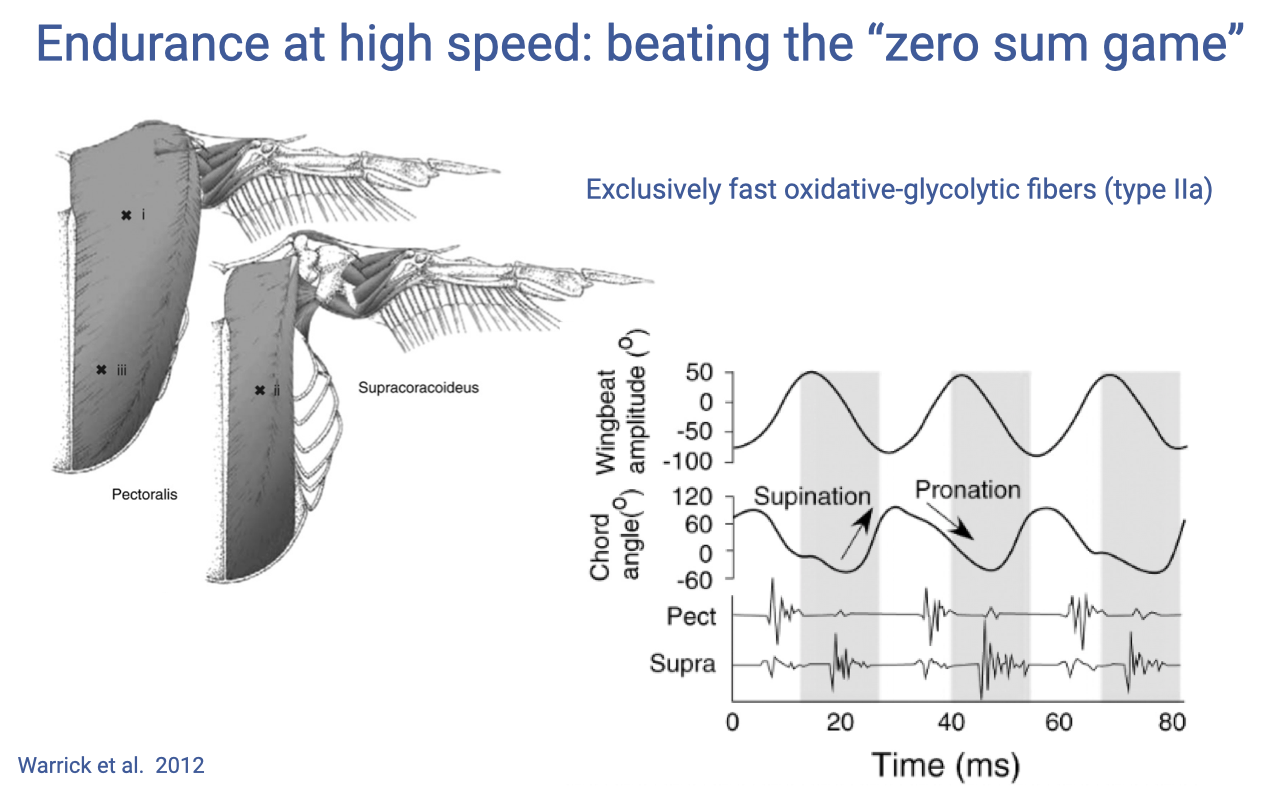
Hummingbird Flight Muscles Are A Single Specialized Type
- The pectoralis (downstroke) and supracoracoideus (upstroke) are large flight muscles that together comprise much of the hummingbird’s body mass.
- They are made up exclusively of fast oxidative–glycolytic fibers (type IIa) — unusual for vertebrate muscle, which is typically a mosaic of fiber types.
- EMG recordings show alternating, precisely timed activation of pectoralis and supracoracoideus across each wingbeat cycle (~80 ms shown).
Slide 24
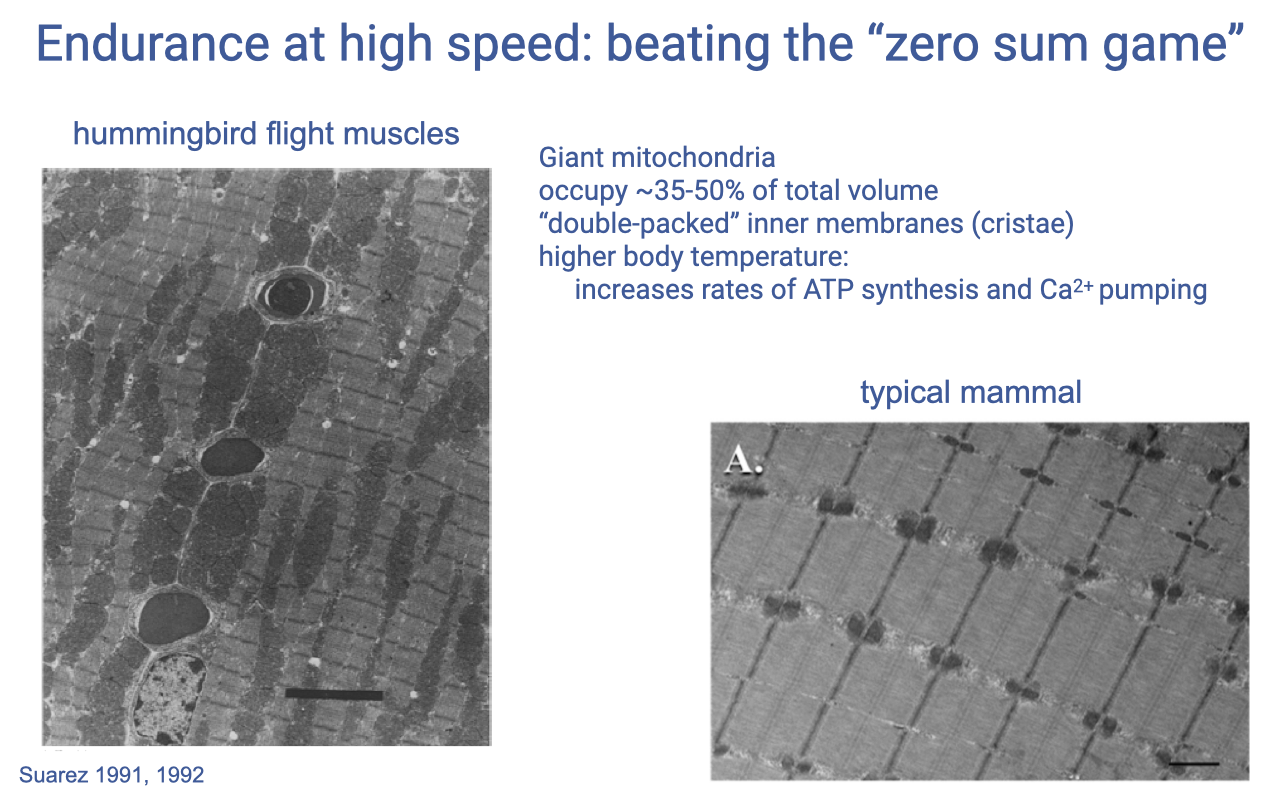
Hummingbird Mitochondria — Giant and Densely Packed
- Hummingbird flight-muscle mitochondria are giant and occupy ~35–50% of cell volume — far above typical vertebrate muscle (~5–25%).
- Mitochondria contain densely “double-packed” cristae, providing extra inner membrane surface area for oxidative phosphorylation.
- Hummingbirds also maintain higher body temperature than most vertebrates, which accelerates ATP synthesis and Ca2+-pump kinetics.
- These specializations expand the cellular envelope — hummingbirds shift the entire trade-off surface, rather than violating the zero-sum game.
Slide 25
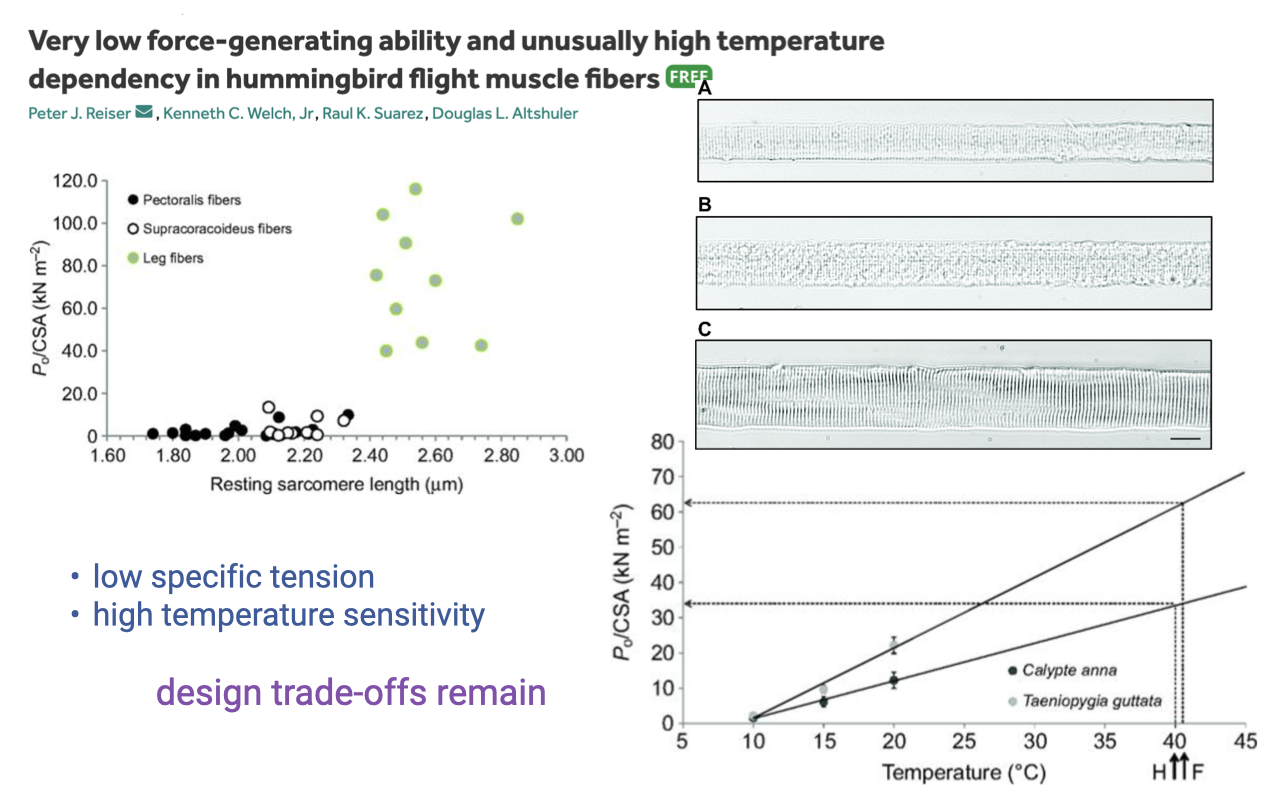
Trade-offs Persist: Low Force and High Temperature Sensitivity
- Hummingbird flight muscle has:
- Very low specific tension (force per cross-sectional area) — a direct consequence of mitochondria taking up so much cell volume that less is available for myofibrils.
- High temperature sensitivity — force falls steeply at lower temperatures.
- Functional consequences:
- Hummingbirds enter torpor in cold weather because their muscles lose function as temperature drops.
- The “broken zero-sum game” comes with its own trade-offs: extreme aerobic capacity at the cost of low force and a narrow operating temperature range.
Slide 26
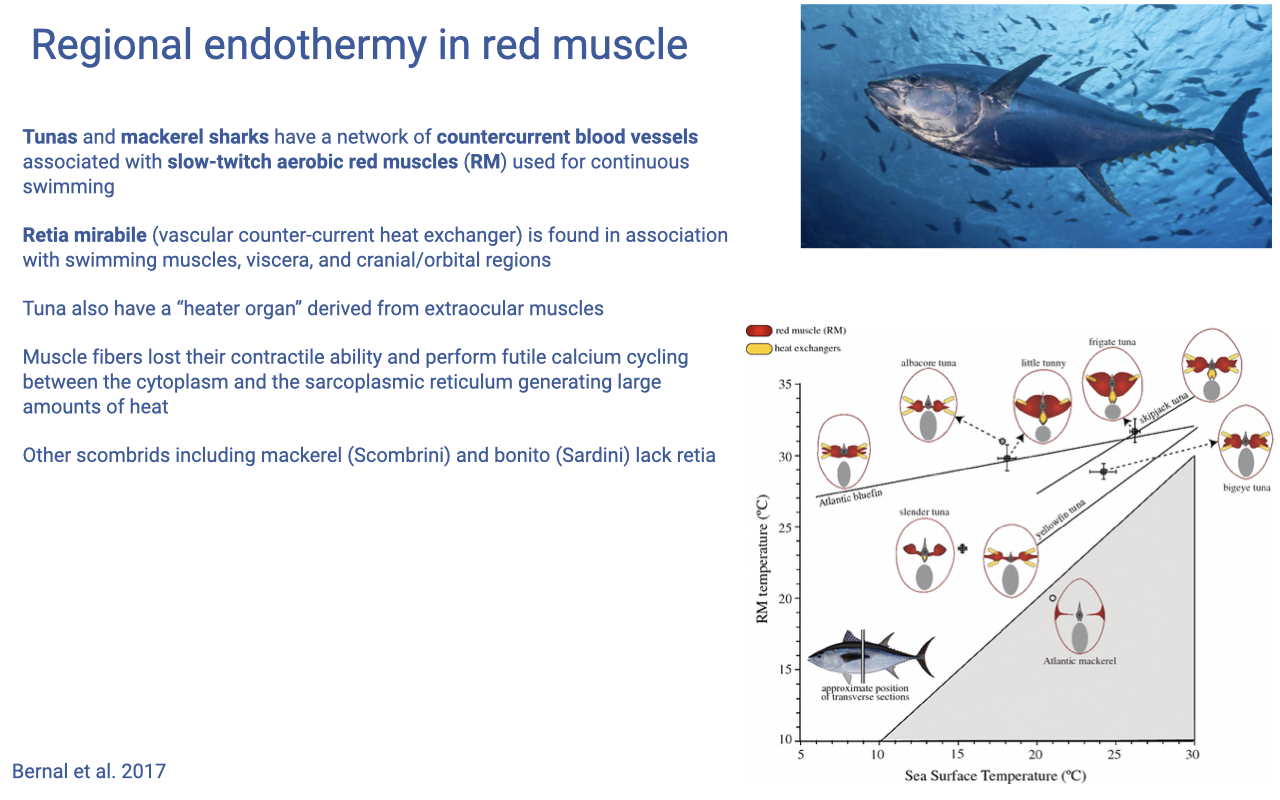
Regional Endothermy and Heater Organs
- Some fish — tunas and mackerel sharks — maintain elevated red-muscle temperature above ambient water using a vascular countercurrent heat exchanger (the rete mirabile).
- The rete is anatomically associated with the slow-twitch aerobic red muscle used for sustained swimming, with viscera, and (in some species) with cranial/orbital regions.
- Heater organs: in some tunas, extraocular muscles have lost their contractile function and instead perform futile Ca2+ cycling between cytoplasm and SR — generating large amounts of heat to warm the eye and brain.
- Demonstrates that muscle’s molecular machinery can be co-opted purely for thermogenesis, separating the calcium-cycling and force-generating functions.
Slide 27
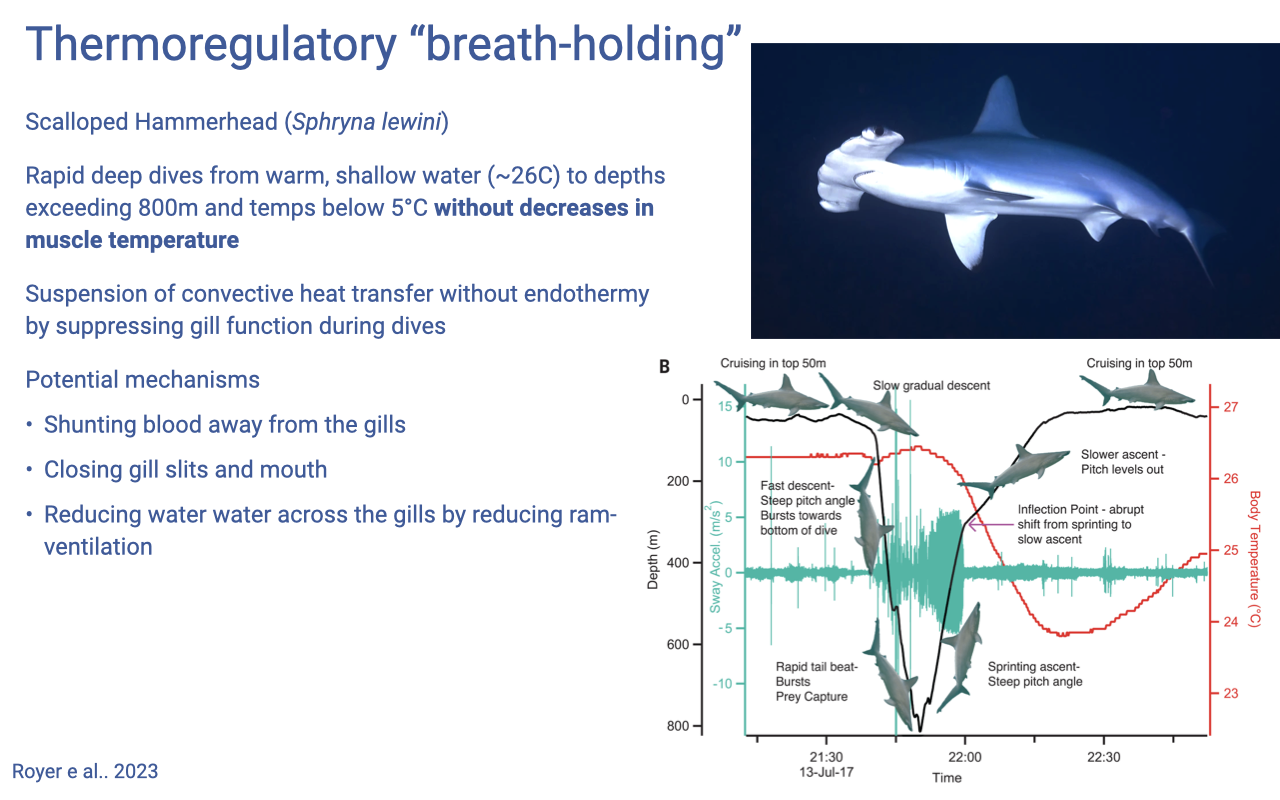
Thermoregulatory “Breath-Holding” in Hammerhead Sharks
- The scalloped hammerhead (Sphyrna lewini) makes rapid deep dives from ~26°C surface waters to depths >800 m at <5°C.
- It maintains muscle temperature during these excursions by suspending gill heat exchange (a kind of thermoregulatory “breath-holding”) rather than by endothermy.
- Proposed mechanisms:
- Shunting blood away from the gills.
- Closing gill slits and mouth.
- Reducing ram-ventilation to minimize convective heat loss across the gill epithelium.
- Reinforces the importance of maintaining muscle temperature for muscle function — these deep-diving predators must keep their muscle warm enough to function effectively at depth.
Slide 28
Learning Objectives — Recap
- Microstructure and functional components of muscle fibers — sarcolemma, sarcoplasm, SR, T-tubules, two mitochondrial populations, and the sarcomere as the contractile unit.
- Events of muscle contraction — the cross-bridge cycle (six steps), the role of ATP in releasing cross-bridges, and the relationship between cross-bridge cycling and force/displacement.
- Components essential for contractile function, activation control, and aerobic energy supply — myofibrils, SR + Ca2+-ATPase, and intermyofibrillar mitochondria, respectively.
- Functional trade-offs — the zero-sum game of volume fractions and the resulting fiber-type continuum from high-force/anaerobic to slow/aerobic to super-fast/low-force, plus extreme cases (hummingbirds, tunas) that expand or shift the trade-off surface.
Key Equations
Lecture 11 covers cellular structure, the cross-bridge cycle, calcium handling, and qualitative volume-fraction trade-offs — no formal equations are introduced. Quantitative relationships for muscle force, length, velocity, and power are formalized in Lecture 12.
Glossary of Key Terms
| Term | Definition |
|---|---|
| Myofiber (muscle fiber) | A single multi-nucleated skeletal muscle cell, specialized for force generation and movement. |
| Sarcolemma | The plasma membrane of a muscle cell; specialized for action potential propagation. |
| Sarcoplasm | The cytoplasm of a muscle cell; densely packed with myofibrils, mitochondria, and SR. |
| Sarcoplasmic reticulum (SR) | A specialized intracellular network of tubules that stores Ca2+ and contains Ca2+-ATPase pumps; functionally analogous to the endoplasmic reticulum. |
| T-tubule | An invagination of the sarcolemma that conducts the action potential into the cell interior, contacting the SR at the triad. |
| Triad | The structural unit formed by one T-tubule and two flanking SR terminal cisternae; the site of excitation–contraction coupling. |
| Intermyofibrillar mitochondria | Mitochondria distributed in arrays between myofibrils; supply ATP for cross-bridge cycling. |
| Subsarcolemmal mitochondria | Mitochondria packed beneath the sarcolemma; supply ATP for SR Ca2+-ATPase activity. |
| Myofibril | A long, cylindrical chain of sarcomeres within a muscle fiber; many myofibrils together fill most of the fiber volume. |
| Sarcomere | The functional contractile unit of striated muscle, defined between two Z-discs; contains overlapping actin and myosin filaments. |
| Z-disc (Z-line) | The structural boundary of a sarcomere; anchors actin (thin) filaments. |
| Actin (thin filament) | The thin contractile filament; provides binding sites for myosin heads. Binding sites are blocked by tropomyosin in the absence of Ca2+. |
| Myosin (thick filament) | The thick contractile filament; its globular heads form cross-bridges with actin and undergo the power stroke. |
| Titin | A giant elastic structural protein that maintains sarcomere alignment and contributes to passive tension. |
| Troponin | A regulatory protein bound to actin/tropomyosin; binds Ca2+ and exposes actin binding sites for cross-bridge formation. |
| Cross-bridge cycle | The six-step molecular cycle of myosin head attachment, power stroke, ADP release, ATP binding, and hydrolysis-driven re-cocking that produces sarcomere shortening. |
| Power stroke | The conformational change in the myosin head, triggered by Pi release, that ratchets the actin filament past myosin. |
| Rigor | The state in which actin and myosin remain tightly bound because no ATP is available to release them; underlies rigor mortis. |
| Sliding filament model | The model that explains sarcomere shortening as the result of cross-bridge cycling sliding actin past myosin without changes in filament length. |
| Excitation–contraction coupling | The sequence linking sarcolemmal action potentials to Ca2+ release from the SR and, ultimately, cross-bridge activation. |
| SR Ca2+-ATPase (SERCA) | The pump that re-sequesters Ca2+ into the SR after activation; a major ATP consumer (~30–40% of isometric ATP cost). |
| Twitch | The brief mechanical response to a single action potential; its time course depends on Ca2+ release/uptake and cross-bridge kinetics. |
| Superfast (sonic) muscle | Highly specialized muscle (e.g., toadfish swim bladder, rattlesnake tail-shaker) capable of contraction rates >100 Hz; high SR fraction with rapid Ca2+ handling. |
| Zero-sum game | The principle that a fixed muscle-cell volume must be partitioned among myofibrils, SR, and mitochondria, so increases in one come at the expense of the others (Rome & Lindstedt 1998). |
| Type I fiber (slow oxidative) | Slow, fatigue-resistant fiber type with high mitochondrial density, low ATPase activity, and high efficiency. |
| Type IIa fiber (fast oxidative–glycolytic) | Fast fiber type with high mitochondrial density and intermediate fatigue resistance. |
| Type IIx fiber (fast glycolytic) | Fast fiber type with low mitochondrial density, high ATPase activity, high specific tension, and rapid fatigue. |
| Specific tension | Force generated per unit cross-sectional area of a muscle fiber; reflects myofibrillar volume fraction and isoform composition. |
| Vmax (maximum shortening velocity) | The maximum unloaded velocity at which a muscle fiber can shorten; primarily determined by myosin isoform. |
| Cross-reinnervation | Experimental swap of nerves between fast and slow muscles, demonstrating that fiber type can shift in response to the pattern of neural activation. |
| Mitochondrial volume density | The fraction of muscle cell volume occupied by mitochondria; increases with endurance training in all fiber types. |
| Hovering flight | Sustained flight in place; aerodynamically requires lift on both upstroke and downstroke and is among the most metabolically demanding forms of locomotion. |
| Pectoralis | The downstroke flight muscle in birds; in hummingbirds, composed exclusively of type IIa fibers and packed with giant mitochondria. |
| Supracoracoideus | The upstroke flight muscle in birds; functions via a tendon that loops over the shoulder. |
| Regional endothermy | The maintenance of elevated temperature in selected tissues (e.g., red swimming muscle, brain) by use of vascular countercurrent heat exchangers. |
| Rete mirabile | A vascular countercurrent heat exchanger that traps metabolic heat in tissues such as red swimming muscle in tunas and mackerel sharks. |
| Heater organ | A muscle (e.g., extraocular in some tunas) that has lost contractile function and dedicates its calcium cycling machinery to thermogenesis via futile Ca2+ cycling. |
| Torpor | A state of greatly reduced metabolic rate and body temperature; used by hummingbirds when ambient temperatures fall too low for muscle function. |