Slide 1
- Friday review and discussion session for Week 4.
- Consolidates the high-altitude and diving case studies from Lectures 9–10 into the unified oxygen supply cascade framework.
- Combines a Q&A on the background reading, a comparative-physiology think-pair-share activity, and a quantitative problem applying $C_aO_2 = 1.39 \cdot [Hb] \cdot s_{O_2} + 0.03 \cdot P_aO_2$ to a diving Weddell seal.
Slide 2
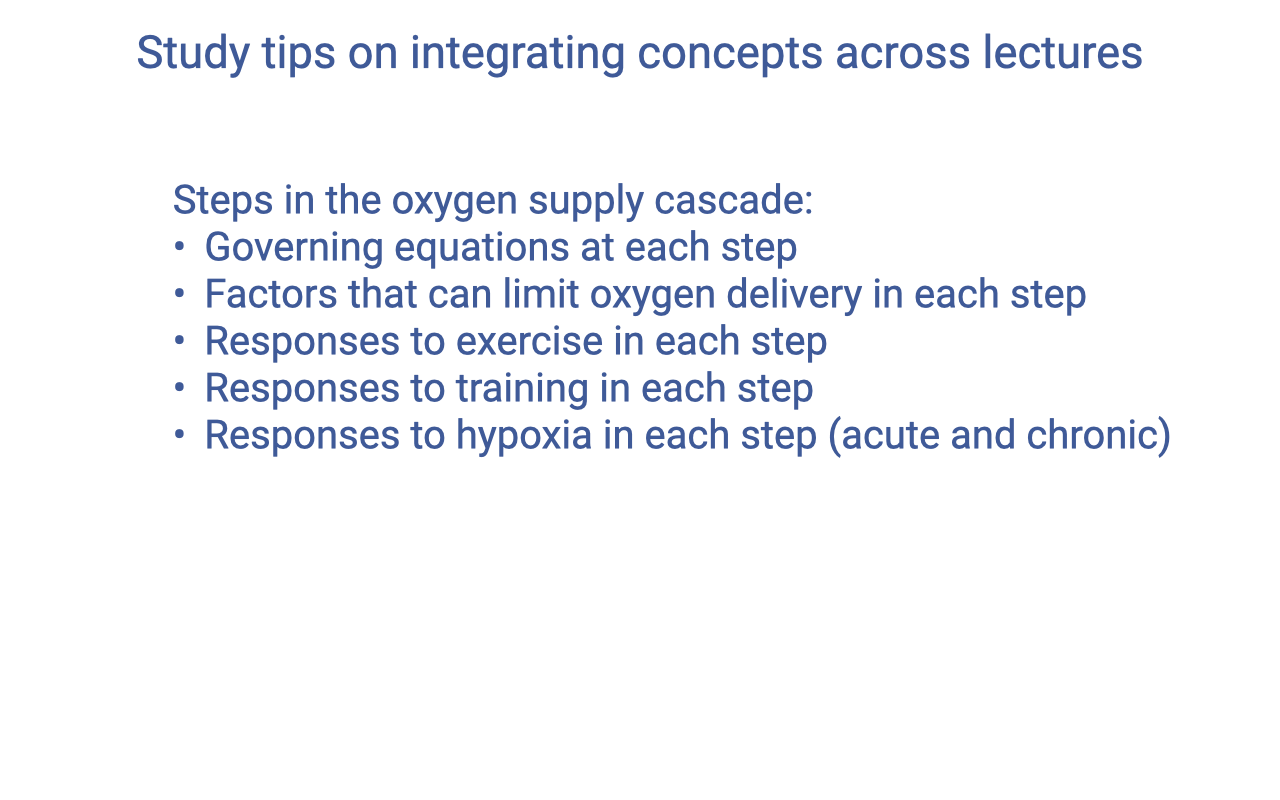
Study Tip — Build a Cascade-by-Step Matrix
- The oxygen supply cascade provides the integrative scaffold for the entire course. Across lectures, the same five steps recur, but viewed through different lenses.
- A useful study habit is to build a matrix where rows are the five cascade steps and columns are:
- Governing equations at each step
- Factors that limit O2 delivery at each step
- Responses to exercise at each step
- Responses to training at each step
- Responses to hypoxia at each step (acute and chronic)
- Filling in each cell forces the integration of material from multiple lectures and exposes gaps. For example, the Week 4 high-altitude and diving case studies populate the chronic and acute hypoxia columns, while Weeks 2–3 populate the exercise and training columns.
Slide 3
![Slide titled "Identify the governing equations & limiting factors in the O₂ supply cascade." A miniature cascade schematic on the left shows the four interfaces (pulmonary ventilation, alveolar gas exchange, blood gas transport, systemic gas exchange) with O₂ flowing from environment to cell. On the right is a numbered breakdown of each step with governing equations and limiting factors. (1) Pulmonary ventilation: governed by gas laws and Fick's principle; limited by O₂ content in air and alveolar ventilation. (2) Alveolar gas exchange: governed by Fick's law of diffusion; limited by V/Q matching (physiological deadspace, shunt), O₂ diffusion rate in the lungs (blood-gas barrier), and partial pressure gradient between alveoli and pulmonary capillaries. (3) Blood gas transport: governed by Fick's principle; limited by cardiac output, O₂-carrying capacity of the blood (which relates to [RBC]/[Hb]), and the partial pressure gradient between systemic and venous capillaries. (4) Systemic gas exchange: governed by Fick's law of diffusion; limited by O₂ flow rate, myoglobin concentration, and O₂ diffusion capacity in tissues. A reference URL https://madaley.github.io/E183_ExercisePhysiology/ ("Reference resources" at the bottom) is shown.](/E183_ExercisePhysiology/week04/images/friday-review/slide-003.png)
Governing Equations and Limiting Factors — Cascade Audit
- A worked example of the matrix from Slide 2: filling out the governing equations and limiting factors columns for each cascade step.
| Step |
Governing equations |
Limiting factors |
| 1. Pulmonary ventilation |
Gas laws (Dalton, ideal gas); ventilatory Fick: $\dot{V}O_2 = \dot{V}_A B_{gas}(P_IO_2 - P_EO_2)$ |
$F_IO_2$, barometric pressure ($P_B$), alveolar ventilation rate $\dot{V}_A$ |
| 2. Alveolar gas exchange |
Fick’s law of diffusion (across the blood-gas barrier); alveolar gas equation |
V/Q matching (dead space, shunt), thickness/area of blood-gas barrier, $P_AO_2 - P_aO_2$ gradient |
| 3. Blood gas transport |
Circulatory Fick: $\dot{V}O_2 = \dot{Q}(C_aO_2 - C_{\bar{v}}O_2)$; $C_aO_2 = 1.39 \cdot [Hb] \cdot s_{O_2} + 0.03 \cdot P_aO_2$ |
Cardiac output $\dot{Q}$, [RBC]/[Hb] (O2-carrying capacity), $P_aO_2 - P_{\bar{v}}O_2$ gradient |
| 4. Systemic gas exchange |
Fick’s law of diffusion (capillary → mitochondrion) |
Capillary blood flow, [Mb], capillary-to-mitochondrion diffusion distance, mitochondrial $P_{O_2}$ sink |
- Reference resources for filling in this matrix are linked on the course site: https://madaley.github.io/E183_ExercisePhysiology/.
- The Week 4 hypoxia case studies repeatedly demonstrate that no single step is rate-limiting in isolation: high-altitude natives modify multiple steps in parallel, and diving mammals shift the balance toward storage (Step 3 [Hb]; Step 4 [Mb]) when Step 1 is unavailable.
Slide 4
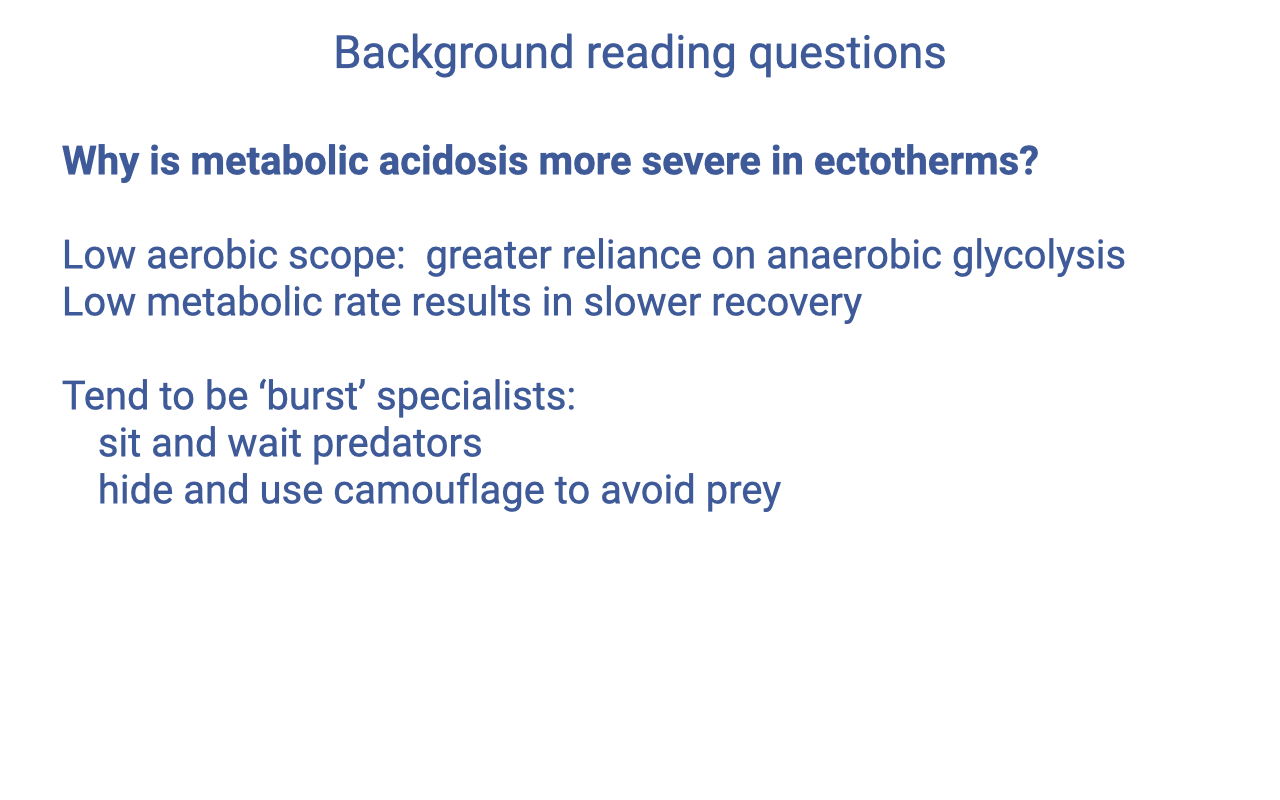
- Question (background reading): Why is metabolic acidosis more severe in ectotherms than in endotherms?
- Lower aerobic scope (max VO2 ÷ resting VO2) means an ectotherm exercising at high intensity quickly outruns its aerobic ATP supply and relies more heavily on anaerobic glycolysis, generating large amounts of lactate and protons.
- Lower resting metabolic rate also slows the recovery rate — clearance of lactate, replenishment of ATP/PCr, and re-establishment of normal pH all proceed more slowly than in endotherms.
- Behavioral correlate: ectotherms tend to be “burst” specialists — sit-and-wait predators or camouflaged prey — because high-intensity locomotion can be sustained only briefly before metabolic acidosis forces a long recovery.
Slide 5
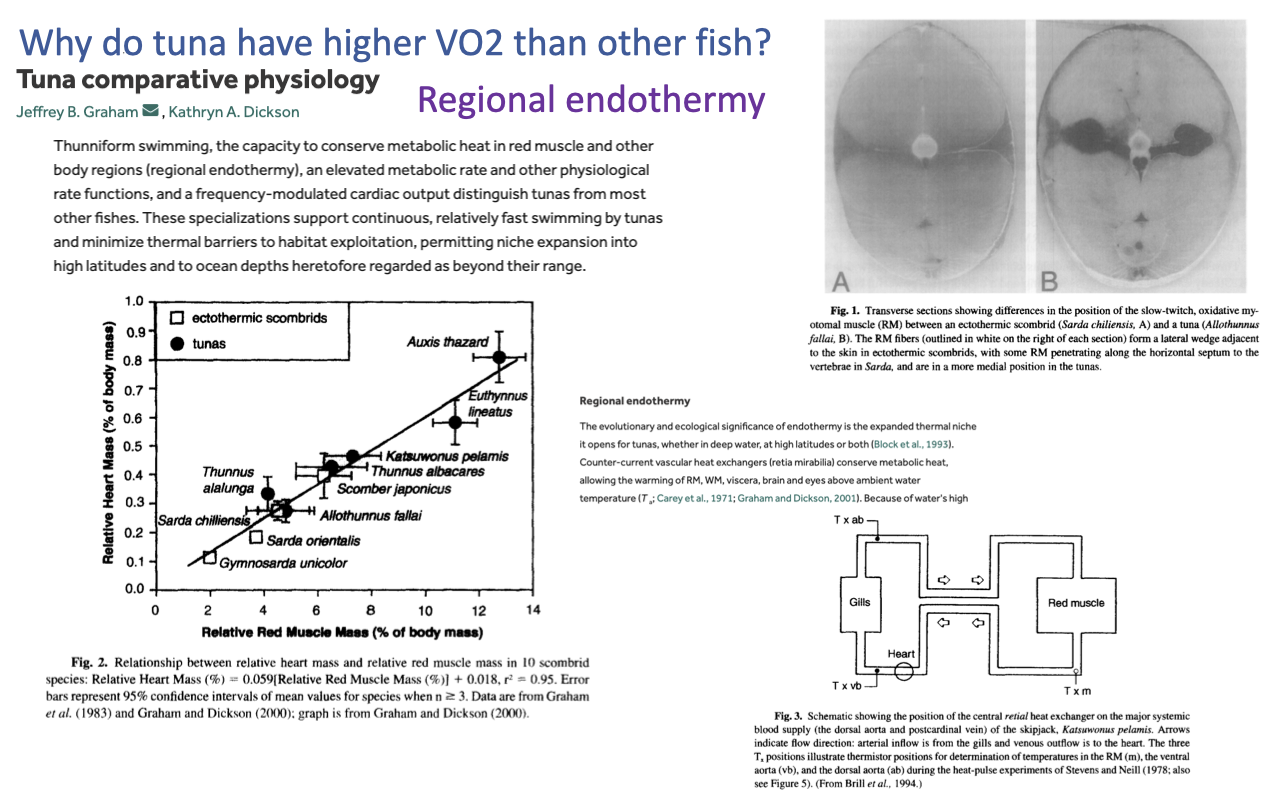
Regional Endothermy in Tunas
- Question (background reading): Why do tunas (and lamnid sharks) have higher $\dot{V}O_2$ than typical fish?
- Regional endothermy — tunas use vascular countercurrent heat exchangers (retia mirabilia) to retain metabolic heat in red muscle, viscera, and brain/eye, raising local tissue temperature well above ambient seawater.
- Higher tissue temperature increases:
- Mitochondrial enzyme rates and aerobic ATP supply
- Muscle contractile rate (faster cross-bridge cycling)
- Neural processing speed in warmed retinal/brain tissue (visual acuity)
- Comparative anatomy: tunas have larger relative heart masses than typical ectothermic fish — heart mass scales between the ectothermic-fish line and the endothermic mammal/bird line.
- This is a convergent solution with mammals and birds: a higher aerobic scope is enabled by higher tissue temperatures, even though the rest of the body remains close to ambient.
Slide 6
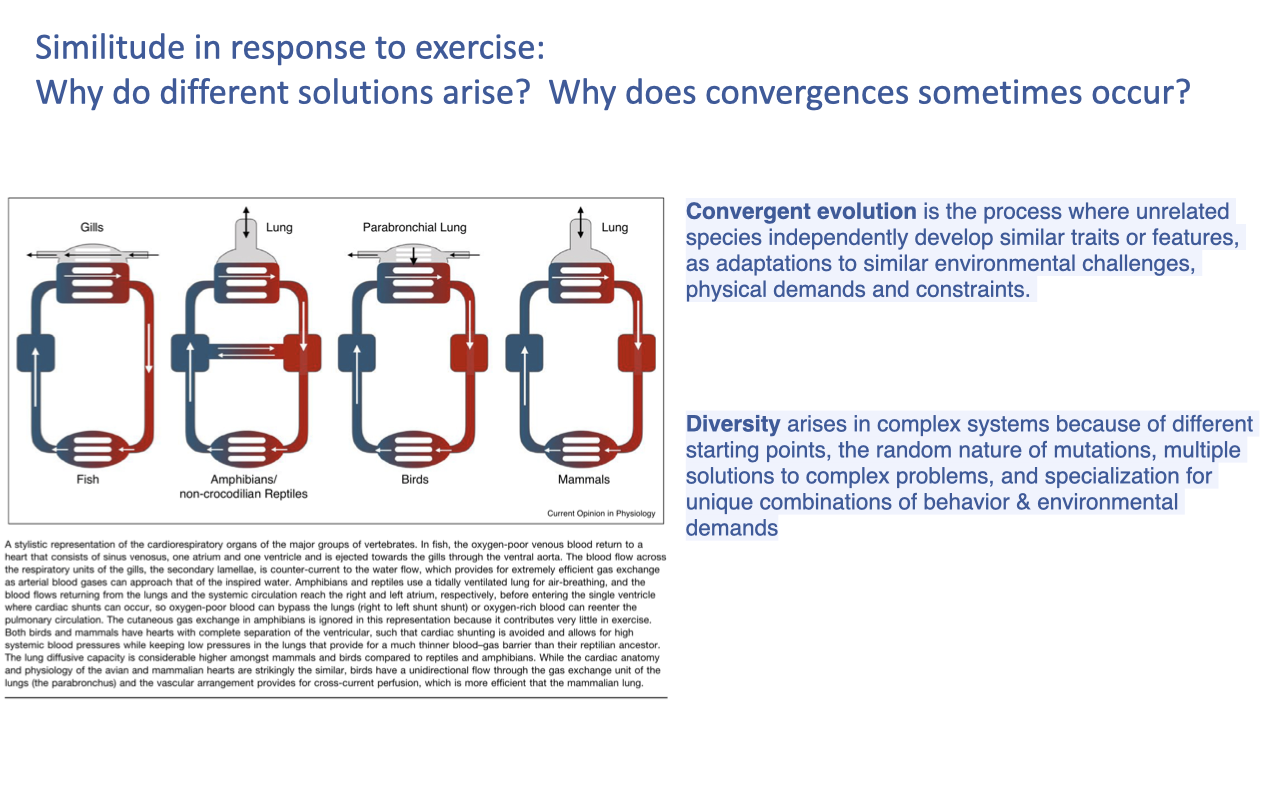
Convergence and Diversity in Comparative Physiology
- Convergent evolution — unrelated species independently arrive at similar physiological solutions when facing similar environmental challenges (e.g., similar physical demands or similar constraints).
- Examples from Week 4:
- High-charge myoglobin evolved independently in cetaceans and pinnipeds (Slide 29 of Lecture 10).
- Enlarged spleens as on-demand RBC reservoirs evolved in Weddell seals and (on a smaller scale) in Bajau human divers via PDE10A.
- Regional endothermy evolved independently in tunas and lamnid sharks.
- Diversity arises in complex physiological systems because:
- Lineages start from different ancestral states (e.g., fish single-circuit vs. mammalian double-circuit cardiopulmonary anatomy).
- Mutations are random, so different founder populations sample different genetic variation.
- The cascade has many tunable steps, so multiple combinations of changes can solve the same problem.
- Each species also faces a unique combination of environmental and behavioral demands, favoring different specializations.
- Connection to Week 4: Tibetans vs. Andeans illustrate diversity within a convergence — both populations are adapted to high altitude (convergence), but they reached different solutions (high ventilation/cardiac output vs. high [Hb]/saturation) because of different starting genetic variation and the trade-off between [Hb] and viscosity.
Slide 7
![Slide titled "Graphical solution to the Fick principle for oxygen uptake" featuring a panel from Wang et al. 2019 Current Opinion in Physiology. The graph plots blood oxygen concentration on the y-axis vs. PO2 on the x-axis (left half) joined to cardiac output Q on the x-axis (right half). The S-shaped O2-hemoglobin dissociation curve is drawn on the left half. A blue dot on the steep portion of the curve marks venous blood [O2]v at low PO2; a second blue dot marks arterial blood [O2]a at intermediate PO2 during basal metabolic rate (BMR); and a red dot at the top of the curve marks the higher arterial [O2]a achieved during exercise. Dashed horizontal lines project the a–v difference into the right half of the graph as the height of two stacked rectangles: a small grey "BMR" rectangle on the left and a larger "Exercise" rectangle to its right. The width of each rectangle on the cardiac output axis represents Q. The equation $\dot{V}O_2 = \dot{Q}([O_2]_a - [O_2]_v)$ is shown inside the Exercise rectangle, indicating that VO2 = area of the rectangle. Silhouettes of a galloping horse and a flying eagle are shown on the right of the slide as endotherm exemplars. Citation: Wang et al. 2019.](/E183_ExercisePhysiology/week04/images/friday-review/slide-007.png)
Graphical Fick Principle — Endotherm Case (Mammal/Bird)
- $\dot{V}O_2$ in the Fick principle is the product of cardiac output ($\dot{Q}$) and the a–v O2 difference ($C_aO_2 - C_{\bar{v}}O_2$):
\[\dot{V}O_2 = \dot{Q}(C_aO_2 - C_{\bar{v}}O_2)\]
- This can be visualized as the area of a rectangle:
- Height = a–v O2 difference (read off the O2-hemoglobin curve as the vertical distance between arterial and venous saturation points)
- Width = cardiac output $\dot{Q}$
- From rest (BMR) to exercise, an endotherm raises $\dot{V}O_2$ by simultaneously:
- Widening the a–v difference (venous point shifts down the steep portion of the curve as tissues extract more O2; arterial point moves to the top plateau).
- Increasing $\dot{Q}$ (heart rate × stroke volume).
- Endotherms (horse, eagle) achieve very large rectangles → very high $\dot{V}O_2$max because they can both raise [Hb] saturation to ~100% in the lung and sustain very high $\dot{Q}$.
Slide 8
![Slide titled "Graphical solution to the Fick principle for oxygen uptake" with the same Wang et al. 2019 framework now showing an ectotherm pattern. The O2-hemoglobin curve is drawn on the left half. A blue dot on the lower steep portion marks venous [O2]v, and a second blue dot marks an intermediate arterial [O2]a achieved with a right-to-left (R-L) cardiac shunt that mixes deoxygenated blood with the oxygenated arterial flow. A purple dot above marks a slightly higher arterial [O2]a value when the R-L shunt is reduced (labeled "R-L shunt reduced"). A red dot at the top of the curve marks the highest arterial [O2]a possible without any shunt. Curved arrows indicate transitions between the points along the curve. Dashed lines project these into the right half of the graph as the height of stacked SMR (standard metabolic rate, small grey rectangle) and Exercise (larger box) rectangles, with the Exercise rectangle smaller than the endotherm equivalent on Slide 7. The equation $\dot{V}O_2 = \dot{Q}([O_2]_a - [O_2]_v)$ is again displayed. Silhouettes of a frog and a crocodile/alligator are shown on the right as ectotherm exemplars. Citation: Wang et al. 2019.](/E183_ExercisePhysiology/week04/images/friday-review/slide-008.png)
Graphical Fick Principle — Ectotherm Case (Amphibian / Reptile)
- For an ectotherm with a right-to-left (R-L) cardiac shunt (incomplete ventricular separation in many amphibians and non-crocodilian reptiles):
- At rest (SMR), a fraction of systemic venous blood bypasses the lungs and mixes back into the systemic arterial flow, lowering arterial [O2] below what would be achievable from pulmonary gas exchange alone.
- During exercise, the R-L shunt is reduced — the heart preferentially routes blood through the pulmonary circuit — so arterial [O2] rises toward the top of the curve.
- Compared with the endotherm rectangle (Slide 7), the ectotherm rectangle is:
- Shorter (a–v difference is constrained by the persistent shunt and lower [Hb] capacity)
- Narrower (lower $\dot{Q}$ at any given temperature)
- Resulting lower aerobic scope is the mechanistic reason ectotherms (Slide 4) rely more on anaerobic glycolysis during burst activity and recover more slowly.
- The R-L shunt is itself an adaptive feature, not a defect — it allows flexible partitioning of blood flow between the lungs and the body during diving, brumation, and breath-holding (notably in turtles, varanids, crocodilians).
Slide 9
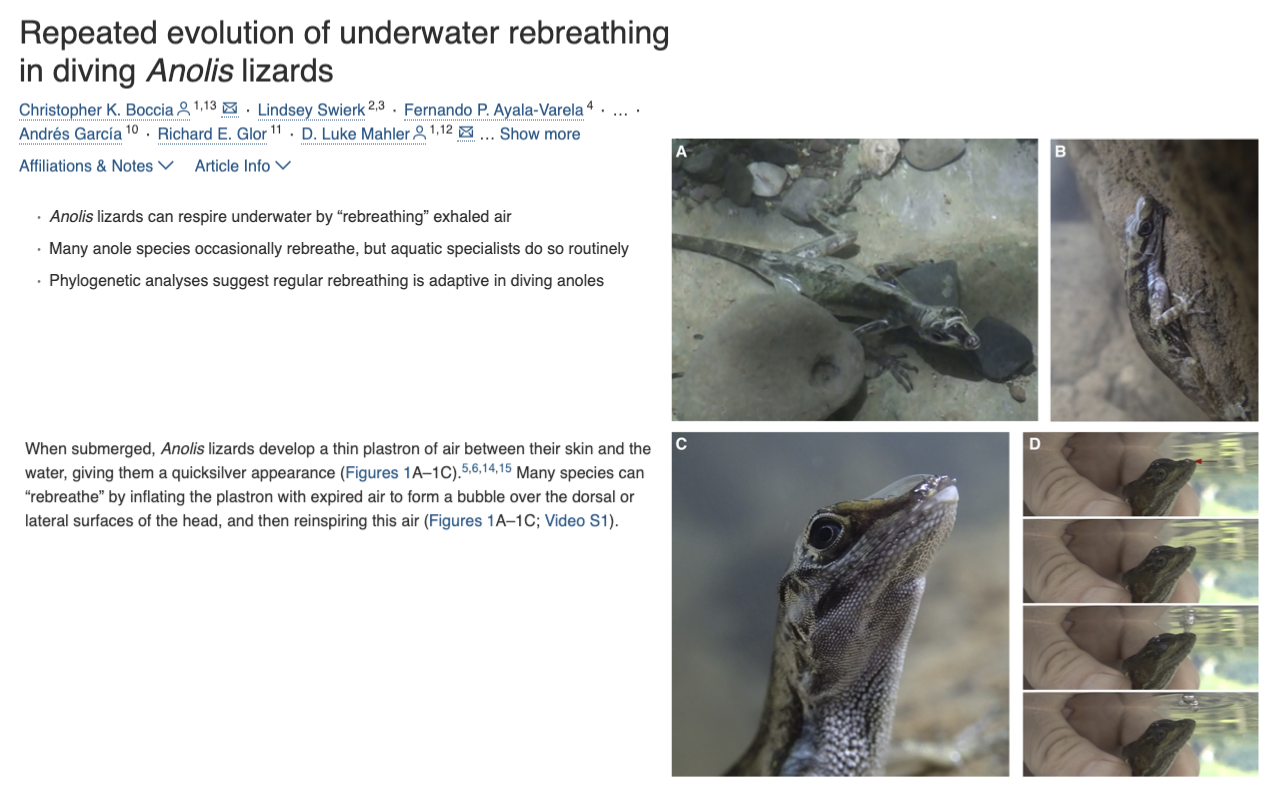
Convergent Underwater Rebreathing in Anolis Lizards
- An additional convergence example tying back to Slide 6: multiple Anolis lizard species have independently evolved underwater rebreathing.
- When submerged, the lizard’s hydrophobic skin traps a thin plastron of air against its head/snout. The animal exhales into this bubble and re-inhales the same air, extending the apparent breath-hold by allowing additional gas exchange between the bubble and the surrounding water (a small auxiliary “lung” outside the body).
- Phylogenetic analyses suggest the ability is adaptive in semi-aquatic anoles (those that habitually dive to escape predators) — the trait has arisen independently several times.
- This is a fresh, recent (2021) example of convergence at the behavior + integument interface — a different cascade level from the molecular convergence (myoglobin charge) and organ-level convergence (spleen size) discussed in Lecture 10, demonstrating that convergence can occur at any scale.
Slide 10
![Slide titled "Problem solving activity" with prompt: "Calculate the arterial O₂ content of the blood for a Weddell seal in each condition below based on the measurements shown. Then calculate the 'measured end dive' and 'hypothetical' as a percentage relative to the start of the dive." The equation $C_aO_2 = 1.39[Hb]sO_2 + P_aO_2 \cdot 0.03$ is shown. A three-column table provides input values for three scenarios. Column 1 "Measured: Start dive": [Hb] = 150, PaO₂ = 140, %Saturation = 100. Column 2 "Measured: end dive": [Hb] = 260, PaO₂ = 25, %Saturation = 45. Column 3 "Hypothetical: No RBC increase": [Hb] = 150, PaO₂ = 25, %Saturation = 45.](/E183_ExercisePhysiology/week04/images/friday-review/slide-010.png)
Practice Problem — Arterial O2 Content in a Diving Weddell Seal
- Setup: Apply the arterial O2 content equation to three scenarios for a Weddell seal:
\[C_aO_2 = 1.39 \cdot [Hb] \cdot s_{O_2} + 0.03 \cdot P_aO_2\]
- The three scenarios test the functional importance of splenic RBC release:
| Scenario |
[Hb] |
$P_aO_2$ (mmHg) |
sO₂ (%) |
| (1) Start of dive (measured) |
150 |
140 |
100 |
| (2) End of dive (measured, after splenic RBC injection) |
260 |
25 |
45 |
| (3) Hypothetical end of dive without splenic RBC increase |
150 |
25 |
45 |
- Note the units: [Hb] here is in g/L (rather than the more common g/dL), so the resulting $C_aO_2$ comes out in mL O2 per L of blood rather than mL O2/dL.
- Tasks:
- Compute $C_aO_2$ for each scenario.
- Express scenarios (2) and (3) as a percentage of the start-of-dive value to quantify how much the splenic RBC reservoir defends arterial O2 content during the dive.
Slide 11
![Slide titled "Problem solving activity" showing the worked solution to the Weddell seal CaO₂ problem from the previous slide. Same equation $C_aO_2 = 1.39[Hb]sO_2 + P_aO_2 \cdot 0.03$ and same three-column input table (Start dive: [Hb] 150, PaO₂ 140, sO₂ 100; End dive measured: [Hb] 260, PaO₂ 25, sO₂ 45; Hypothetical no RBC increase: [Hb] 150, PaO₂ 25, sO₂ 45). Below the table, computed totals for arterial O₂ content are: 213 (start dive), 163 (end dive measured) which is 77% of normal, and 95 (hypothetical no RBC increase) which is 45% of normal.](/E183_ExercisePhysiology/week04/images/friday-review/slide-011.png)
Solution and Interpretation
- Apply $C_aO_2 = 1.39 \cdot [Hb] \cdot s_{O_2} + 0.03 \cdot P_aO_2$ to each column (with $s_{O_2}$ entered as a fraction):
| Scenario |
$1.39 \cdot [Hb] \cdot s_{O_2}$ |
$0.03 \cdot P_aO_2$ |
$C_aO_2$ |
% of start |
| Start of dive |
$1.39 \times 150 \times 1.00 = 208.5$ |
$0.03 \times 140 = 4.2$ |
≈ 213 |
100% |
| End of dive (measured) |
$1.39 \times 260 \times 0.45 \approx 162.6$ |
$0.03 \times 25 = 0.75$ |
≈ 163 |
77% |
| End of dive (hypothetical, no splenic RBC release) |
$1.39 \times 150 \times 0.45 \approx 93.8$ |
$0.03 \times 25 = 0.75$ |
≈ 95 |
45% |
- Take-home interpretation:
- Without splenic RBC release, $C_aO_2$ would fall to ~45% of starting value by the end of a long dive — a steep drop driven by the collapse in $P_aO_2$ and saturation.
- With splenic RBC release, [Hb] rises from 150 to 260 g/L and defends $C_aO_2$ at ~77% of starting value despite the same drop in $P_aO_2$ and saturation.
- The splenic O2 reservoir is therefore a dominant lever in the diving-mammal cascade: it mostly compensates for the unavoidable fall in $s_{O_2}$ during a prolonged dive.
- This is a quantitative version of the qualitative finding in Lecture 10 (Slides 22–24): vasoconstriction-driven splenic contraction is what allows Weddell seals to tolerate severe arterial hypoxemia while maintaining O2 delivery to brain and heart.
- Compare with high-altitude story: at altitude, lowlander acclimatization also relies on raising [Hb] (via EPO/erythropoiesis) — but on a timescale of weeks, not the seconds over which a seal’s spleen contracts. The same lever, on very different timescales.
Key Equations
| Equation |
Name |
Description |
| $\dot{V}O_2 = \dot{Q}(C_aO_2 - C_{\bar{v}}O_2)$ |
Fick principle (cardiovascular) |
$\dot{V}O_2$ = area of the rectangle whose height is the a-v O2 difference (read off the Hb curve) and whose width is cardiac output. Endotherms achieve larger rectangles than ectotherms. |
| $C_aO_2 = 1.39 \cdot [Hb] \cdot s_{O_2} + 0.03 \cdot P_aO_2$ |
Arterial O2 content |
Bound + dissolved O2 per unit blood. Splenic RBC release in diving seals raises [Hb], partially compensating for falls in $s_{O_2}$ and $P_aO_2$ during the dive. |
| $P_AO_2 = (P_B - P_{H_2O}) \cdot F_IO_2 - P_ACO_2/R$ |
Alveolar gas equation |
At altitude, hyperventilation lowers $P_ACO_2$, which raises $P_AO_2$ toward inspired $P_IO_2$ — the only ventilatory lever for partially restoring alveolar $P_{O_2}$ when $P_B$ is reduced. |
Glossary of Key Terms
| Term |
Definition |
| Oxygen supply cascade |
Sequential transport steps for O2 from environment to mitochondria: pulmonary ventilation → alveolar gas exchange → blood gas transport → systemic gas exchange → cellular respiration. Used as the integrative scaffold for the course. |
| Aerobic scope |
Ratio of maximum to resting (or standard) metabolic rate. Higher in endotherms than ectotherms; sets the ceiling for sustained aerobic activity. |
| Metabolic acidosis |
Drop in blood pH caused by accumulation of metabolic acids (e.g., lactate/H+ from anaerobic glycolysis); more severe in ectotherms because of low aerobic scope and slow recovery. |
| Burst specialist |
An animal whose locomotor strategy emphasizes brief, high-intensity bouts (sit-and-wait predation, predator escape) supported largely by anaerobic metabolism; typical of many ectotherms. |
| Regional endothermy |
The strategy of using vascular countercurrent heat exchangers to retain metabolic heat in selected tissues (red muscle, viscera, brain/eye), elevating tissue temperature above ambient. Convergent in tunas and lamnid sharks. |
| Retia mirabilia |
Vascular networks of closely apposed arterial and venous vessels that act as countercurrent heat (or O2) exchangers; the anatomical substrate for regional endothermy. |
| Convergent evolution |
Independent evolution of similar traits in unrelated lineages facing similar selective pressures. Week 4 examples: high-charge myoglobin, enlarged spleens, regional endothermy, underwater rebreathing in anoles. |
| Right-to-left (R-L) cardiac shunt |
Mixing of deoxygenated systemic venous blood into systemic arterial blood, bypassing the lungs; common in amphibians and many reptiles with incomplete ventricular separation. Reduces arterial [O2] but allows flexible blood-flow partitioning during diving and breath-holding. |
| Plastron (in diving anoles) |
A thin air bubble trapped against hydrophobic skin during a dive; functions as an auxiliary gas-exchange reservoir into which Anolis lizards can exhale and re-inhale, extending breath-hold. |
| Splenic O2 reservoir |
RBCs stored in the spleen at rest and released into circulation by vasoconstriction at dive onset; defends $C_aO_2$ in diving Weddell seals (and at smaller scale in Bajau humans). |
| a–v O2 difference |
$C_aO_2 - C_{\bar{v}}O_2$; the height of the Fick rectangle. Widens with increased tissue extraction, narrows with arterial desaturation; in diving seals, very wide due to extreme tissue extraction at low venous $P_{O_2}$. |