Lecture 10: Adaptations for Oxygen Delivery and Acute Hypoxia in Diving
Slide 1
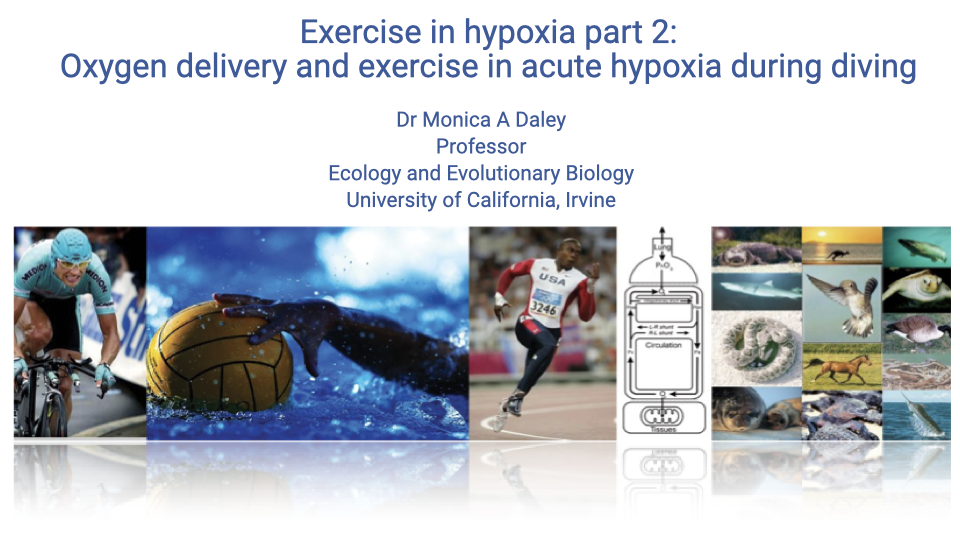
- This lecture is the second of two case studies in hypoxia, continuing the examination of the oxygen supply cascade under low-O2 conditions.
- Part 1 (Lecture 9) focused on chronic hypoxia at high altitude; Part 2 (this lecture) focuses on acute hypoxia during breath-hold diving in mammals (including humans).
- Begins with a recap of the high-altitude story — human highlander populations, avian high-flyers (bar-headed geese) — then transitions to the diving case study, where the limiting condition is intermittent loss of alveolar ventilation rather than chronic low inspired PO₂.
Slide 2
High-Altitude Section — Overview and Learning Objectives Recap
- Overview topics:
- Plasticity in the oxygen supply cascade
- Human and comparative case studies of hypoxia adaptation
- Learning objectives guiding the high-altitude recap:
- Describe the physiological effects of hypoxia on the oxygen supply cascade.
- List the acute and chronic responses to hypoxia experienced by lowlanders.
- Discuss the adaptations to chronic hypoxia observed in highlanders, compared with lowlander responses.
- Compare and contrast responses observed in Tibetan and Andean populations and relate them to functional trade-offs in the cardiovascular system.
- Discuss the general avian and adaptive specialized features that enable bar-headed geese to perform at high altitudes.
Slide 3
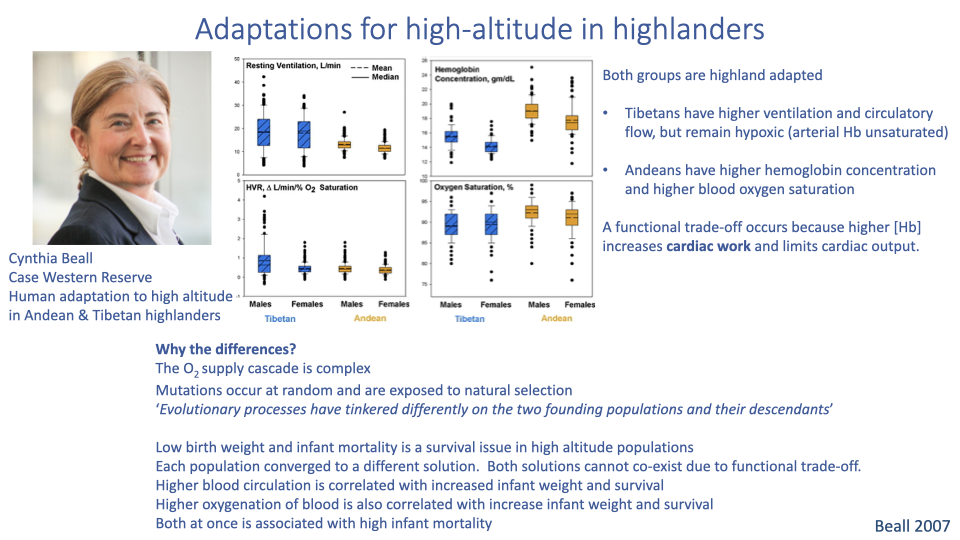
Why Tibetans and Andeans Converged on Different Solutions
- Trade-off at the heart of high-altitude adaptation: increasing cardiac output and [Hb] simultaneously raises blood viscosity, increasing the work of pumping and limiting cardiac output.
- Tibetans solve the problem with high ventilation and high cardiac output — and remain mildly hypoxemic (arterial Hb not fully saturated).
- Andeans solve it with high [Hb] and high arterial saturation — and use lower ventilation rates.
- Why two different solutions?
- The cascade has many tunable steps
- Mutations arise randomly, so different founding populations had different starting variation
- Strong selection pressure comes from infant mortality: higher blood circulation and higher blood oxygenation independently improve infant survival, but combining both drives viscosity high enough to cause its own mortality risk — so each population converged on one solution rather than both.
Slide 4
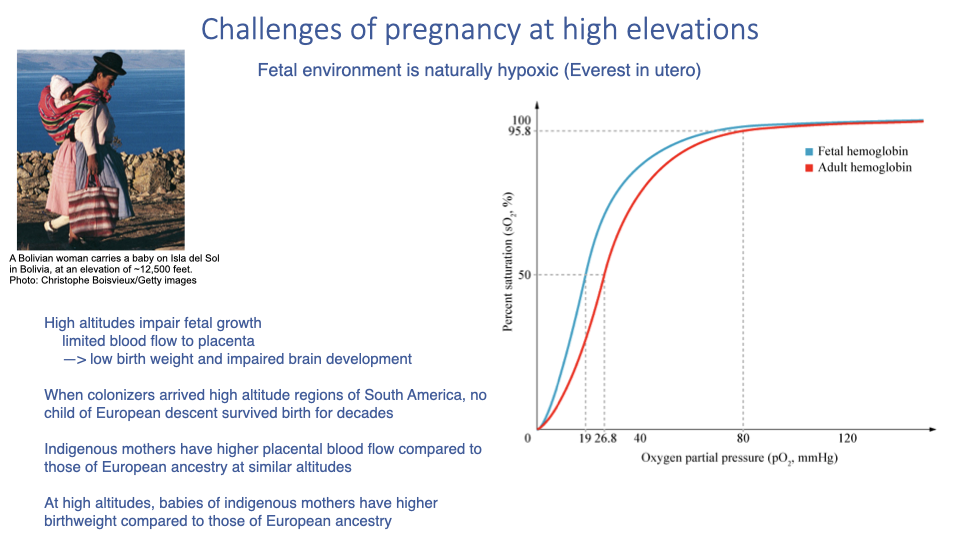
Pregnancy and Childbirth at High Altitude
- The fetal environment is naturally hypoxic — even at sea level it has been likened to “Everest in utero” because the fetus receives partially deoxygenated systemic blood.
- Fetal hemoglobin has a leftward-shifted dissociation curve relative to adult hemoglobin, enabling O2 uptake from maternal blood at low PO₂ (analogous to the bar-headed goose Hb shift).
- At high altitude, the homeostatic responses that protect the mother (e.g., systemic vasoconstriction) restrict placental blood flow, causing:
- Low birth weight
- Impaired brain development
- High infant mortality
- Indigenous high-altitude populations show evolved compensations:
- Higher placental blood flow than European-ancestry mothers at similar altitudes
- Higher birth weights at altitude than babies of European ancestry
- Historical observation: when European colonizers first arrived in Andean mining regions, no child of European descent survived birth for many decades, while indigenous infant survival was much higher.
- In mixed populations the distribution of outcomes overlaps continuously between the two ancestral endpoints.
Slide 5
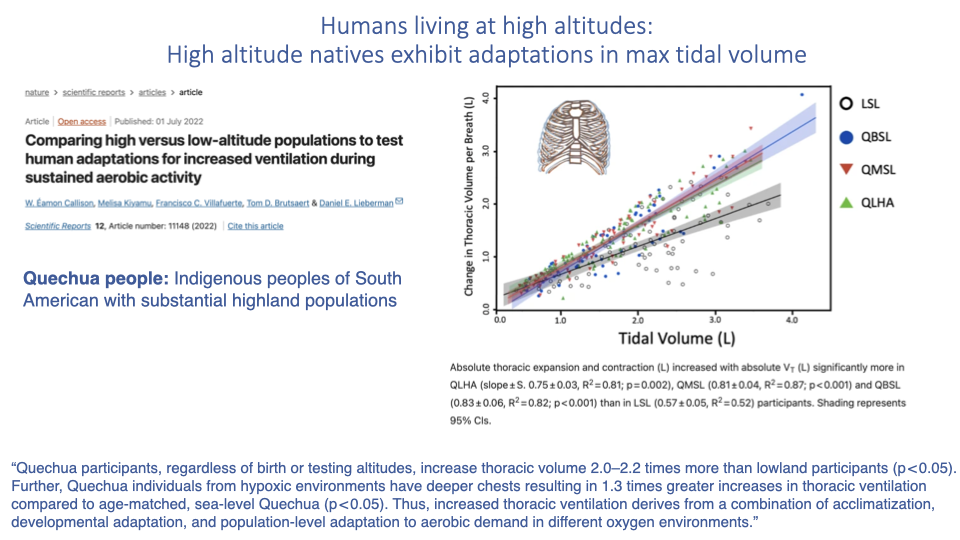
Tidal Volume Capacity in Highland Natives
- A study of Quechua indigenous people of South America addressed an open question from the previous lecture: do high-altitude natives have higher maximum ventilation?
- Answer: yes — Quechua individuals have larger thoracic volume capacity (differently shaped rib cage) and reach higher tidal volumes than lowlanders.
- Comparing those born and raised at high altitude vs. born at low altitude and moved to high altitude vs. lifelong lowlanders revealed:
- Higher tidal volume occurs regardless of birth or testing altitude — suggesting a genetic / population-level component (~2–2.2× greater thoracic expansion than lowlanders).
- But individuals from hypoxic environments have an even greater tidal volume capacity (~1.3× deeper chests than sea-level Quechua), indicating additional developmental plasticity.
- Conclusion: increased thoracic expansion reflects a combination of acclimatization, developmental adaptation, and population-level genetic adaptation to aerobic demand in different oxygen environments.
Slide 6
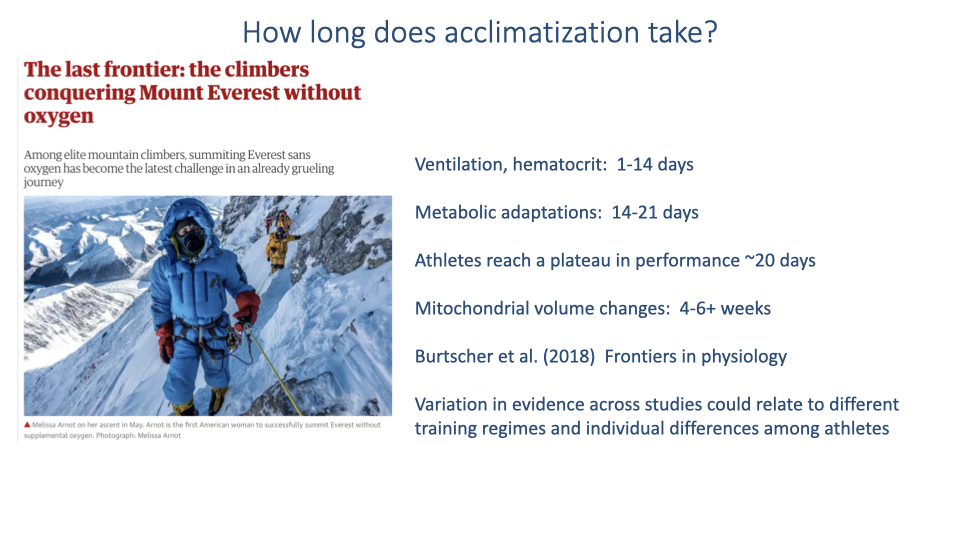
Time Course of Altitude Acclimatization
| Adaptation | Time scale |
|---|---|
| Ventilation, hematocrit | 1–14 days |
| Metabolic adaptations | 14–21 days |
| Athletic performance plateau | ~20 days |
| Mitochondrial volume changes | 4–6+ weeks |
- Athletes who train at altitude tend to plateau in performance around 20 days because over longer time scales mitochondrial density falls (lower O2 availability suppresses mitochondrial volume), eventually offsetting some of the hematological gains.
- Variation across studies reflects differences in training regimens and individual responses.
Slide 7
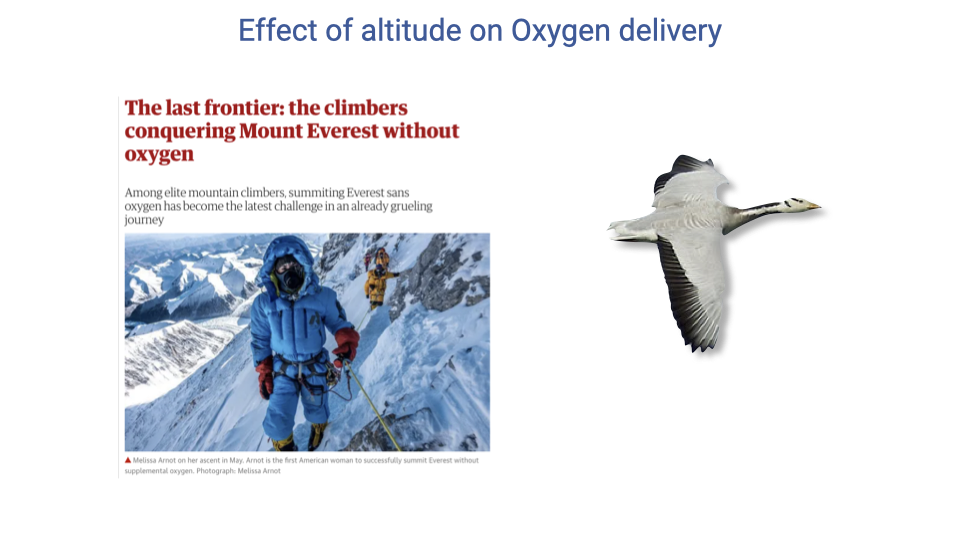
Transition — From Humans to Avian High-Flyers
- Humans attempting to summit Everest without supplemental O2 are operating near the physiological limit of lowland mammalian cascade capacity — even with acclimatization.
- The bar-headed goose, by contrast, routinely flies over the Himalaya on migration — a case study in how an organism can be evolutionarily specialized for performance in severe hypoxia.
- The next several slides revisit the bar-headed goose story with a focus on which steps of the oxygen supply cascade have been modified, and what experimental methods were used to measure them.
Slide 8
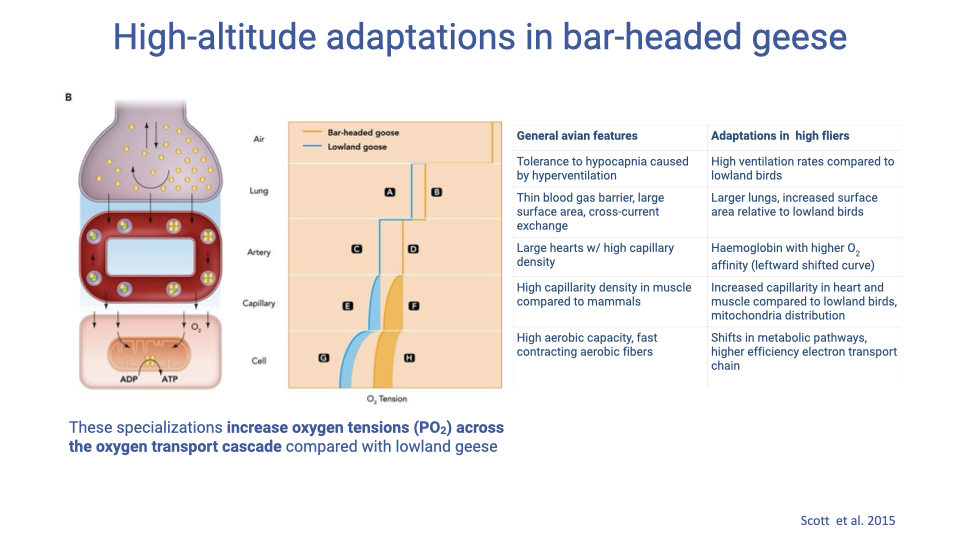
General Avian Features vs. High-Flyer Specializations (by Cascade Step)
- Bar-headed goose specializations increase PO₂ at every step of the cascade relative to lowland geese: the gap between the bar-headed goose and lowland curves widens with each step.
| Step | General avian feature | Bar-headed goose specialization |
|---|---|---|
| 1. Alveolar ventilation | Tolerance to hypocapnia caused by hyperventilation | Higher ventilation rates than lowland birds |
| 2. Alveolar gas exchange | Thin blood–gas barrier, large surface area, cross-current exchange | Larger lungs (more tidal volume and surface area) |
| 3. Blood gas transport | Large hearts with high capillary density | Hemoglobin with higher O2 affinity (leftward-shifted curve) |
| 4. Systemic gas exchange | High capillary density in muscle (vs. mammals) | Increased capillarity in heart and muscle; altered mitochondrial distribution |
| 5. Cellular respiration | High aerobic capacity; fast-contracting aerobic fibers | Shifts in metabolic pathways, higher-efficiency electron transport chain |
- Hypocapnia tolerance: hyperventilation blows off CO2; birds tolerate low PCO₂ better than mammals (relevant to brain vasoconstriction/dilation responses that would limit mammalian hyperventilation).
- Leftward-shifted Hb (like the fetal Hb case on Slide 4) keeps hemoglobin nearly saturated at the low PO₂ found at altitude — bar-headed geese have Hb with higher O2 affinity than closely related lowland species (Canada goose, Peking duck).
- Mitochondrial distribution: clustering of mitochondria near capillaries shortens the diffusion path and maximizes O2 delivery to sites of demand.
Slide 9
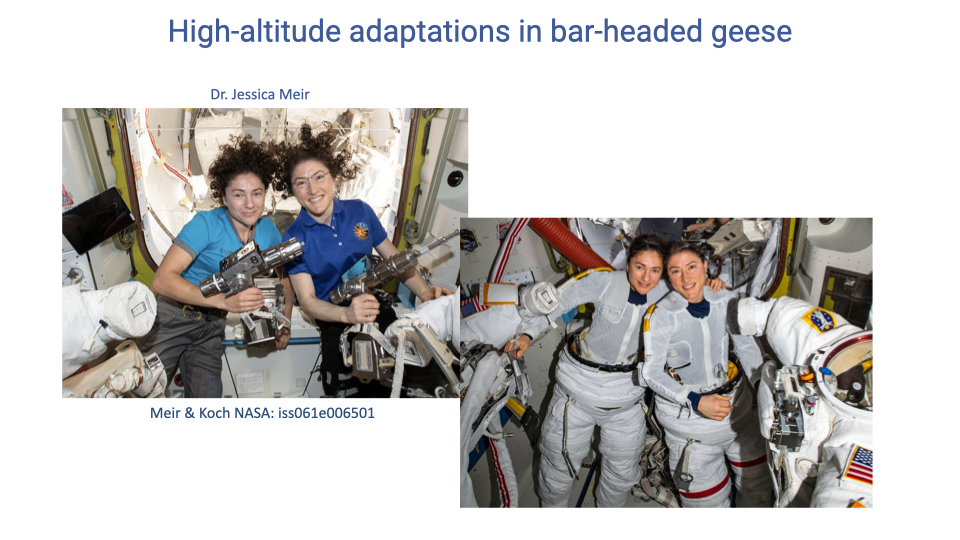
Jessica Meir — From Comparative Physiologist to Astronaut
- Dr. Jessica Meir completed a NASA astronaut career including the first all-female spacewalk with Christina Koch.
- Before becoming an astronaut, Meir was a comparative physiologist — and her PhD research on bar-headed geese is the source of much of the in-flight physiological data in the next slides.
- The backstory is a reminder that the data underlying textbook statements about high-altitude physiology came from specific, technically demanding experiments that required years of preparation.
Slide 10
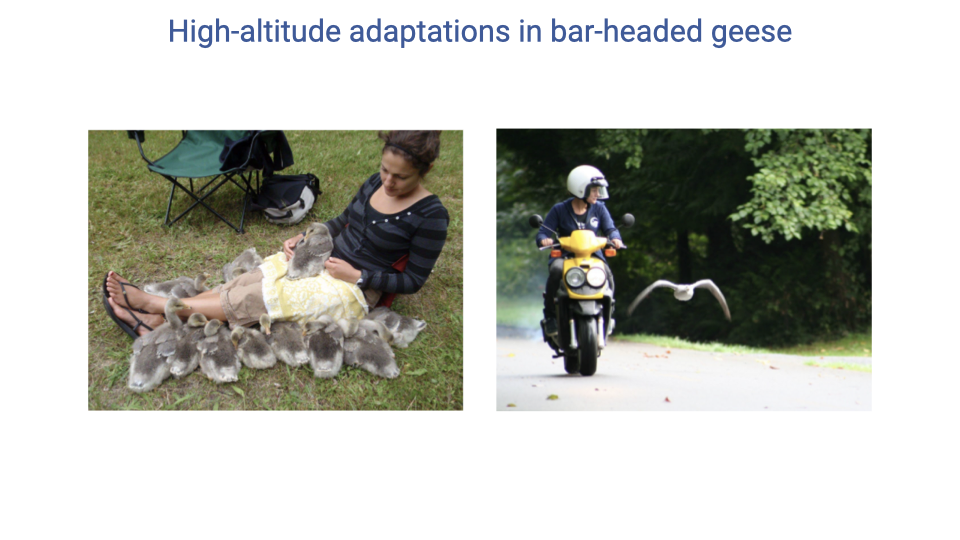
Hand-Rearing and Training Bar-Headed Geese to Fly
- To study bar-headed goose flight physiology, Meir hand-reared the birds from hatchlings so they would be imprinted on her.
- She then had to teach the geese to fly — and learned to fly alongside them (via scooter, ultralight, etc.) — so they would follow her on cue.
- The training also had to prepare the geese to fly in a wind tunnel while wearing a face mask for continuous gas exchange measurements.
- The scale of the behavioral preparation highlights that obtaining in-flight physiological measurements from a wild migratory species is a major research undertaking.
Slide 11
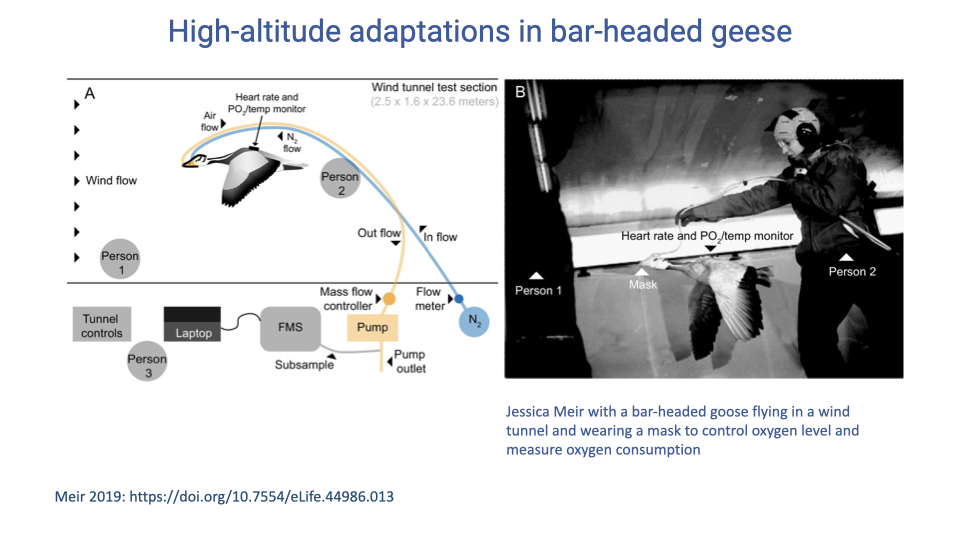
Wind-Tunnel Flight Experiments Under Controlled Hypoxia
- The wind tunnel acts as a “treadmill for birds”: constant air speed lets researchers keep the animal in a fixed spot while measuring physiology.
- The fractional O2 concentration of the tunnel air can be artificially reduced to simulate any target altitude — e.g., 10.5% O2 ≈ 5,500 m above sea level.
- Instrumentation continuously recorded:
- Heart rate (HR)
- VO2 (oxygen uptake) and VCO2 (CO2 production) via the facemask
- Blood gases (partial pressures of O2, CO2)
- Two people were required in the tunnel: one encouraged flight; Meir held the tubing outside the airflow so mask weight did not drag on the bird.
- The birds could be measured not only during flight but also during rest, walking, and running for comparison.
Slide 12
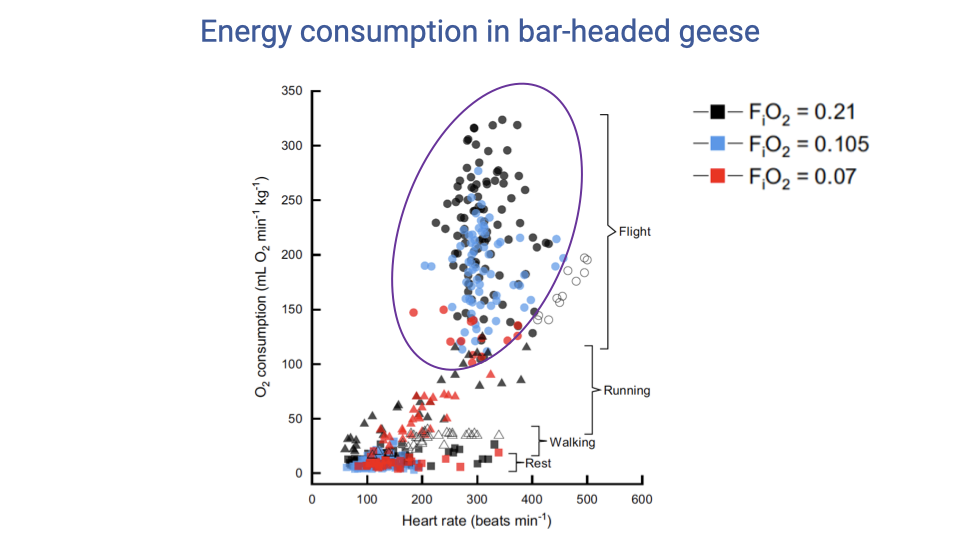
Energy Cost of Flight Across Hypoxia Levels
- Behaviors arrange in a predictable order of energetic cost: rest < walk < run < flight. Flight is the most energetically demanding behavior by a wide margin.
- The expected near-linear relationship between VO2 and heart rate is evident within each behavior but is messy for flight — high variability in in-flight VO2 even at similar heart rates.
- Two main sources of the scatter:
- Behavioral variability: birds can fly more or less efficiently (bouncing vs. shuffling analogue in running), which changes the metabolic cost.
- Environmental/substrate effects (grass vs. treadmill analogue).
- Key observation: the minimum flight VO2 is similar across normoxia (black, 21%), moderate hypoxia (blue, 10.5%), and severe hypoxia (red, 7%) — so the most efficient way to fly costs about the same in any O2 environment; severe hypoxia simply restricts the bird to flying in that most efficient way.
Slide 13
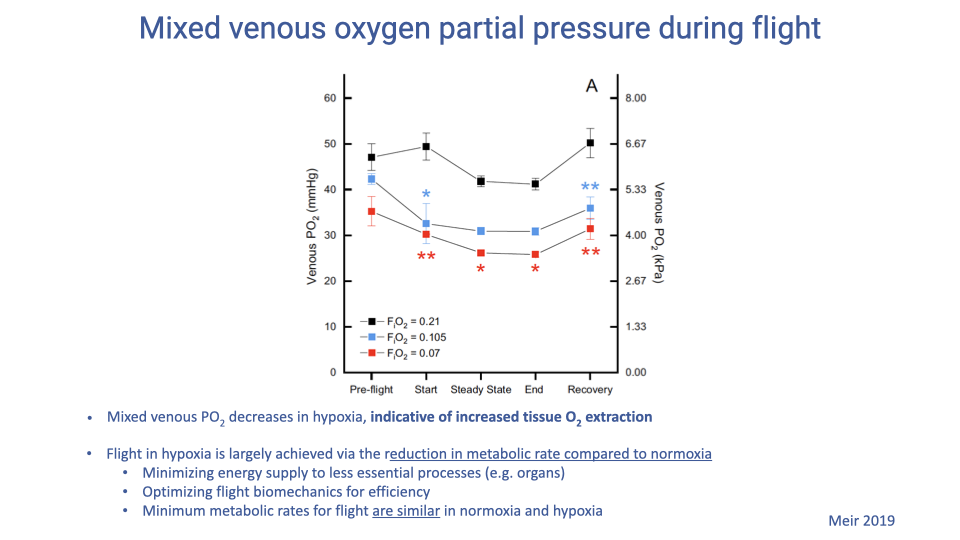
Mixed Venous PO₂ — Increased Tissue Extraction in Hypoxia
- Mixed venous PO₂ (the partial pressure of O2 in blood returning to the heart) decreases in hypoxia compared with normoxia, at every phase of flight.
- A lower venous PO₂ means the a–v O2 difference (extraction) is wider — tissues are removing a larger fraction of the O2 delivered per unit blood.
- Flight in severe hypoxia is achieved largely through a reduction in metabolic rate compared with normoxia. Contributing mechanisms:
- Restricting blood flow (and thus O2 supply) to non-essential organs to preserve supply for flight muscle, heart, and brain.
- Optimizing flight biomechanics for efficiency — e.g., shorter wing strokes, slightly higher flapping frequency than in normoxia.
- The minimum metabolic rate for flight is similar in normoxia and hypoxia, but in severe hypoxia the bird is forced to fly at that minimum.
- In combination with the leftward-shifted Hb, the result is unchanged or increased arterial loading paired with greater tissue extraction, keeping mitochondrial supply adequate despite a much lower inspired PO₂.
Slide 14
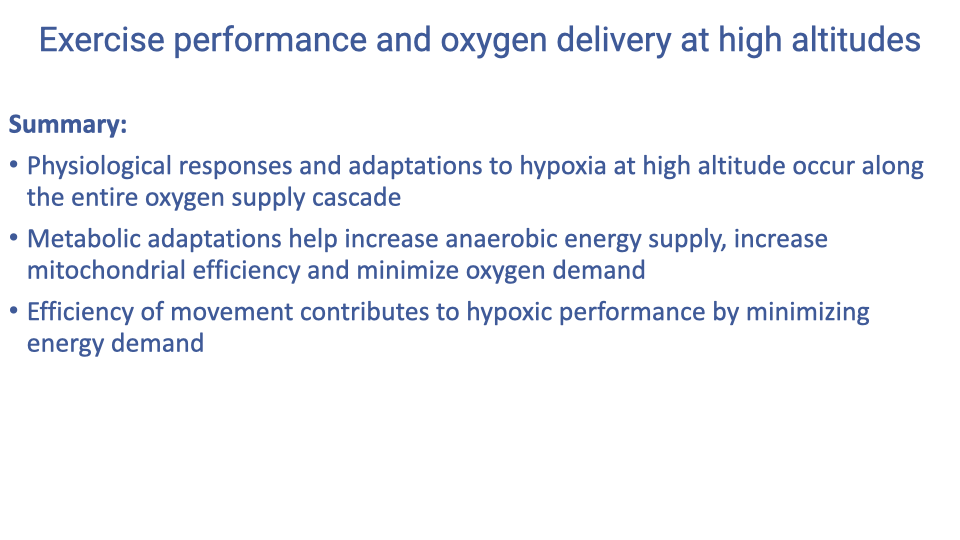
Summary of the High-Altitude Story
- Physiological responses and adaptations to high-altitude hypoxia occur along the entire oxygen supply cascade — no single step is rate-limiting in isolation.
- Metabolic adaptations increase anaerobic energy supply, enhance mitochondrial efficiency, and minimize oxygen demand.
- Movement efficiency (e.g., flight biomechanics in geese, slow climbing in summiteers) is itself a hypoxia strategy because it lowers the energy that must be supplied aerobically.
- Closing recap before the lecture transitions from chronic hypoxia (high altitude) to acute hypoxia (breath-hold diving). The same cascade framework will now be used to organize the diving adaptations.
Slide 15
Diving Section — Learning Objectives
- Describe the physiological features that are most critical for performance in acute hypoxia during diving.
- Provide examples of adaptations that enable extended dive times and relate these to the oxygen supply cascade.
Slide 16
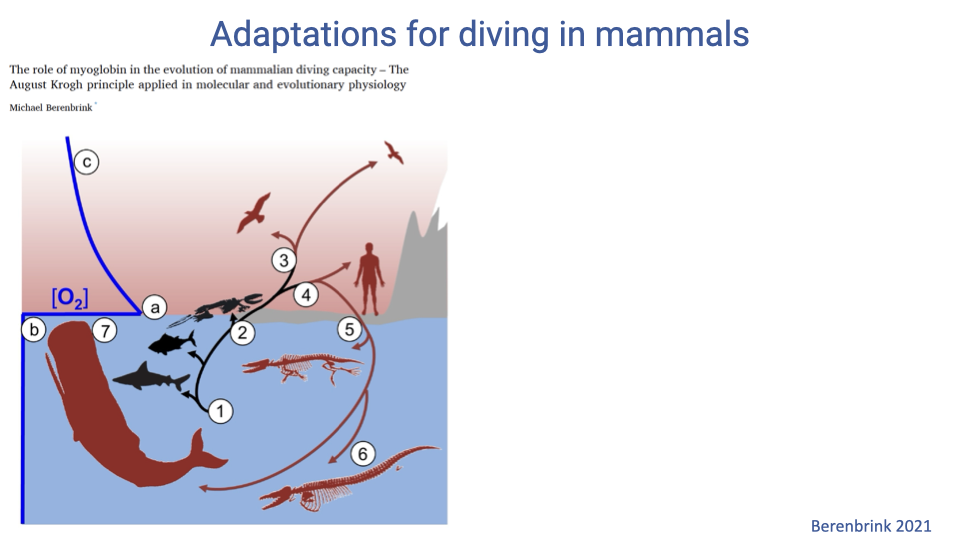
Independent Evolutionary Origins of Diving in Mammals
- Diving lifestyles have evolved multiple times independently in mammals — cetaceans, pinnipeds, sirenians, otters, and others.
- All these lineages show convergent physiological adaptations to acute hypoxia despite separate evolutionary origins.
- Studying convergence highlights which features of the oxygen supply cascade are most useful for breath-hold performance.
Slide 17
Why Diving Is an Acute-Hypoxia Problem
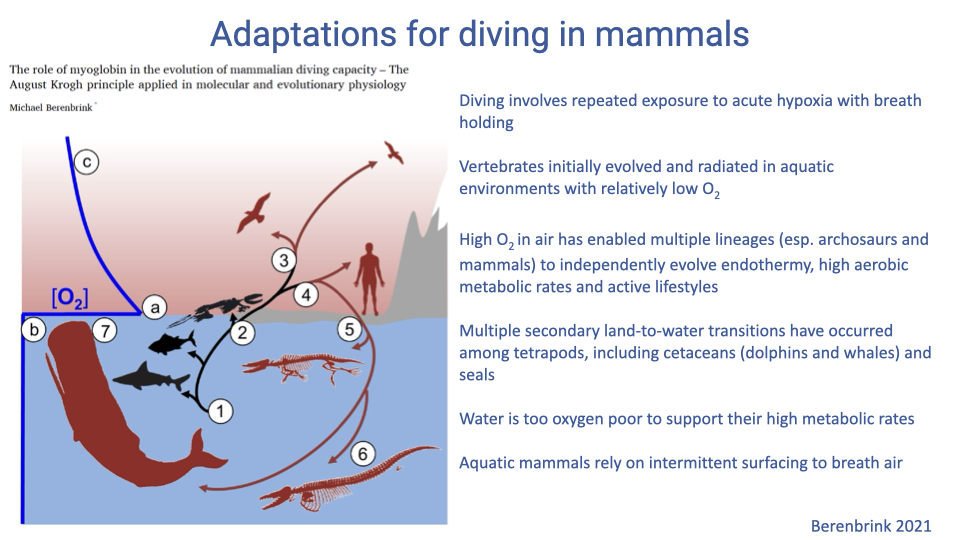
- Vertebrates first evolved in aquatic environments, then tetrapods diversified on land where high atmospheric O2 supported the evolution of endothermy and high aerobic scope.
- When mammalian lineages secondarily returned to water, they did not revert to gills — water cannot support the metabolic demands of an athletic endotherm.
- Diving mammals therefore surface intermittently to breathe, and dives are episodes of acute, repeated hypoxia with completely shut-down alveolar ventilation.
Slide 18
Which Cascade Steps Matter for Diving?
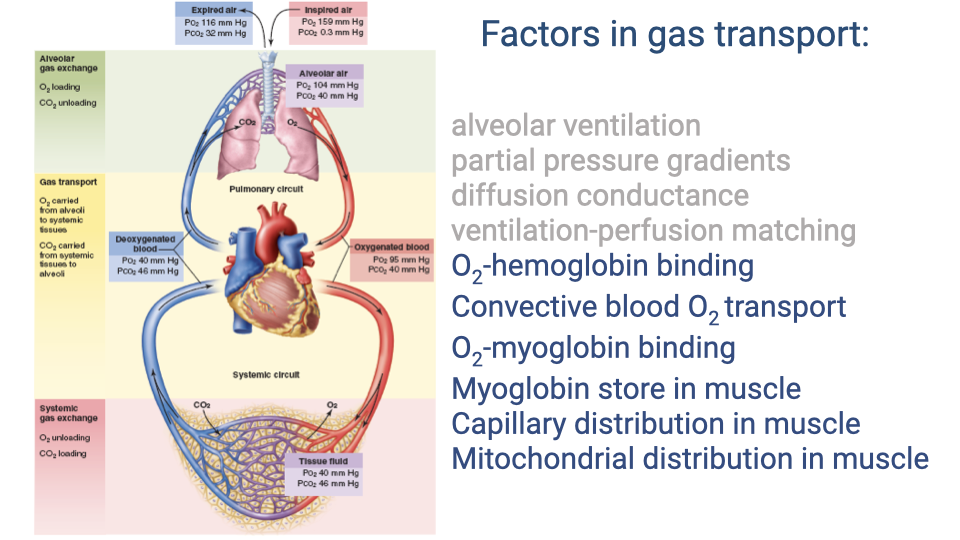
- During a breath-hold dive, alveolar ventilation is shut off — the diver depends entirely on stored O2 distributed across the rest of the cascade.
- Critical factors during a dive:
- O2-hemoglobin binding and total blood O2 store
- Myoglobin binding and muscle O2 store
- Capillary distribution in muscle (regulating where blood flow goes)
- Mitochondrial distribution (matching diffusion distance)
Slide 19
Myoglobin: The Intramuscular O2 Store
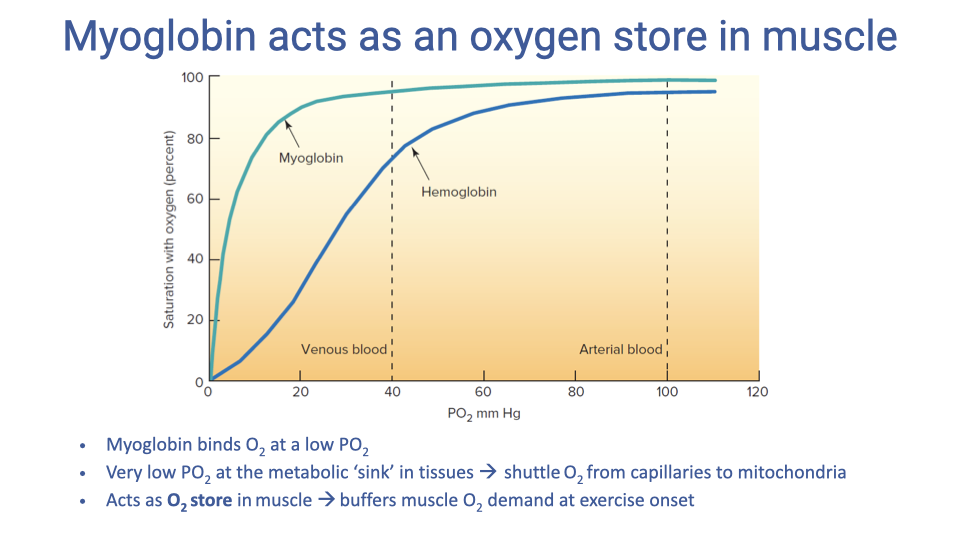
- Myoglobin (Mb) is a single-subunit O2-binding protein in muscle cells, with much higher O2 affinity than hemoglobin (its dissociation curve is hyperbolic and leftward shifted).
- Functions:
- Shuttle O2 from capillaries to mitochondria across the very low intracellular PO₂.
- Act as an intramuscular O2 store that buffers the start of exercise and, in divers, the duration of breath holds.
Slide 20
Dive Duration Scales With Body Size — But Specialists Outperform
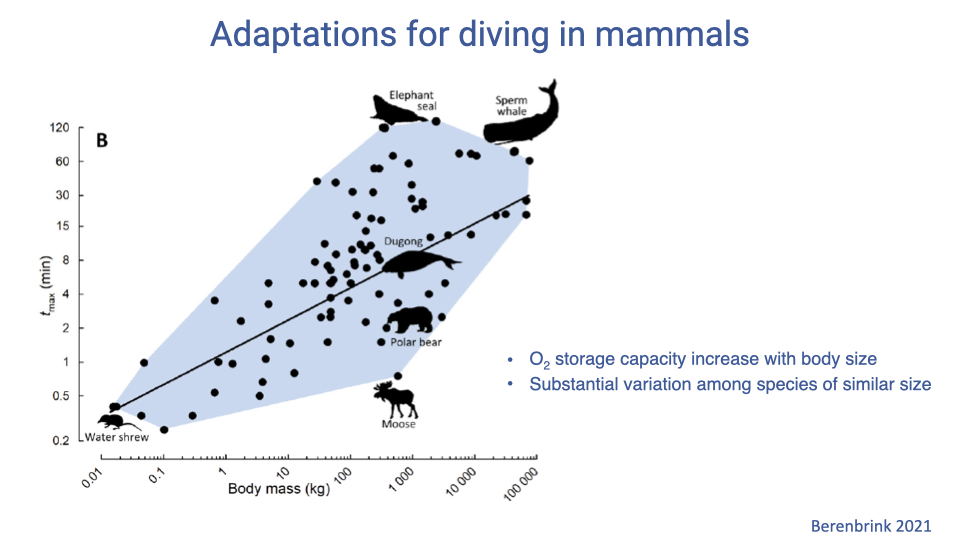
- Across mammals, maximum dive duration scales positively with body mass (log-log) — larger animals can store more total O2.
- Specialized divers (e.g., elephant seal, sperm whale) lie well above the general scaling line: their dive durations are far longer than would be predicted from body size alone.
- This points to species-specific physiological specializations beyond simple body-size scaling.
Slide 21
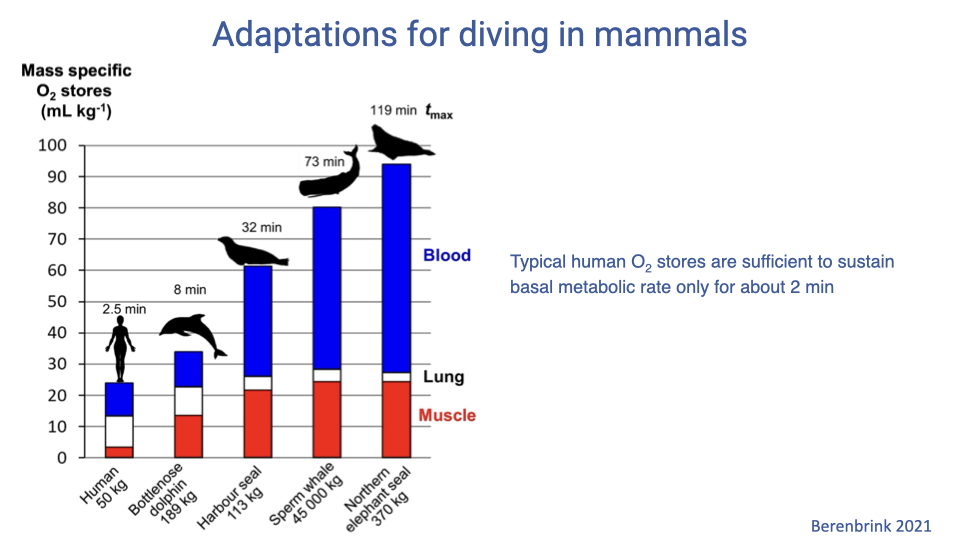
Distribution of Mass-Specific O2 Stores
| Species | Body mass | Max dive | Distribution of O2 stores |
|---|---|---|---|
| Human | 50 kg | ~2.5 min | Mostly lung; very little in blood or muscle |
| Bottlenose dolphin | 189 kg | ~8 min | Higher blood and muscle |
| Harbor seal | 113 kg | ~32 min | Much higher blood and muscle |
| Sperm whale | 45,000 kg | ~73 min | Very high blood and muscle |
| Northern elephant seal | 370 kg | ~119 min | Highest mass-specific stores; mostly blood and muscle |
- Humans store O2 primarily in the lungs, sufficient only for ~2 minutes at basal metabolic rate.
- Specialized divers store much more O2 in blood ([Hb]) and muscle ([Mb]), enabling far longer dives.
- The amount of storage and how it is partitioned reflects the animal’s ecology (e.g., how deep and how long they need to dive to find prey).
Slide 22
![Slide titled "Adaptations for diving in mammals" with the Qvist et al. journal article titled "Hemoglobin concentrations and blood gas tensions of free-diving Weddell seals" on the right, featuring Figure 1 — a plot of hematocrit/Hb content vs. time during dive and recovery for short (<17 min) and long (>17 min) dives in a 350-kg Weddell seal. [Hb] rises sharply for the first ~10 minutes of diving and then returns to baseline within 12–16 minutes after surfacing. A photo of a Weddell seal underwater is on the left. Bullet points: [Hb] and [RBC] increased for the first 10 minutes of diving, return to resting values in 12–16 minutes; Weddell seal has the largest spleen as % body weight of any other mammal (7% body weight); estimated 60% of the RBC mass is stored in the spleen at rest in Weddell seals.](/E183_ExercisePhysiology/week04/images/lec10/slide-022.png)
The Spleen as an On-Demand O2 Reservoir — Weddell Seal Data
- [Hb] rises rapidly during a dive in Weddell seals, then returns to baseline 12–16 minutes after surfacing.
- Mechanism: systemic peripheral vasoconstriction during the dive squeezes the spleen, injecting stored red blood cells into circulation.
- The Weddell seal has the largest spleen as a fraction of body weight of any mammal (~7% of body mass).
- An estimated 60% of total RBC mass is stored in the spleen at rest, available on demand for diving.
Slide 23
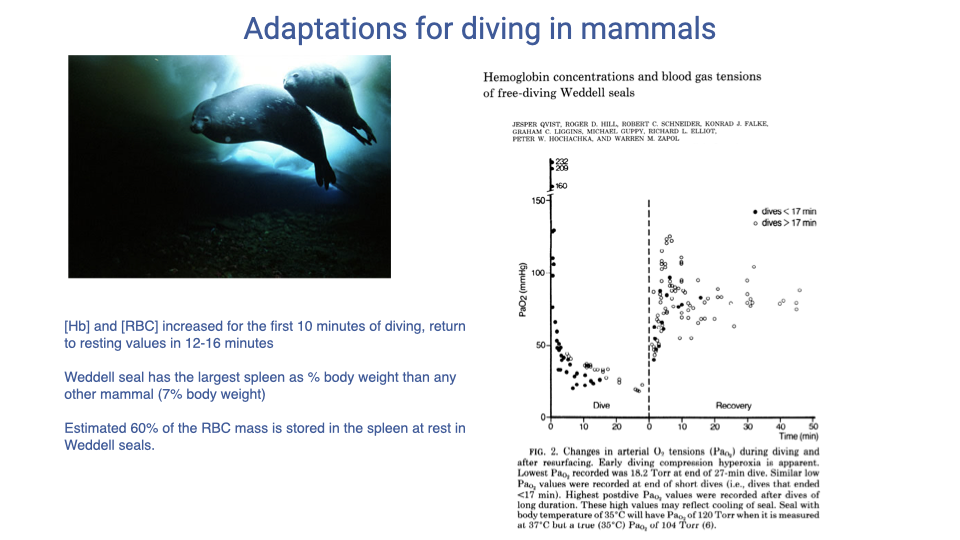
Arterial PaO₂ During Long Dives — Severe Arterial Hypoxemia
- The same Qvist et al. Weddell seal study measured arterial PaO₂ during dive and recovery.
- PaO₂ falls steeply through the dive, with the longest dives (>17 min) reaching values that would be lethal to a terrestrial mammal.
- The Weddell seal tolerates this severe arterial hypoxemia because:
- Vital organs (brain, heart) are selectively perfused via peripheral vasoconstriction.
- Muscle depends on myoglobin-bound O2, decoupling muscle function from arterial PO₂.
- The steep portion of the Hb dissociation curve dumps a large fraction of the remaining O2 into tissue at low PO₂.
- During recovery, PaO₂ rebounds rapidly when surface breathing resumes and the RBC reservoir in the spleen is replenished between dives.
Slide 24
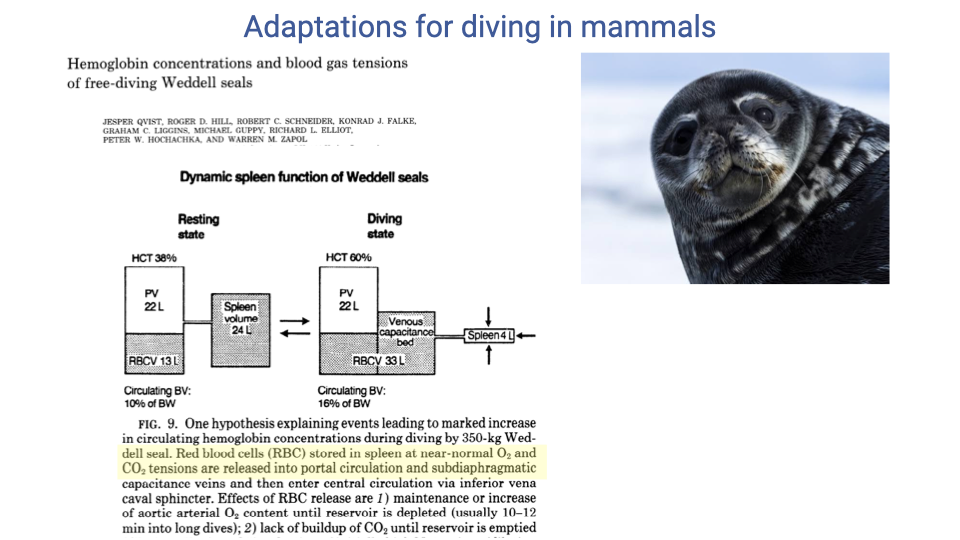
Dynamic Spleen Function
- The spleen functions dynamically as a contractile O2 reservoir:
- At rest: spleen is large (~24 L in a 350-kg Weddell seal), packed with RBCs at ~60% HCT; systemic blood HCT ~38%; total circulating blood volume ~10% of body mass.
- During a dive: spleen contracts, injects red blood cells into the systemic circulation; HCT rises to ~60%; circulating blood volume expands to ~30% of body mass.
- Refills during the recovery interval between dives.
- This allows the seal to defend CaO₂ for an extended period despite the absence of pulmonary gas exchange — aortic arterial O2 content is maintained until the splenic RBC reservoir is depleted.
- The combination of large blood volume + concentrated erythrocyte reservoir is a distinctive cardiovascular adaptation of long-duration divers.
Slide 25
![Slide titled "Adaptations for diving in mammals" featuring the equation $C_aO_2 = 1.39 \cdot [Hb] \cdot s_{O_2} + P_aO_2 \cdot 0.03$, with a definition list: 1.39 = grams O2 bound per gram Hb at full saturation; sO2 = fractional saturation of Hb with O2; PaO2 = partial pressure of O2 in arterial blood; 0.03 = solubility of O2 in blood. A photo of a free-diving seal is at left, and a scatter plot at right shows arterial oxygen content vs. dive depth or time across species.](/E183_ExercisePhysiology/week04/images/lec10/slide-025.png)
Quantifying Blood O2 Content for Divers
- Arterial O2 content is given by:
- Where:
- 1.39 mL O2/g Hb = O2 binding capacity at full saturation
- sO₂ = fractional saturation of hemoglobin
- PaO₂ = arterial O2 partial pressure
- 0.03 = O2 solubility coefficient (small contribution from dissolved O2)
- For divers, increasing [Hb] (via splenic release) is the dominant lever for raising CaO₂, since sO₂ cannot be raised above ~100%.
Slide 26
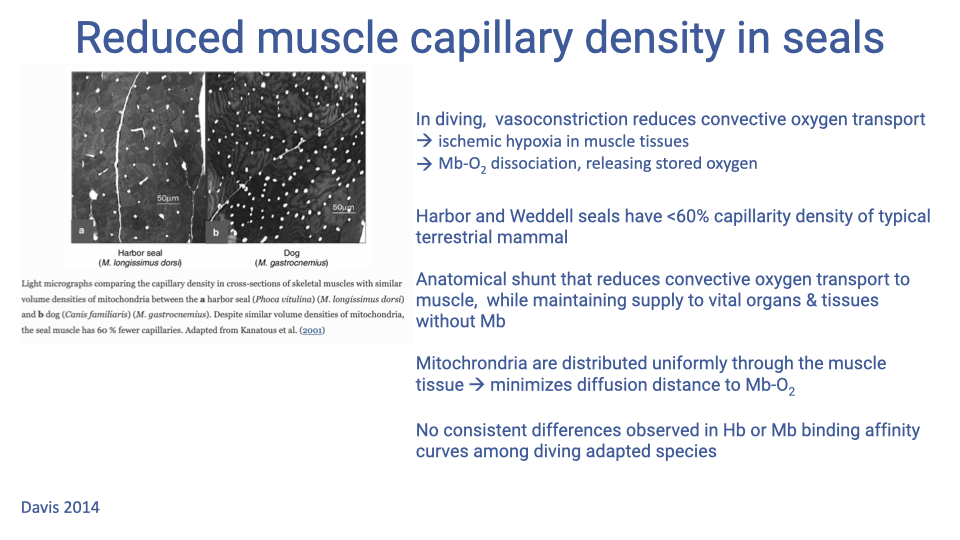
Reduced Capillary Density and Anatomic Shunting
- Counterintuitive at first: diving mammals have lower muscle capillary density (<60% of typical terrestrial mammals).
- The combination of systemic peripheral vasoconstriction + low capillary density acts as an anatomical shunt:
- Reduces convective O2 transport to muscle
- Preserves O2 delivery to vital organs (brain, heart) and non-Mb tissues
- The ischemic muscle environment drops local PO₂ to where the steep portion of the Hb dissociation curve dumps a much larger fraction of bound O2 into the tissue — e.g., venous Hb saturation falling from ~50% to ~20%.
- Mitochondria are distributed uniformly through the muscle to minimize diffusion distance to myoglobin.
- Notably, Hb and Mb binding affinity curves are not consistently shifted in diving species — the regulation is in vascular control, not in the binding proteins themselves (a key contrast with high-altitude species).
Slide 27
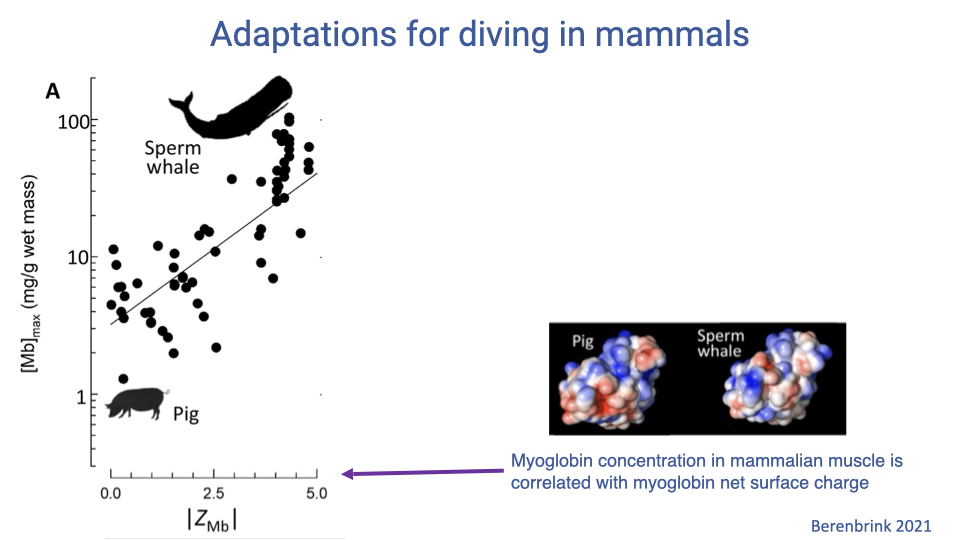
Myoglobin Surface Charge as an Adaptation
-
Across mammals, muscle [Mb] correlates with myoglobin net surface charge ( ZMb ). - Higher net positive charge enables higher [Mb] in muscle without aggregation.
- Sperm whales and other deep divers have much higher ZMb than terrestrial mammals like pigs.
- This is an example of adaptation in the molecular properties of myoglobin rather than in its O2-binding affinity.
Slide 28
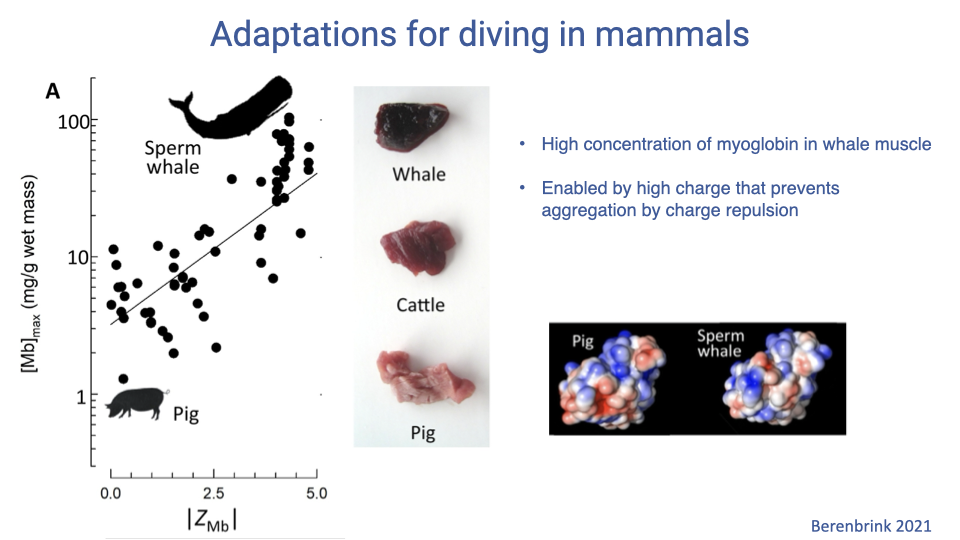
Why Charge Allows Higher Myoglobin Concentrations
- A higher net surface charge causes Mb molecules to electrostatically repel each other, preventing aggregation at very high intracellular concentrations.
- This permits whale muscle to carry far more Mb per gram than pig or cattle muscle, visible as a much darker red color.
- This is a clear example of a molecular-level adaptation enabling a macroscopic physiological capability (longer dive duration).
Slide 29
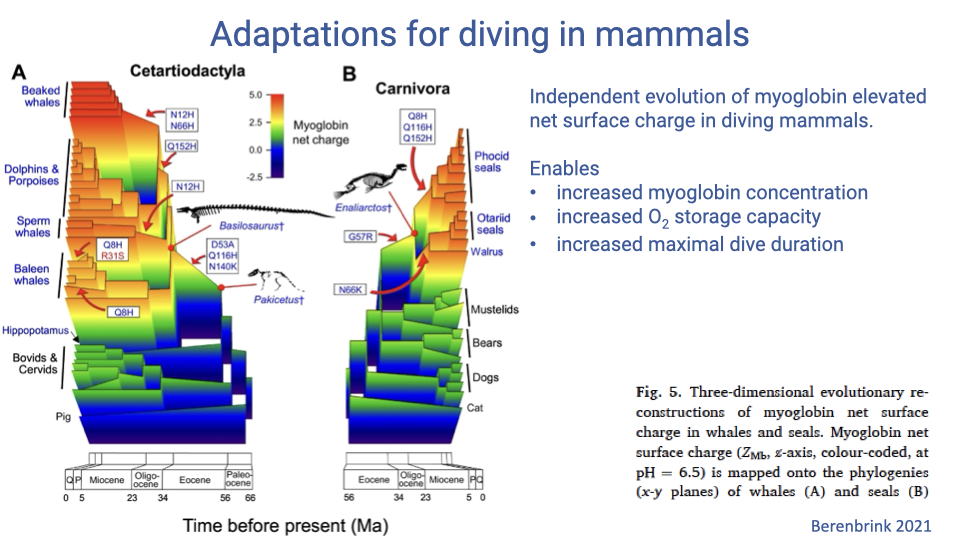
Independent Evolution of High-Charge Myoglobin
- Phylogenetic mapping of reconstructed ZMb shows high-charge myoglobin has evolved independently in multiple diving lineages (e.g., cetaceans within Cetartiodactyla; pinnipeds within Carnivora).
- This convergent evolution highlights the importance of muscle O2 storage in diving performance.
- Each independent origin enables:
- Increased myoglobin concentration
- Increased muscle O2 storage
- Increased maximum dive duration
Slide 30
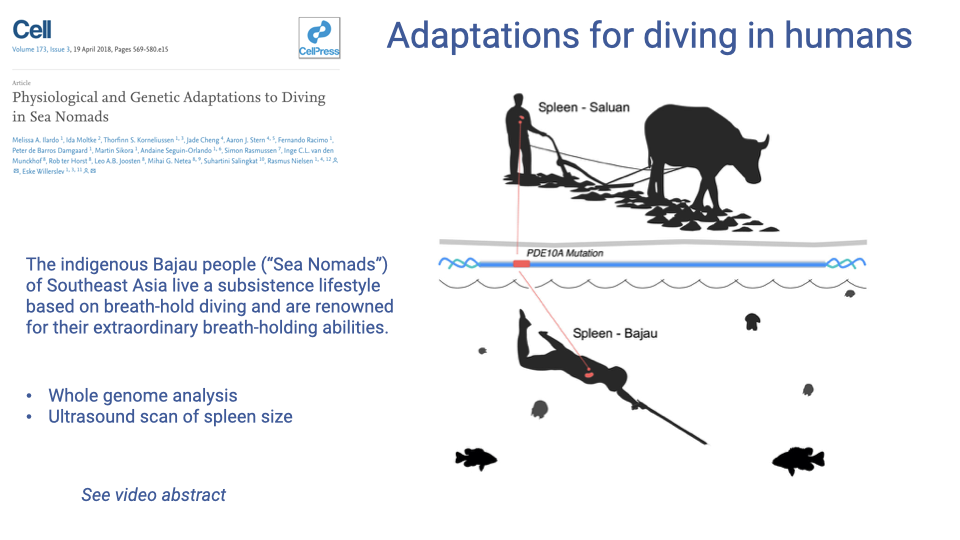
Bajau “Sea Nomads” — A Human Diving Adaptation Case Study
- The Bajau people of Southeast Asia have lived for many generations on a subsistence economy based on breath-hold diving for seafood.
- They are renowned for extraordinary breath-holding abilities — among the best human divers in the world.
- The Saluan people are a closely related neighboring population that subsists on farming and agriculture rather than diving — they serve as the comparison group.
- Researchers used whole-genome sequencing and ultrasound (to measure spleen size) to ask whether the Bajau show genetic and anatomical adaptations to diving.
Slide 31
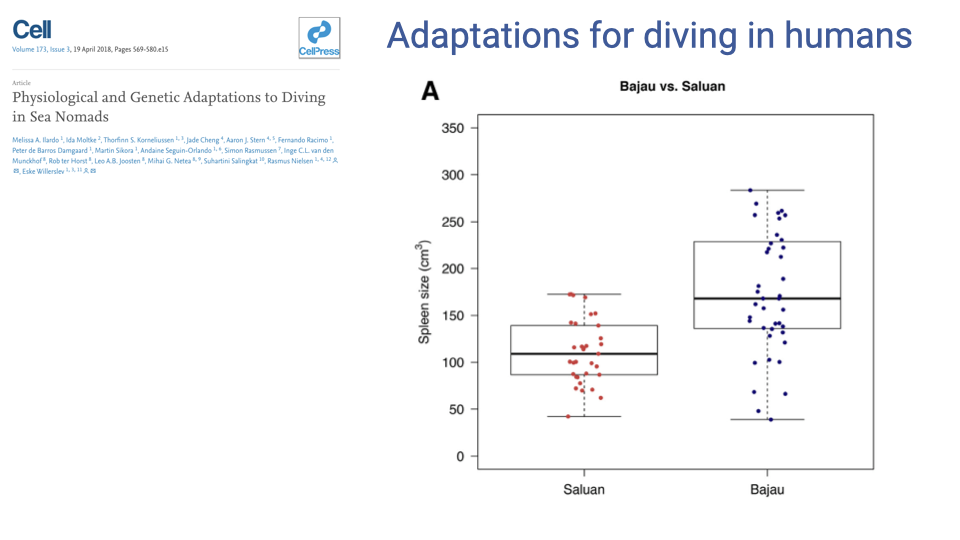
Bajau vs. Saluan Spleen Size
- The Bajau have significantly larger spleens than the closely related Saluan population.
- Distributions overlap, but the upper end of the Bajau distribution is much higher — highlighting the substantial genetic variability in human populations, with selection for larger spleens acting on that variation.
- This parallels the Weddell seal finding: an enlarged spleen acts as an on-demand red blood cell reservoir, mobilized by vasoconstriction at the start of a dive.
Slide 32
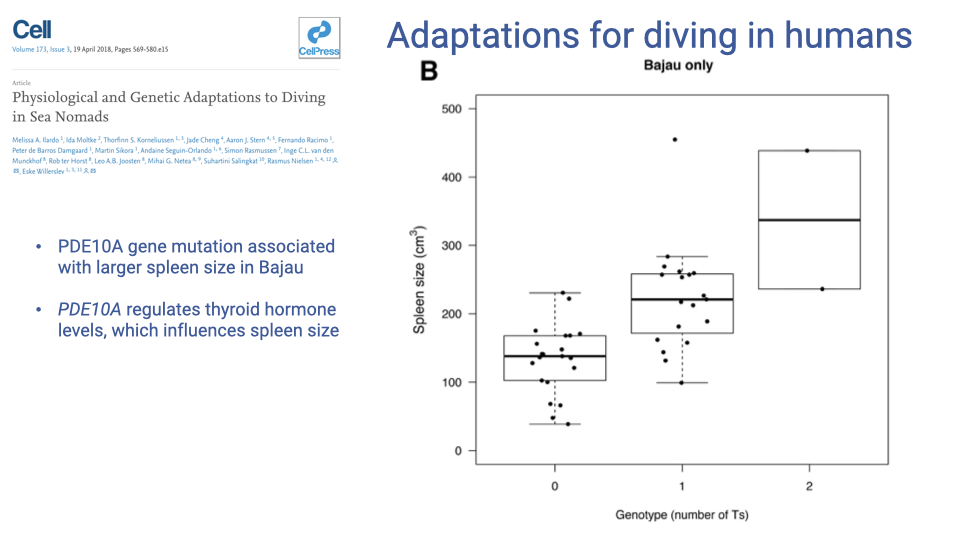
A Specific Gene: PDE10A and Spleen Size
- A mutation in the PDE10A gene is associated with larger spleen size in the Bajau.
- PDE10A regulates thyroid hormone levels, which in turn influence spleen size (developmental link).
- Within the Bajau population, individuals with more copies of the variant allele have larger spleens (dose-dependent: 0 → 1 → 2 T alleles).
- This is a clean example of a specific genetic variant linked to a diving-relevant phenotype in a human population, discovered by combining genome sequencing with physiological measurements.
Slide 33
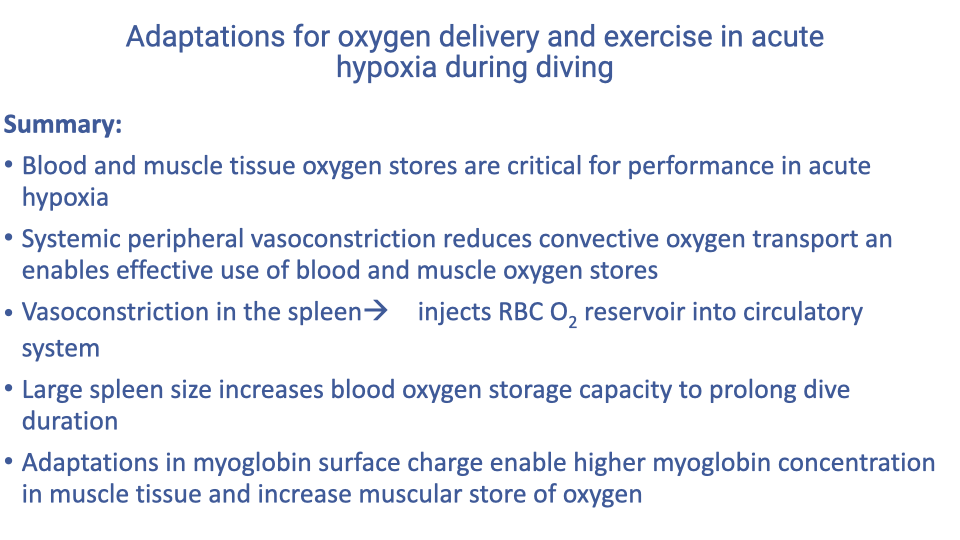
Lecture 10 — Key Takeaways
- Diving is acute hypoxia: alveolar ventilation is shut off, so divers depend on stored O2 in blood and muscle. Pulmonary gas exchange and inspired PO₂ are temporarily irrelevant during the dive itself.
- Diving has evolved independently in many mammalian lineages, and the convergent adaptations point to which steps of the cascade are most critical for breath-hold performance.
- Myoglobin is the dominant intramuscular O2 store; its leftward-shifted dissociation curve makes it a perfect short-term reservoir near mitochondria.
- O2-store distribution differs sharply between humans (mostly lung) and specialized divers (mostly blood and muscle); humans can sustain BMR only for ~2 minutes from internal stores.
- The spleen acts as an RBC reservoir in Weddell seals (~7% body mass) and, on a smaller but real scale, in Bajau human divers (PDE10A genetic association).
- Systemic peripheral vasoconstriction + reduced muscle capillary density create an anatomical shunt that preserves O2 for the brain and heart and maximally exploits the steep portion of the Hb dissociation curve to dump O2 at active tissue.
- High-charge myoglobin evolved independently in cetaceans and pinnipeds, allowing extreme intramuscular [Mb] without aggregation — a molecular adaptation behind the dark red muscle of deep divers.
- Hb and Mb binding curves themselves are not shifted in most diving species — adaptation is in vascular regulation, total store, and protein concentration, not in O2 affinity (a contrast with high-altitude species).
Key Equations
| Equation | Name | Description |
|---|---|---|
| $C_aO_2 = 1.39 \cdot [Hb] \cdot s_{O_2} + 0.03 \cdot P_aO_2$ | Arterial O2 content | Total O2 per unit blood; Hb-bound term dominates. Divers raise CaO₂ by raising [Hb] via splenic RBC release. |
| $\dot{V}O_2 = \dot{Q}(C_aO_2 - C_{\bar{v}}O_2)$ | Fick principle (cardiovascular) | During a dive, $\dot{Q}$ to muscle is suppressed by vasoconstriction; the wide a-v difference reflects high tissue extraction. |
| $\text{Total O}_2 \text{ store} = (V_{lung} \cdot F_{lung,O_2}) + (V_{blood} \cdot C_{aO_2}) + (V_{muscle} \cdot [Mb] \cdot 1.34)$ | Whole-body O2 stores | Sum of O2 in lung gas, blood (Hb-bound), and muscle (Mb-bound). Diving specialists shift the balance toward blood and muscle. |
Glossary of Key Terms
| Term | Definition |
|---|---|
| Acute hypoxia | A short-duration episode of reduced O2 availability — in diving, caused by breath-holding rather than by reduced inspired PO₂. |
| Breath-hold diving | Diving without external air supply; the diver depends entirely on stored O2 for the duration of the dive. |
| Myoglobin (Mb) | Single-subunit O2-binding protein in muscle cells with high affinity and a hyperbolic (leftward-shifted) dissociation curve; functions as both an intramuscular shuttle and an O2 store. |
| Myoglobin net surface charge (ZMb) | The total electrostatic charge on the myoglobin surface; high values prevent aggregation at high concentrations and have evolved independently in cetaceans and pinnipeds. |
| Splenic O2 reservoir | The store of red blood cells in the spleen; mobilized at dive onset by vasoconstriction. ~60% of RBC mass is stored splenically in Weddell seals, which have spleens up to ~7% of body mass. |
| Systemic peripheral vasoconstriction (dive response) | Reflex constriction of arterioles supplying skeletal muscle and non-essential organs at dive onset; preserves O2 delivery to brain and heart. |
| Anatomical shunt (in divers) | The functional redirection of blood away from muscle by reduced capillary density and vasoconstriction; reduces convective O2 transport to muscle while preserving central organ perfusion. |
| Bajau (“Sea Nomads”) | An indigenous Southeast Asian people whose subsistence breath-hold diving has been associated with enlarged spleens and a PDE10A genetic variant. |
| Saluan | A closely related, non-diving agricultural population used as the comparison group in the Bajau genetics/spleen study. |
| PDE10A | A gene whose variants are associated with larger spleen size in the Bajau, mediated by effects on thyroid hormone signaling. |
| Weddell seal | A model species for diving physiology; long-duration diver with the largest spleen as a fraction of body mass of any mammal (~7%). |
| Mass-specific O2 stores | Total body O2 store per unit body mass, partitioned into lung, blood, and muscle compartments; specialized divers have much higher blood and muscle fractions than humans. |
| Bar-headed goose (high-flyer) | Migratory goose that routinely crosses the Himalaya; textbook example of convergent adaptation along the avian oxygen supply cascade (larger lungs, leftward-shifted Hb, higher capillarity, etc.). |
| Quechua | Indigenous peoples of South America whose highland populations show greater thoracic volume capacity and higher tidal volumes than lowlanders. |
| FiO₂ | Fractional concentration of inspired O2. Normoxia ≈ 0.21; simulated altitudes in Meir’s bar-headed goose wind-tunnel experiments used 0.105 (~5,500 m) and 0.07 (severe hypoxia). |
| Mixed venous PO₂ | Partial pressure of O2 in blood returning to the heart. Lower values indicate wider a-v O2 difference and greater tissue O2 extraction. |
| Cross-current gas exchange | The avian lung arrangement (perpendicular blood and air flow) — intermediate in efficiency between countercurrent (fish gill) and tidal-pool (mammalian lung) exchange. |
| Countercurrent gas exchange | Arrangement in which blood and the respiratory medium flow in opposite directions, maximizing diffusion gradient across the entire exchange surface. Found in fish gills and various heat-exchange systems. |
| Tidal-pool exchange | The mammalian lung arrangement: gas in the alveolus does not flow directionally relative to blood, so the gradient equilibrates more rapidly than in countercurrent or cross-current systems. |