Lecture 9: Exercise Performance and Oxygen Delivery at High Altitude
Slide 1
- This lecture is the first of two case studies in hypoxia that bridge from the general oxygen supply cascade to the extremes of physiological performance.
- Topic: how the oxygen supply cascade responds and adapts when atmospheric oxygen is reduced at high altitude.
- Case studies focus on humans (sea-level natives ascending to altitude, and high-altitude native populations) and bar-headed geese, which migrate at extreme altitudes.
Slide 2
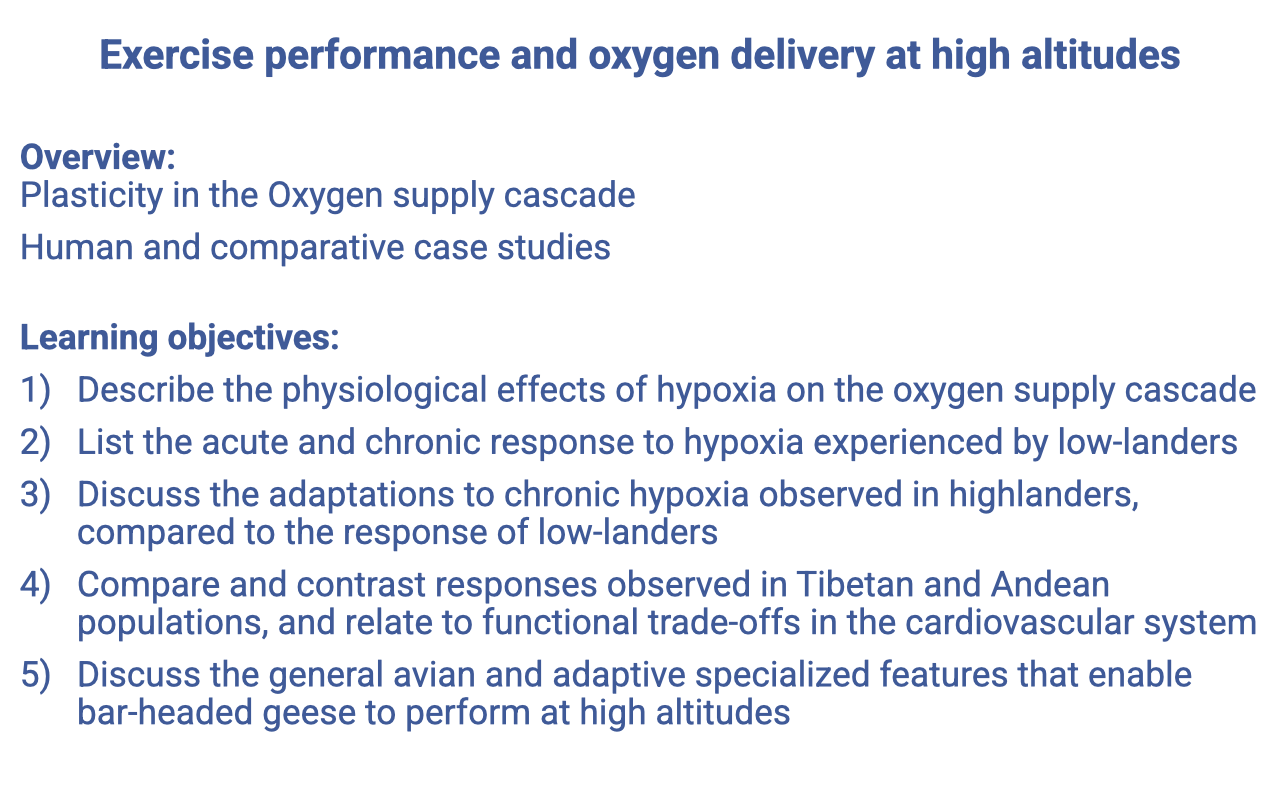
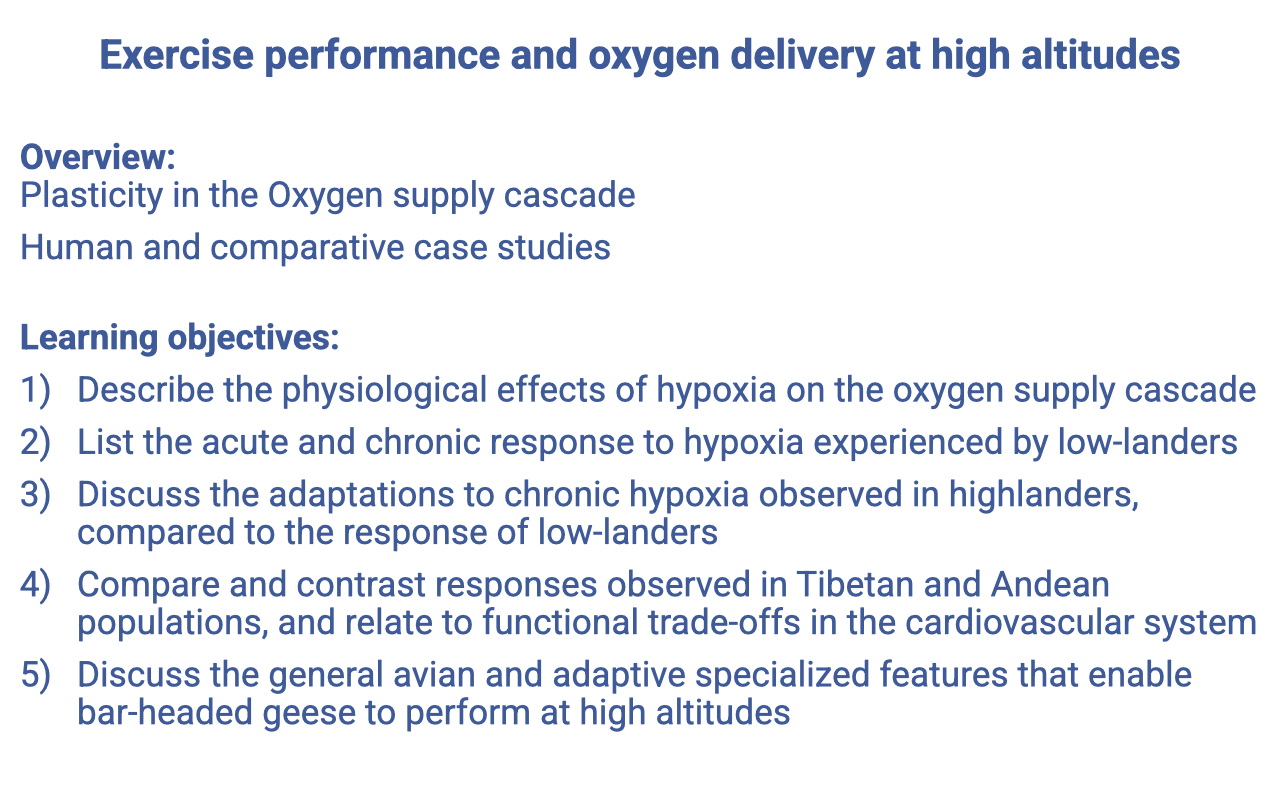
Overview and Learning Objectives
Overview:
- Plasticity in the oxygen supply cascade
- Human and comparative case studies
Learning objectives:
- Describe the physiological effects of hypoxia on the oxygen supply cascade.
- List the acute and chronic responses to hypoxia experienced by lowlanders.
- Discuss the adaptations to chronic hypoxia observed in highlanders, compared to lowlanders.
- Compare and contrast responses observed in Tibetan and Andean populations and relate them to functional trade-offs in the cardiovascular system.
- Discuss the general avian and adaptive specialized features that enable bar-headed geese to perform at high altitudes.
Slide 3
Review: The Oxygen Supply Cascade
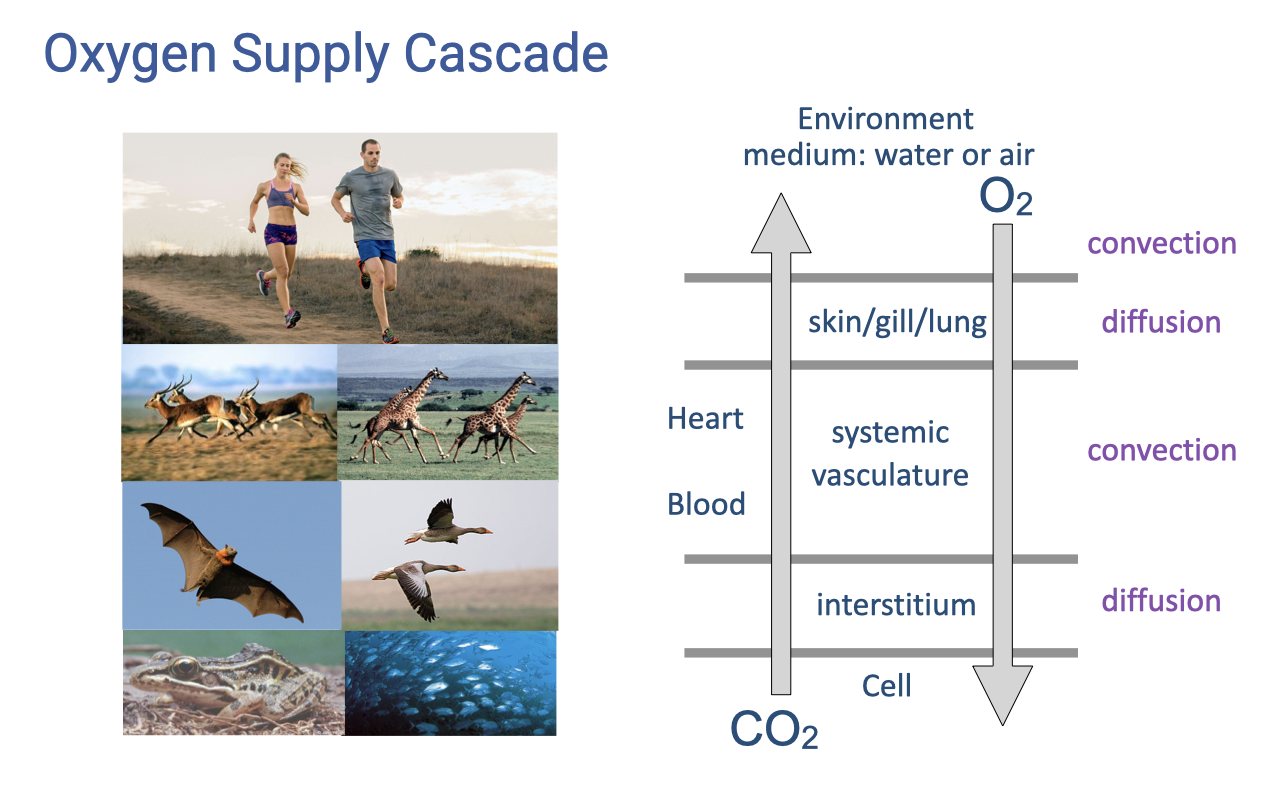
- The oxygen supply cascade describes the sequential steps that transport O2 from the environmental medium to mitochondria in the cell.
- Convective and diffusive steps alternate: ventilation (convection) → alveolar gas exchange (diffusion) → blood gas transport (convection) → systemic gas exchange (diffusion).
- This cascade is the framework for understanding how plasticity at each step contributes to (or limits) hypoxia tolerance.
Slide 4
Two Case Studies in Extreme Hypoxia
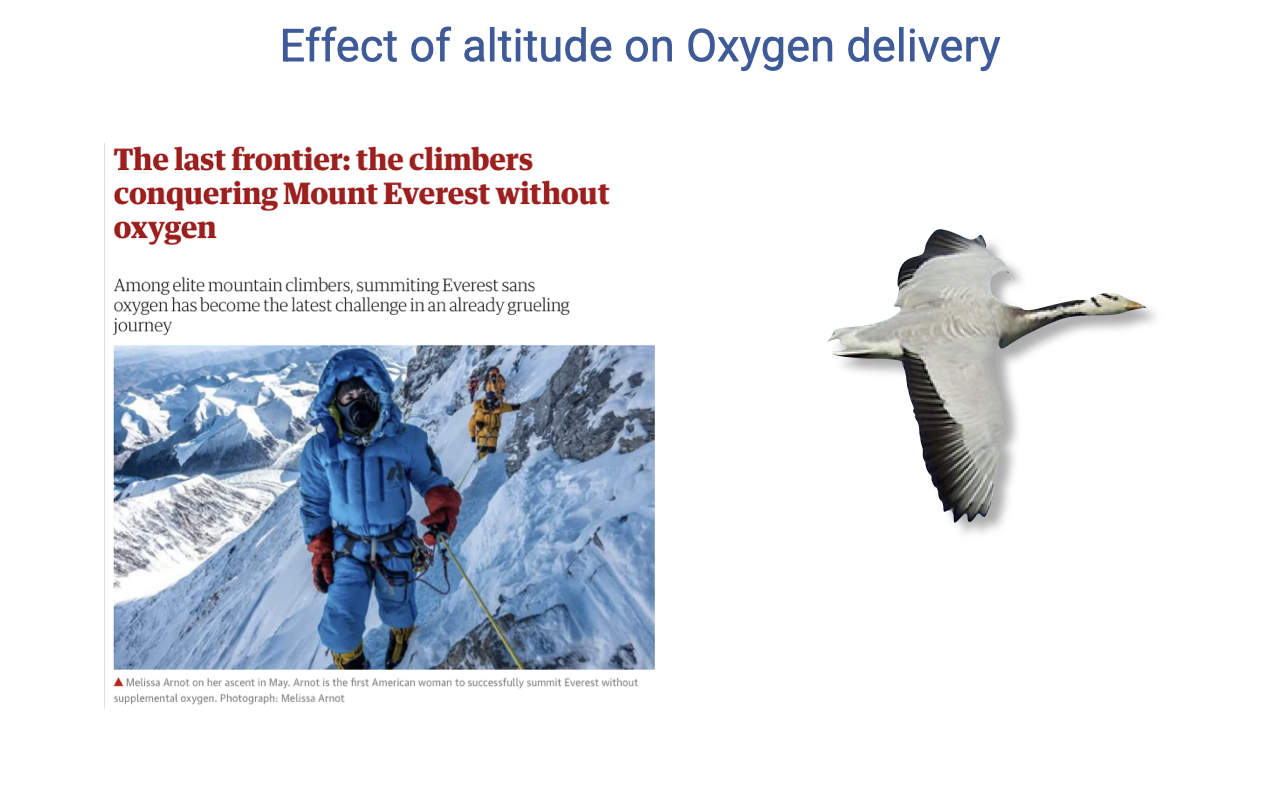
- The lecture sets up two extreme case studies of exercise in hypoxia:
- Human mountaineers summiting Mt. Everest without supplemental O2 — among the most extreme feats of human physiology.
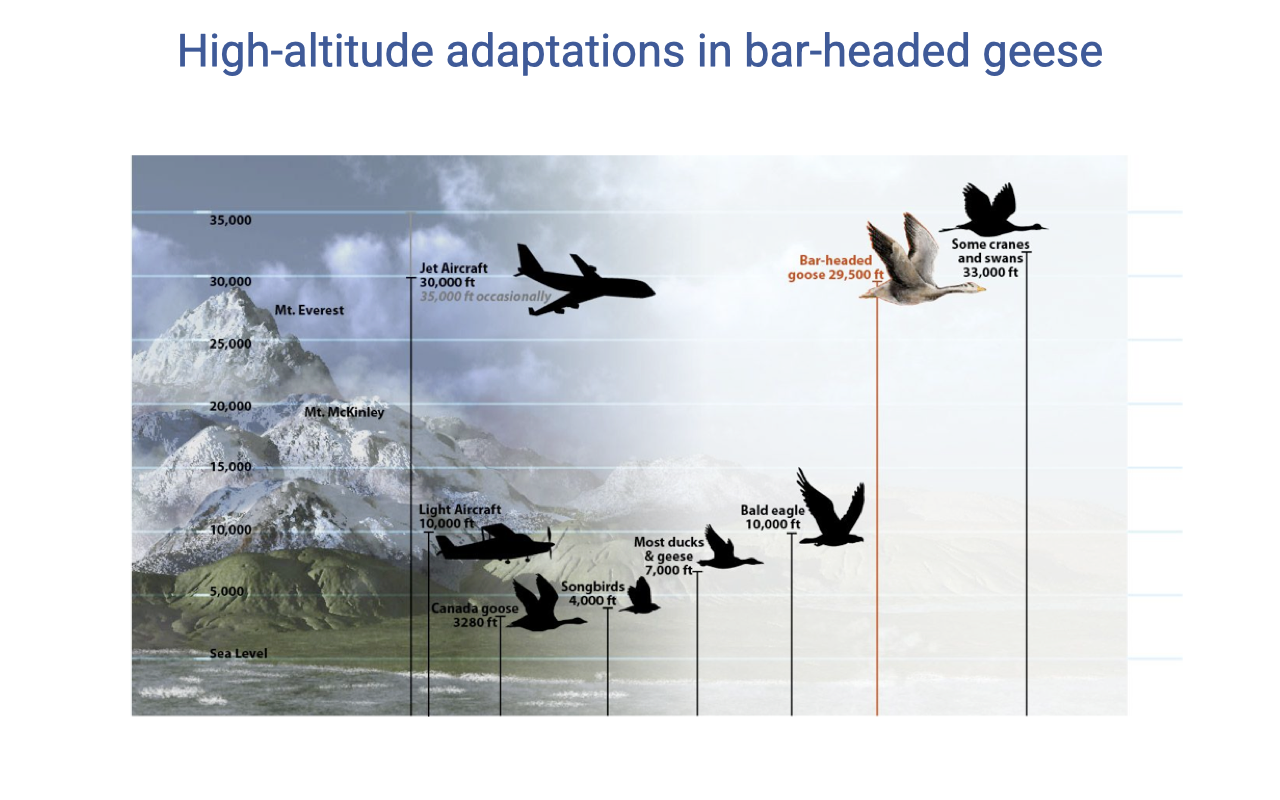
- Bar-headed geese, which fly at altitudes comparable to jet aircraft during migration over the Himalayas.
- Both push the limits of oxygen delivery and reveal where the cascade is most plastic — and where it is most limiting.
Slide 5
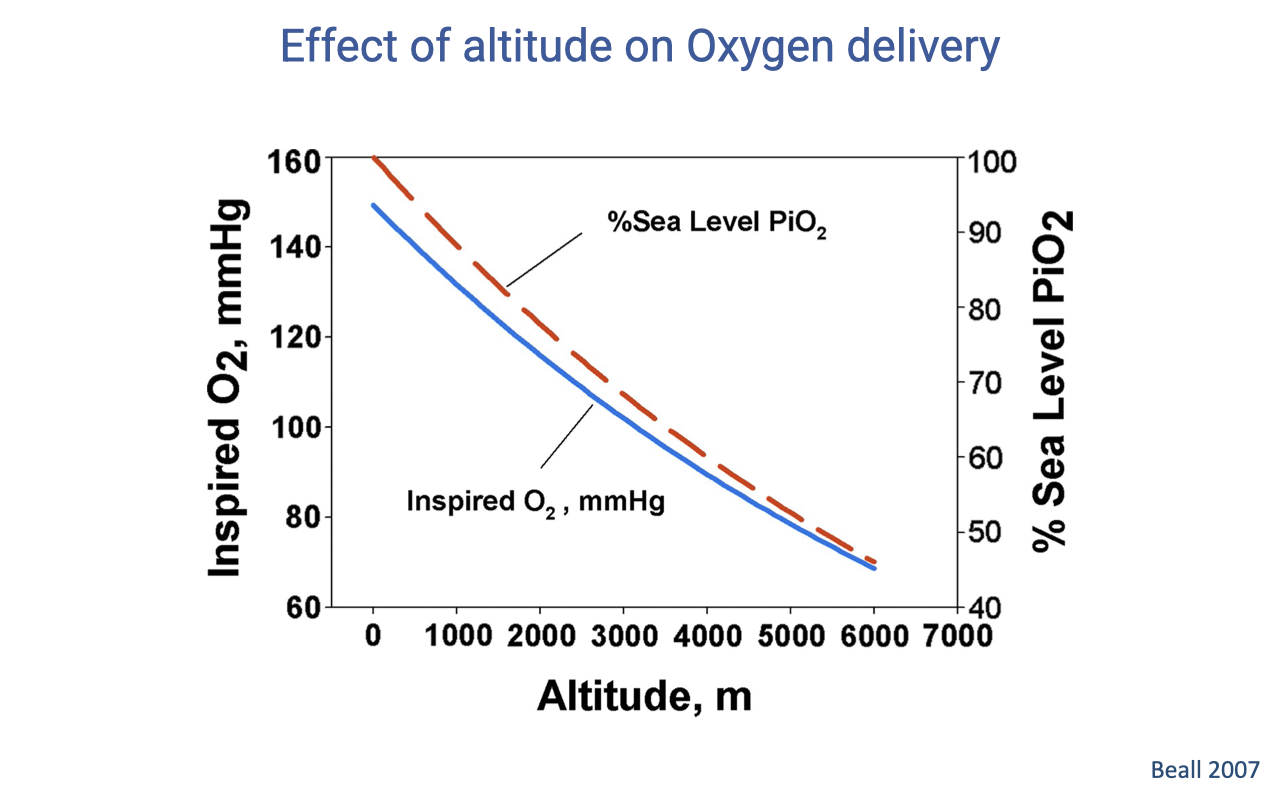
How Inspired PO₂ Falls With Altitude
- Inspired PO₂ decreases curvilinearly with altitude as barometric pressure drops.
- At sea level, inspired PO₂ ≈ 159 mmHg (100% reference); by ~6000 m it has fallen to roughly half of sea-level values.
- This is the upstream driver of every downstream change in the oxygen supply cascade at altitude.
Slide 6
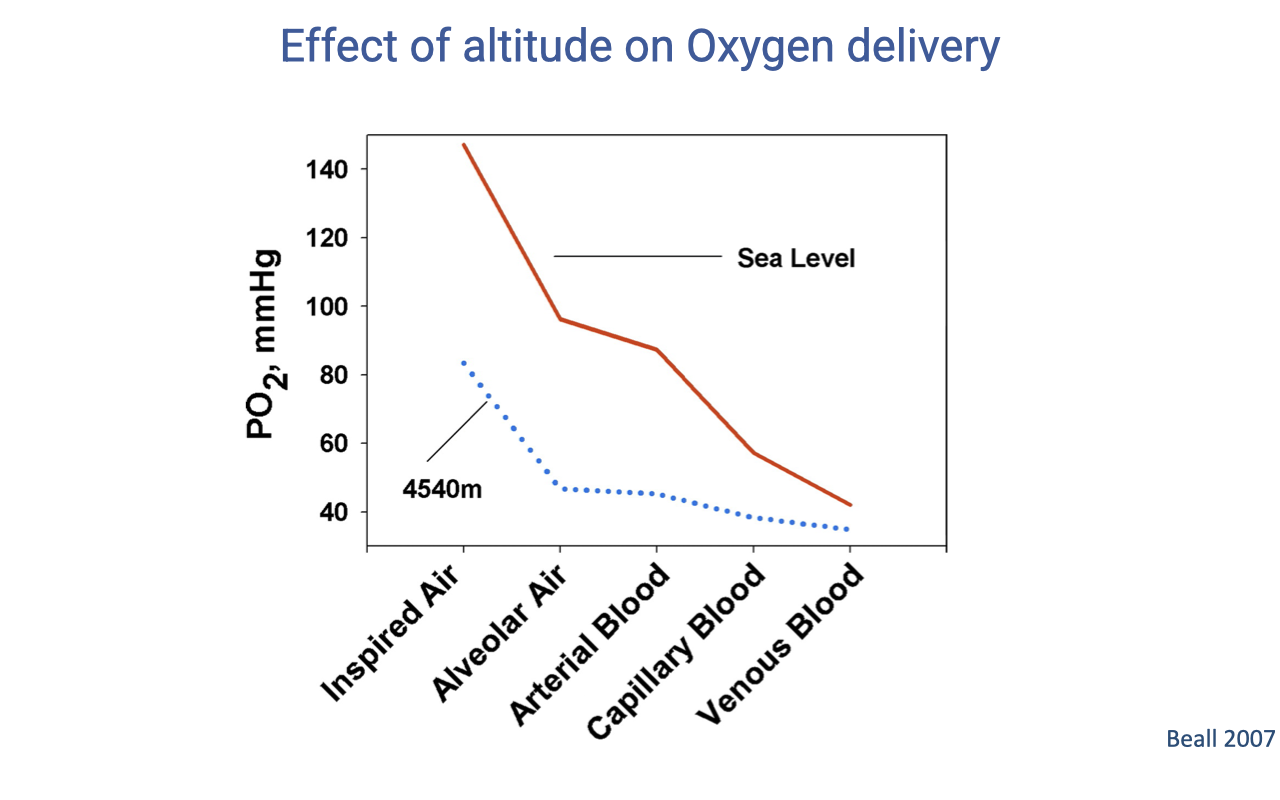
The Oxygen Cascade at Sea Level vs. Altitude
- The stepwise drops in PO₂ from inspired air → alveolar air → arterial blood → capillary blood → venous blood occur at both sea level and altitude.
- At 4540 m the entire cascade is shifted downward because inspired PO₂ starts low.
- The relative drops at each step are smaller at altitude (the curves converge), reflecting compensatory responses such as hyperventilation that partially offset the reduced inspired PO₂.
Slide 7
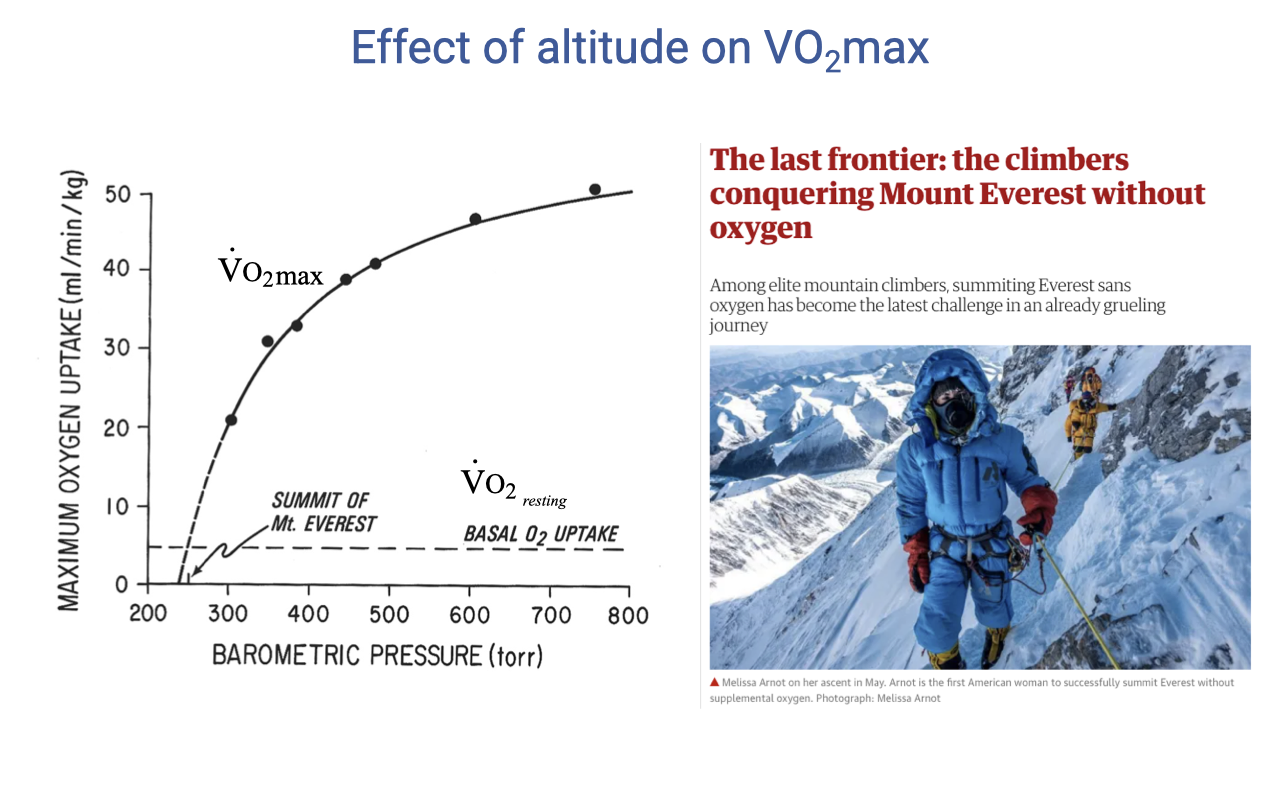
VO2max Falls With Decreasing Barometric Pressure
- VO2max declines as barometric pressure (and therefore inspired PO₂) decreases.
- At the summit of Everest, the achievable VO2max is approximately equal to basal metabolic rate — there is essentially no aerobic scope left for activity.
- Climbers who summit without supplemental O2 must move extraordinarily slowly, minimize metabolic demand, and rely on intense hyperventilation to elevate alveolar PO₂.
Slide 8
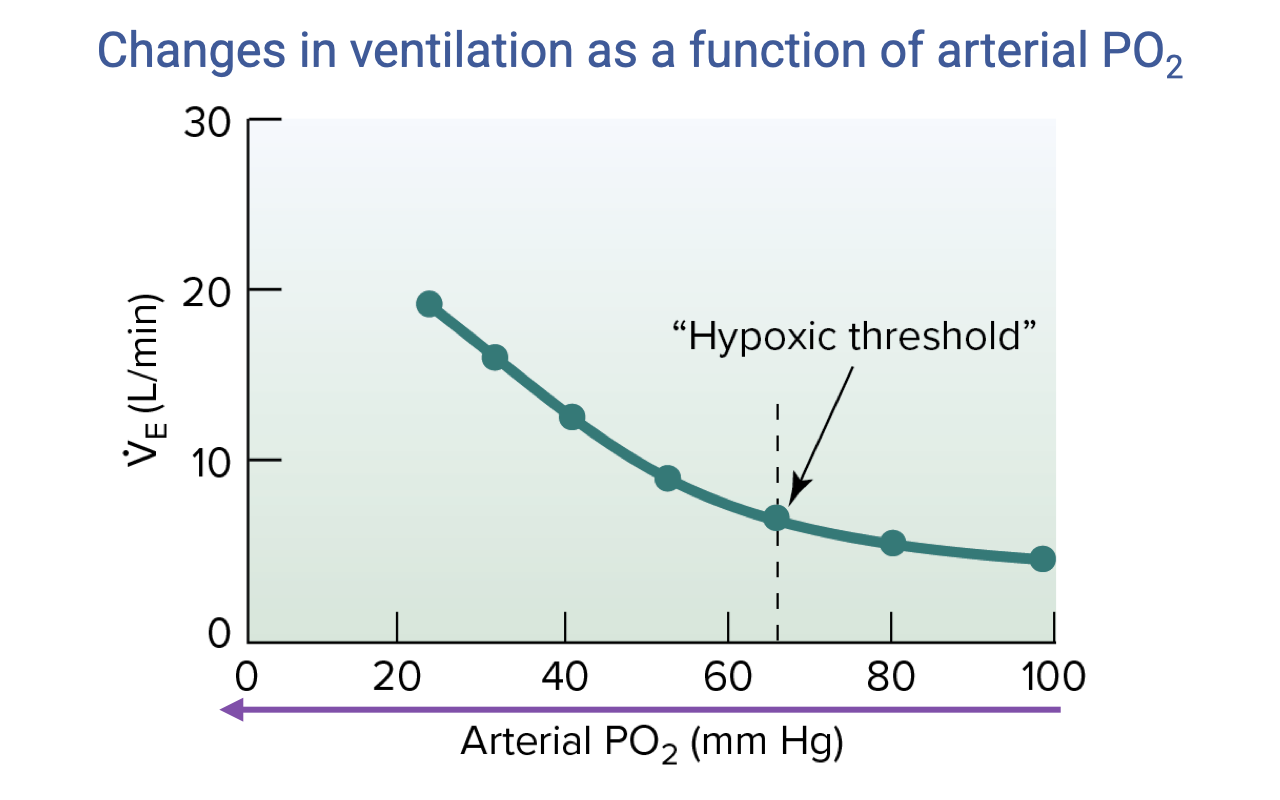
The Hypoxic Ventilatory Response (HVR)
- The hypoxic ventilatory response (HVR) is one of the most important acute responses to altitude.
- As arterial PO₂ decreases, ventilation rises gradually until a hypoxic threshold (~60 mmHg in humans) is crossed, after which V̇E increases sharply (approximately exponentially).
- Mechanism: hyperventilation raises alveolar PO₂ by lowering alveolar PCO₂, partially restoring the partial-pressure gradient for diffusion at the lung.
Slide 9
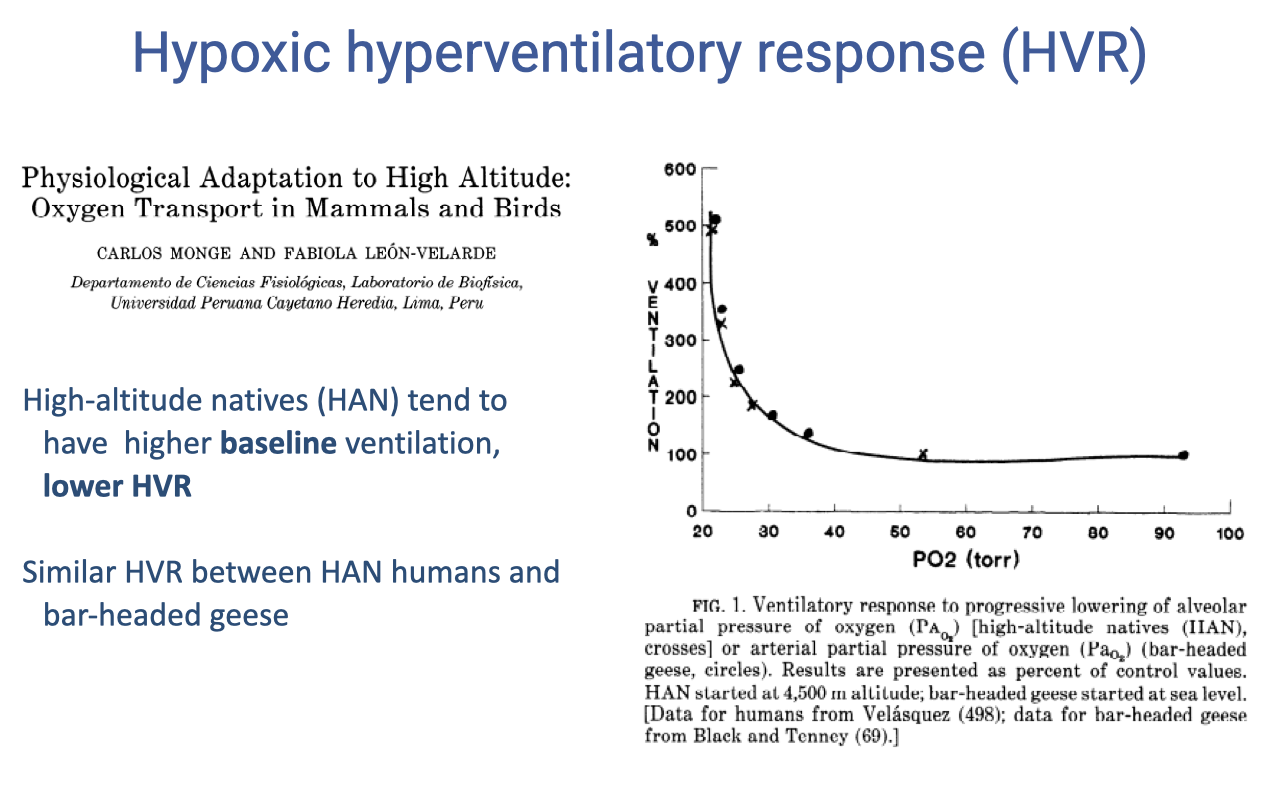
HVR Differs in High-Altitude Natives
- High-altitude natives (HAN) — humans and bar-headed geese alike — show:
- Higher baseline ventilation at normoxia.
- A less pronounced HVR as PO₂ falls (a flatter curve).
- This pattern is convergent across very divergent species (humans vs. geese), suggesting it is a general solution to chronic hypoxia.
- In contrast, lowlanders ascending to altitude show a steeper, more reactive HVR.
Slide 10
![Slide titled "Pulmonary gas exchange on the Everest summit" with a small data table comparing barometric pressure, inspired PO2, alveolar PO2, alveolar PCO2, arterial PO2, arterial PCO2, and arterial pH at the Everest summit (8848 m: 253 torr, inspired 43, alveolar PO2 35, alveolar PCO2 28, arterial 7.5, pH >7.7) versus sea level (760 torr, inspired 149, alveolar PO2 100, alveolar PCO2 95, arterial 40, pH 7.40). Below the table is a bullet list of "Responses to high altitude (in low-landers)": hyperventilation (HVR), increased cardiac output, increased red blood cell concentration ([RBC]/[Hb]), systemic circulatory vasodilation, hypoxic pulmonary vasoconstriction → pulmonary edema, mitochondrial density declines with acclimatization.](/E183_ExercisePhysiology/week04/images/lec09/slide-010.png)
Gas Exchange on the Everest Summit + Acute Lowlander Responses
- On the summit, profound hyperventilation drives alveolar PCO₂ down to ~7.5 mmHg (vs. 40 mmHg at sea level), pushing arterial pH above 7.7 (severe respiratory alkalosis).
- This is necessary because alveolar PO₂ on the summit (~35 mmHg) would otherwise be lower than typical mixed venous PO₂ at sea level (~40 mmHg) — the diffusion gradient for O2 uptake at the lung would collapse.
- Acute responses in lowlanders going to altitude:
- Hyperventilation (HVR)
- Increased cardiac output
- Increased red blood cell concentration ([RBC]/[Hb]) — released from spleen acutely, then erythropoiesis
- Systemic vasodilation in muscle capillary beds
- Hypoxic pulmonary vasoconstriction — normally matches perfusion to ventilation, but at altitude raises pulmonary pressure and can drive pulmonary edema (a feature of altitude sickness)
- Over weeks, mitochondrial density declines as oxygen demand falls
Slide 11
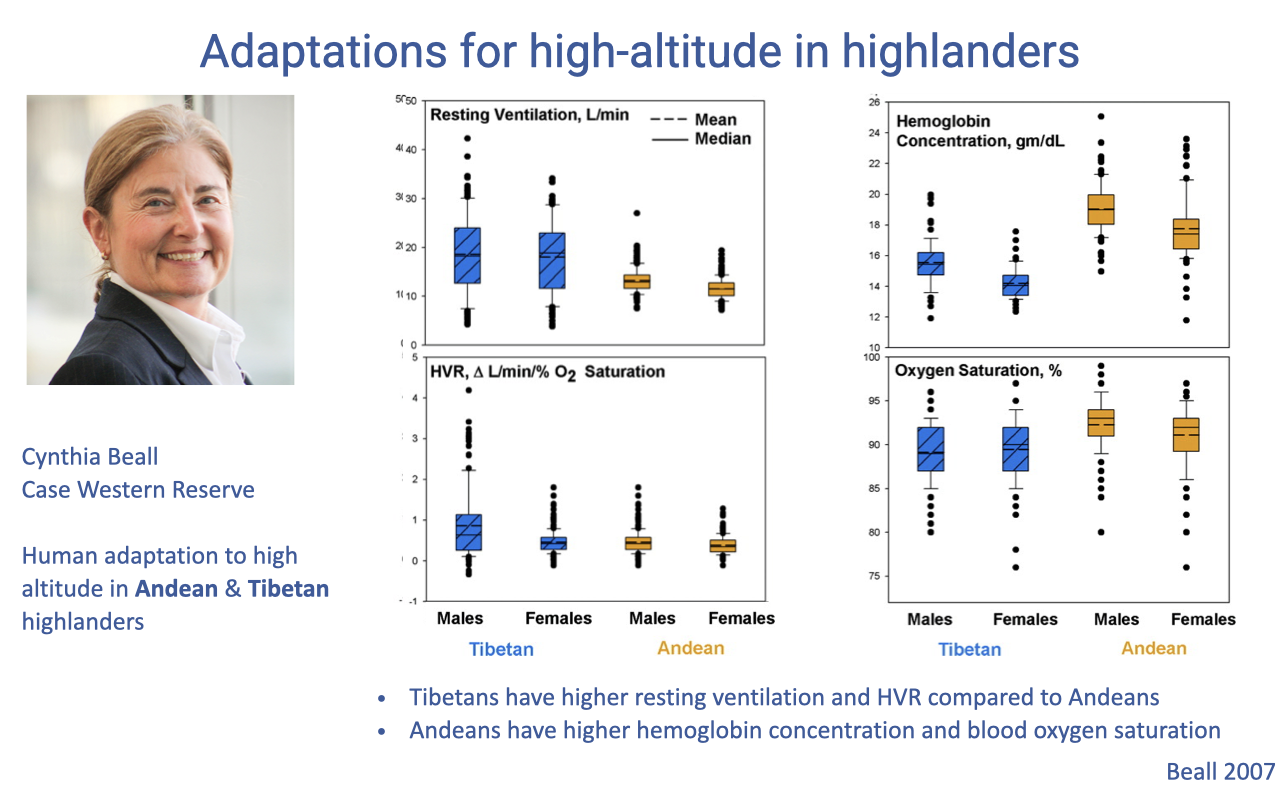
Two Independent Human Adaptations: Tibetan vs. Andean
- Cynthia Beall’s work compared two independently evolved high-altitude human populations: Tibetan and Andean highlanders.
- Tibetans:
- Higher resting ventilation
- Higher HVR
- Lower [Hb] and lower arterial O2 saturation
- Andeans:
- Higher hemoglobin concentration ([Hb])
- Higher arterial O2 saturation
- Lower ventilation rates
- Both populations remain somewhat chronically hypoxemic (saturation noticeably below 100%) compared with lowlanders at sea level.
Slide 12
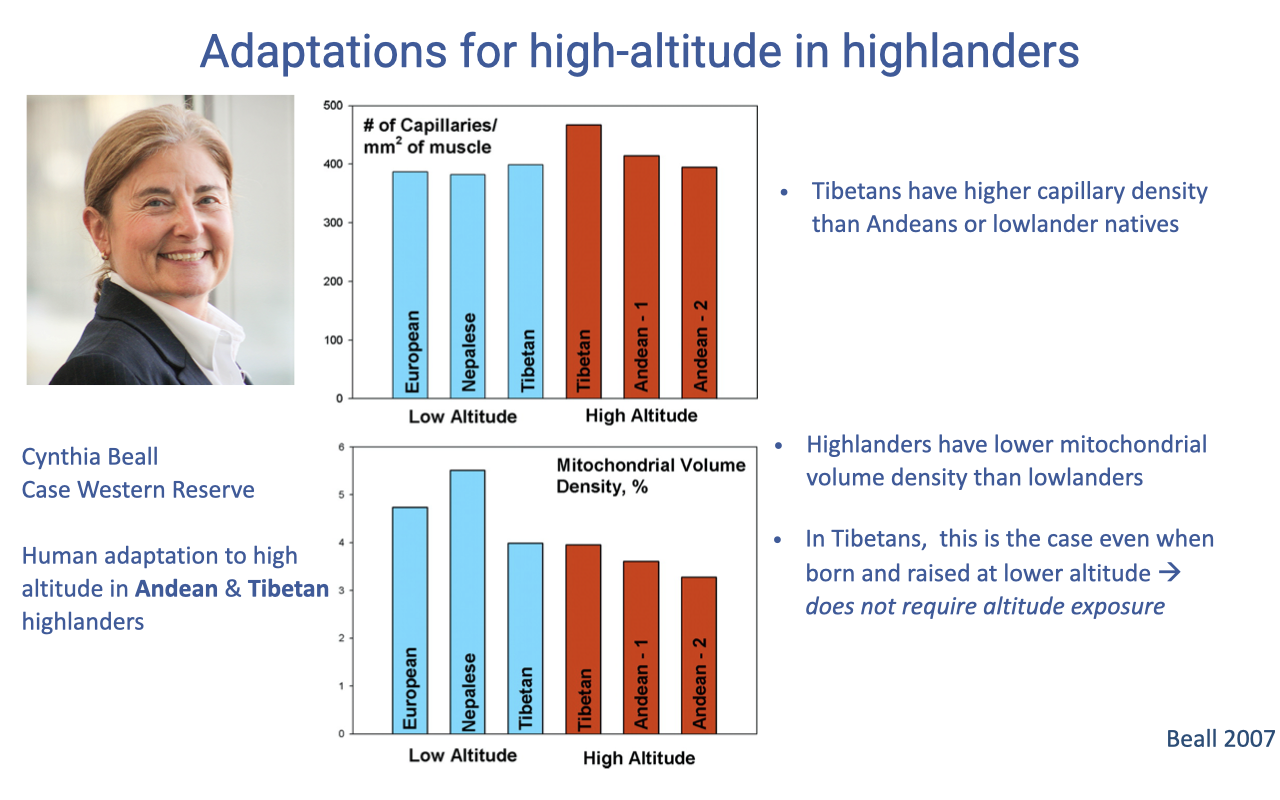
Capillary Density and Mitochondrial Volume
- Tibetan highlanders have higher capillary density in skeletal muscle than Andeans or lowland natives — improving the systemic gas exchange step of the cascade.
- Highlanders generally show lower mitochondrial volume density than lowlanders, reflecting a chronic match between mitochondrial supply and reduced O2 availability.
- In Tibetans, low mitochondrial volume density persists even when individuals are born and raised at low altitude, suggesting a genetic basis rather than developmental plasticity.
- General rule: after ~6 weeks of altitude exposure, mitochondrial density begins to decrease in any individual.
Slide 13
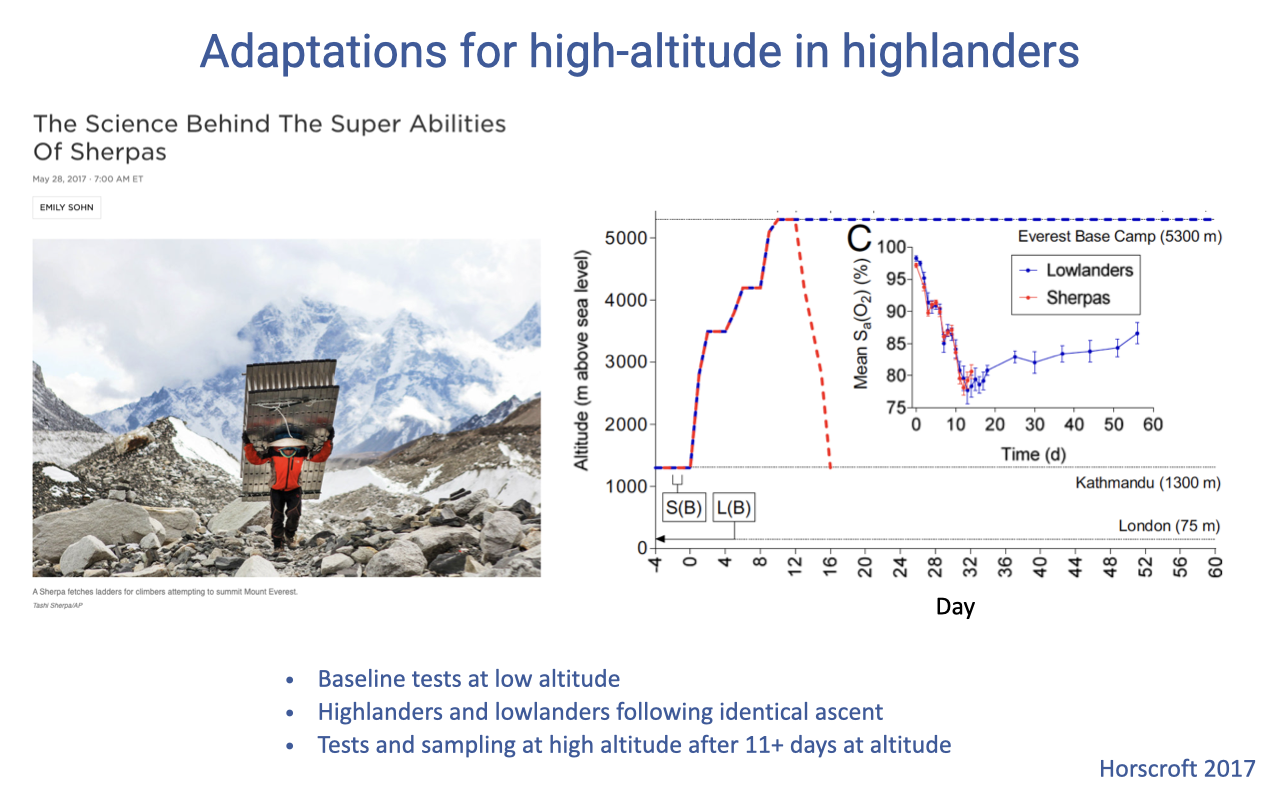
Sherpa vs. Lowlander Field Study Design
- A controlled comparison followed Sherpa and lowland controls along an identical ascent profile to Everest base camp (~5300 m).
- Measurements were made at sea level (baseline), during ascent, and after 11+ days at high altitude.
- This design allowed researchers to attribute differences to chronic adaptation in Sherpa rather than to different exposures.
Slide 14
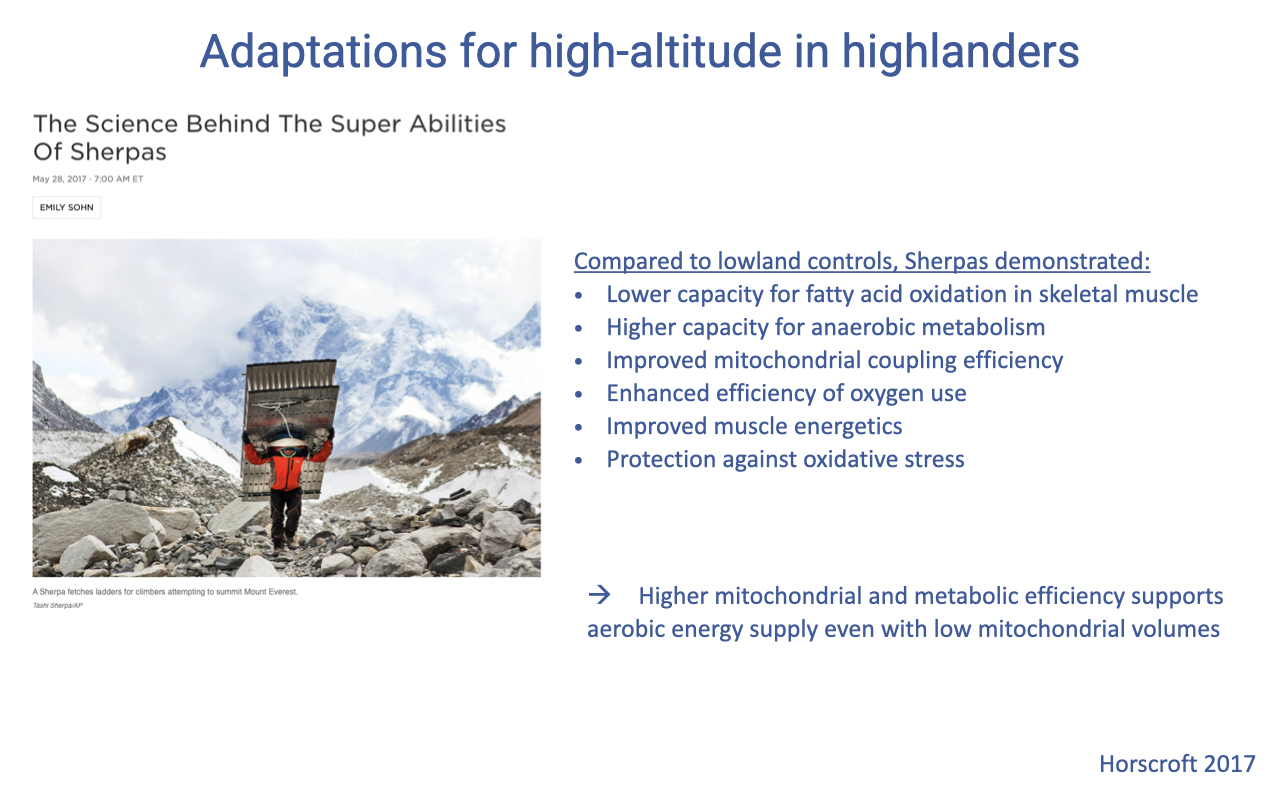
Sherpa Metabolic Adaptations
- Compared to lowland controls, Sherpas showed:
- Lower fatty acid oxidation capacity in skeletal muscle
- Higher anaerobic capacity — buffers acute hypoxic episodes
- Improved mitochondrial coupling efficiency — more ATP per O2 consumed (less wasted energy)
- Enhanced efficiency of O2 use
- Improved muscle energetics — less heat waste in mechanical work
- Protection against oxidative stress
- Key takeaway: Sherpas achieve adequate aerobic energy supply with lower mitochondrial volume by being more efficient per mitochondrion.
Slide 15
![Summary slide titled "Adaptations for high-altitude in highlanders" with two sections. Top: "Responses to high altitude (in low-landers)" listing hyperventilation, increased red blood cell concentration, systemic circulatory vasodilation, hypoxic pulmonary vasoconstriction → high altitude pulmonary edema, mitochondrial density decline with acclimatization. Bottom: "In Highlanders" listing Tibetans (lower [RBC]/[Hb] response, high HVR), Andeans (higher [RBC]/[Hb], low HVR), and the trade-off between cardiac output Q and [RBC] because of increased viscosity. Common features in highlanders: decreased hypoxic pulmonary vasoconstriction, increased tissue capillary density, lower mitochondrial density, metabolic changes (increased anaerobic glycolysis, more efficient mitochondria).](/E183_ExercisePhysiology/week04/images/lec09/slide-015.png)
Lowlander Responses vs. Highlander Adaptations — Summary
- Lowlanders ascending to altitude: HVR, ↑ cardiac output, ↑ [Hb], systemic vasodilation, hypoxic pulmonary vasoconstriction (with edema risk), ↓ mitochondrial density over weeks.
- Highlander populations show divergent solutions:
- Tibetans: lower [RBC]/[Hb], higher HVR
- Andeans: higher [RBC]/[Hb], lower HVR
- These two solutions reflect a trade-off: increasing both cardiac output and [Hb] simultaneously raises blood viscosity and the work of pumping, limiting cardiac output.
- Common highlander features:
- Decreased hypoxic pulmonary vasoconstriction (lower edema risk)
- Increased tissue capillary density
- Lower mitochondrial density
- Metabolic shift: more anaerobic glycolysis, more efficient mitochondria
- Timescales matter: ventilatory responses are fast; mitochondrial changes take weeks.
Slide 16
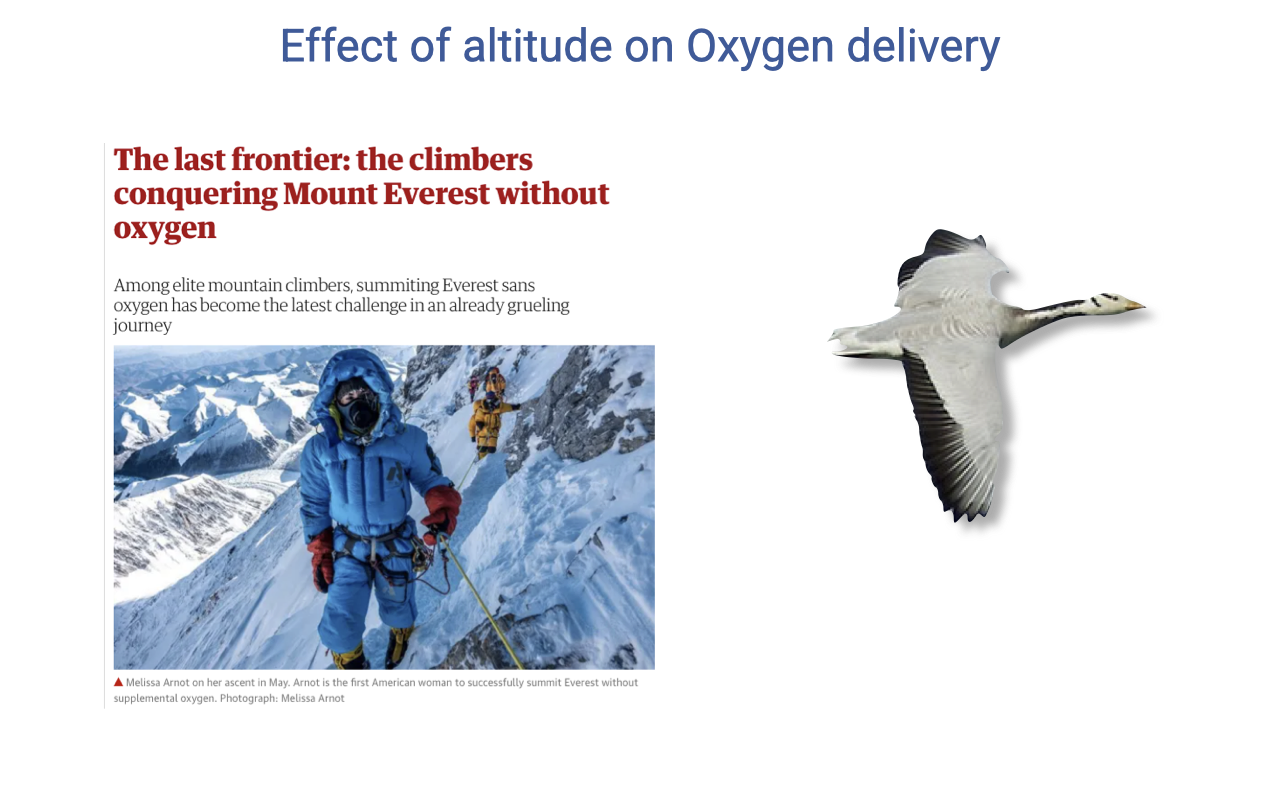
Transition: From Humans to Bar-Headed Geese
- The lecture transitions from the human case studies to the second case study: bar-headed geese, which exemplify extreme exercise performance at high altitude in a non-human vertebrate.
Slide 17
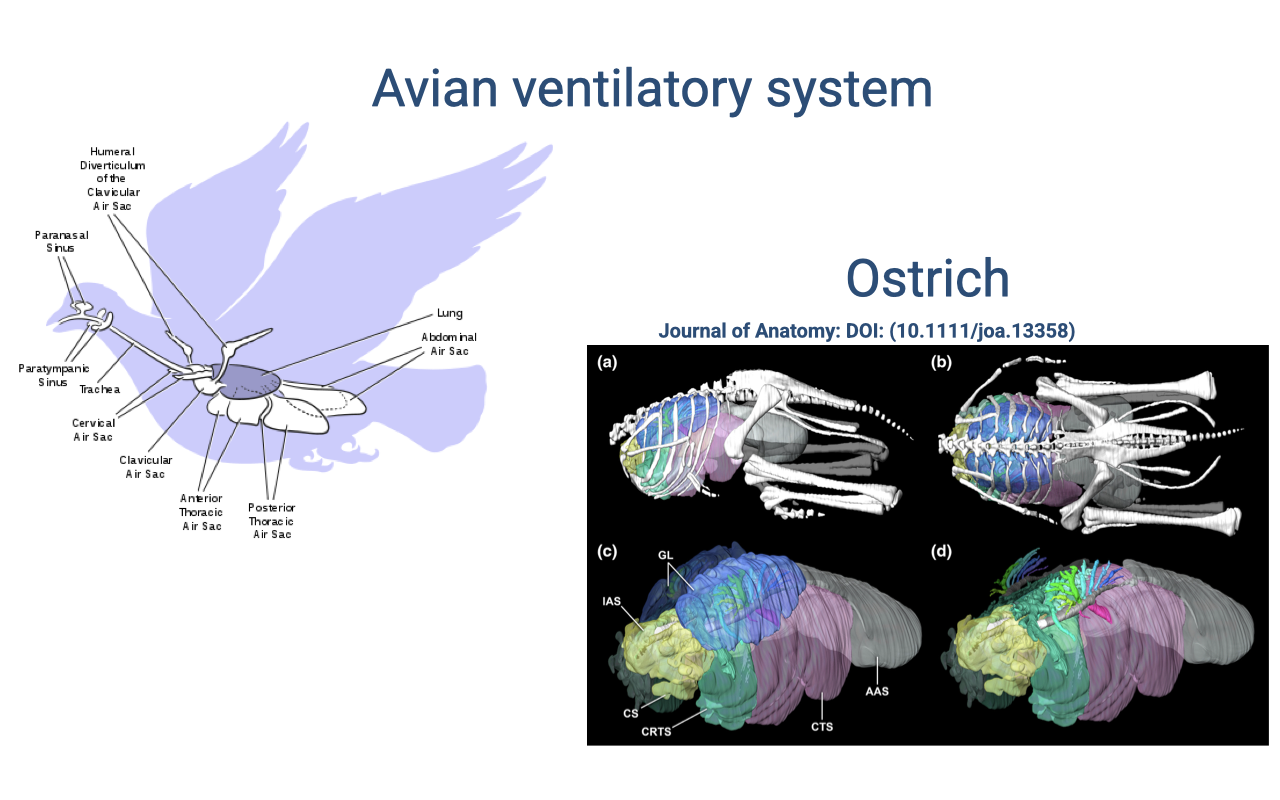
Review: The Avian Ventilatory System
- Birds use an air sac system with unidirectional airflow through rigid lungs — fundamentally different from mammalian tidal ventilation.
- Because lungs are physically separate from the bellows function (the air sacs do the volume changes), the lung tissue does not need to stretch — it can have a thin blood-gas barrier and a large surface area.
- Gas exchange occurs by cross-current flow between air capillaries and blood capillaries — more efficient than mammalian tidal-pool exchange.
Slide 18
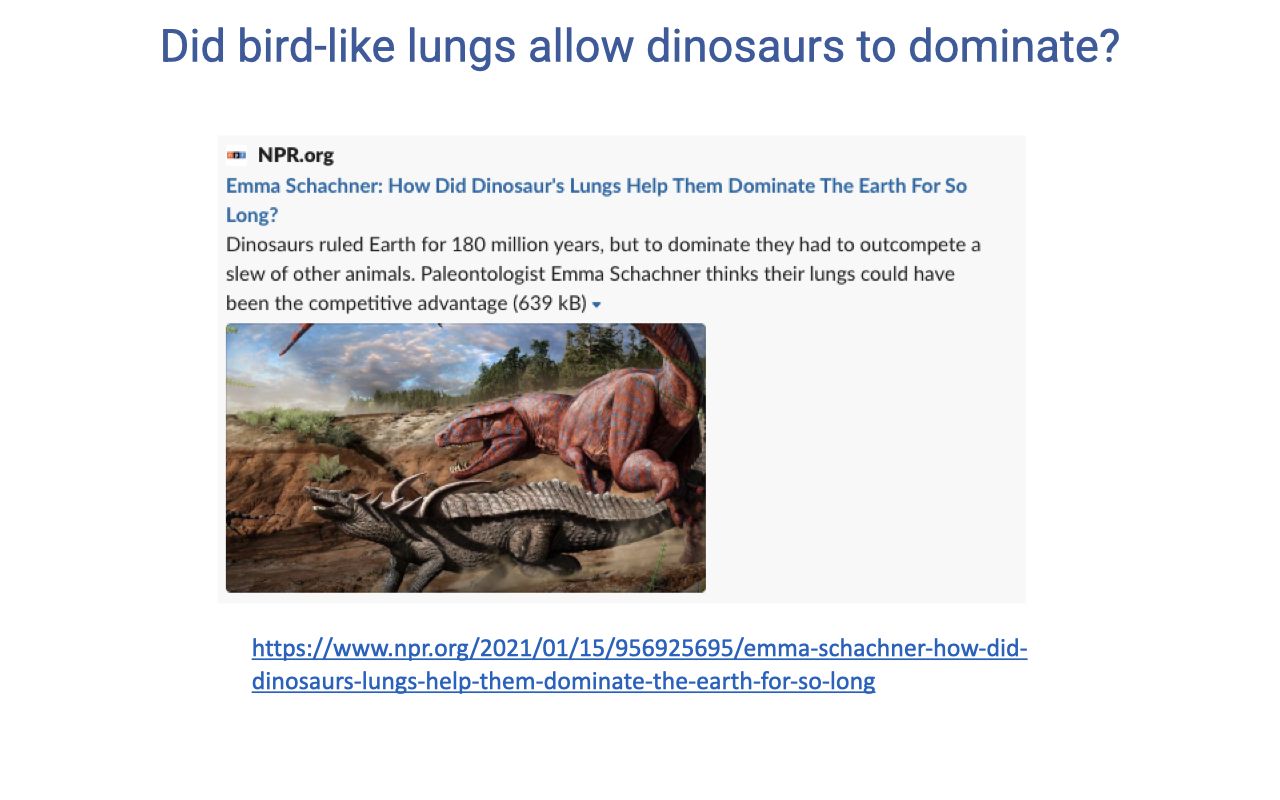
Bird-Like Lungs Are an Inherited Trait
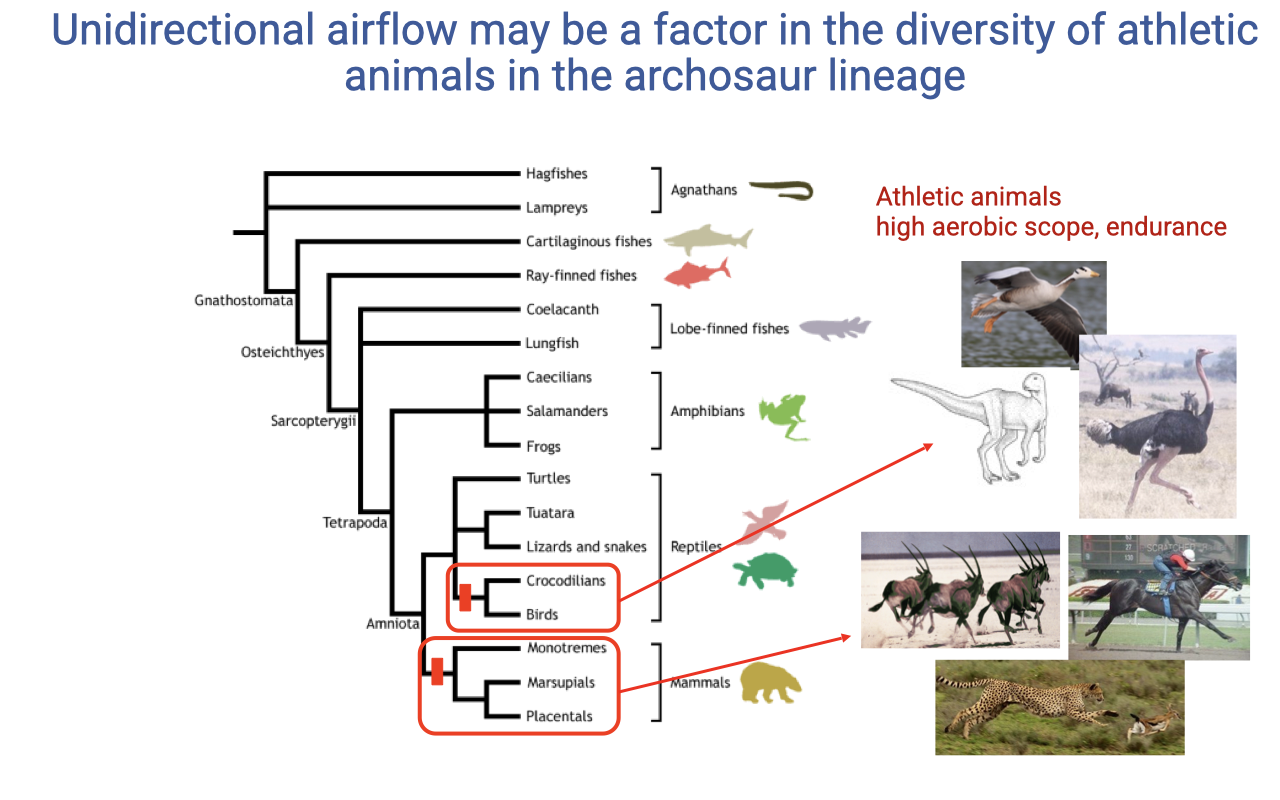
- The efficient avian lung architecture is not a unique evolutionary novelty of flight — it was inherited from dinosaur ancestors.
- This inheritance may have given the dinosaur lineage a long-standing competitive advantage in oxygen delivery and aerobic capacity.
Slide 19
Archosaur Aerobic Diversity
- Within vertebrates, the archosaur lineage (crocodilians, dinosaurs, birds) is enriched for animals with high aerobic scope and endurance.
- The shared lung architecture may be one factor enabling this evolutionary diversification of athletic species.
- Mammals have independently evolved high aerobic capacity, but they did so with a less efficient ventilatory architecture (tidal flow, alveolar pool).
Slide 20
Bar-Headed Geese Fly at Jet-Aircraft Altitudes
- Bar-headed geese fly at altitudes near 29,500 ft (~9000 m) during migration — comparable to commercial jet aircraft and higher than the summit of Everest.
- Most ducks and geese stay below ~7000 ft; the bar-headed goose is an outlier in the avian world.
- A few cranes and swans fly even higher (~33,000 ft), but bar-headed geese are the most extensively studied high-altitude flyer.
Slide 21
Bar-Headed Geese in Flight (Video)
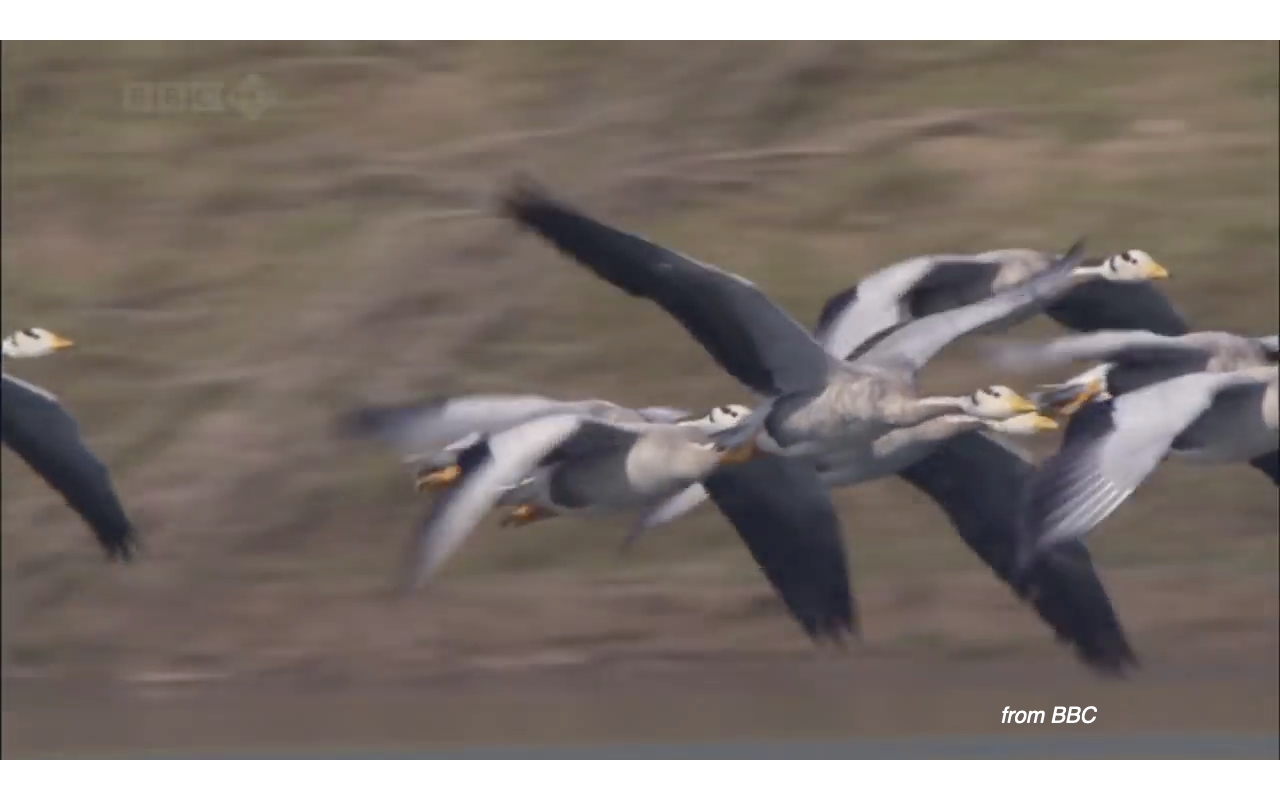
- A BBC video clip illustrates bar-headed geese in active migratory flight at high altitude.
- Notable features: very rapid wingbeats in extremely thin air, an exceptional aerobic effort.
- Unlike Everest summit climbers — who barely walk — these geese sustain very high metabolic rates during high-altitude flight.
Slide 22
Migration Route Over the Himalayas
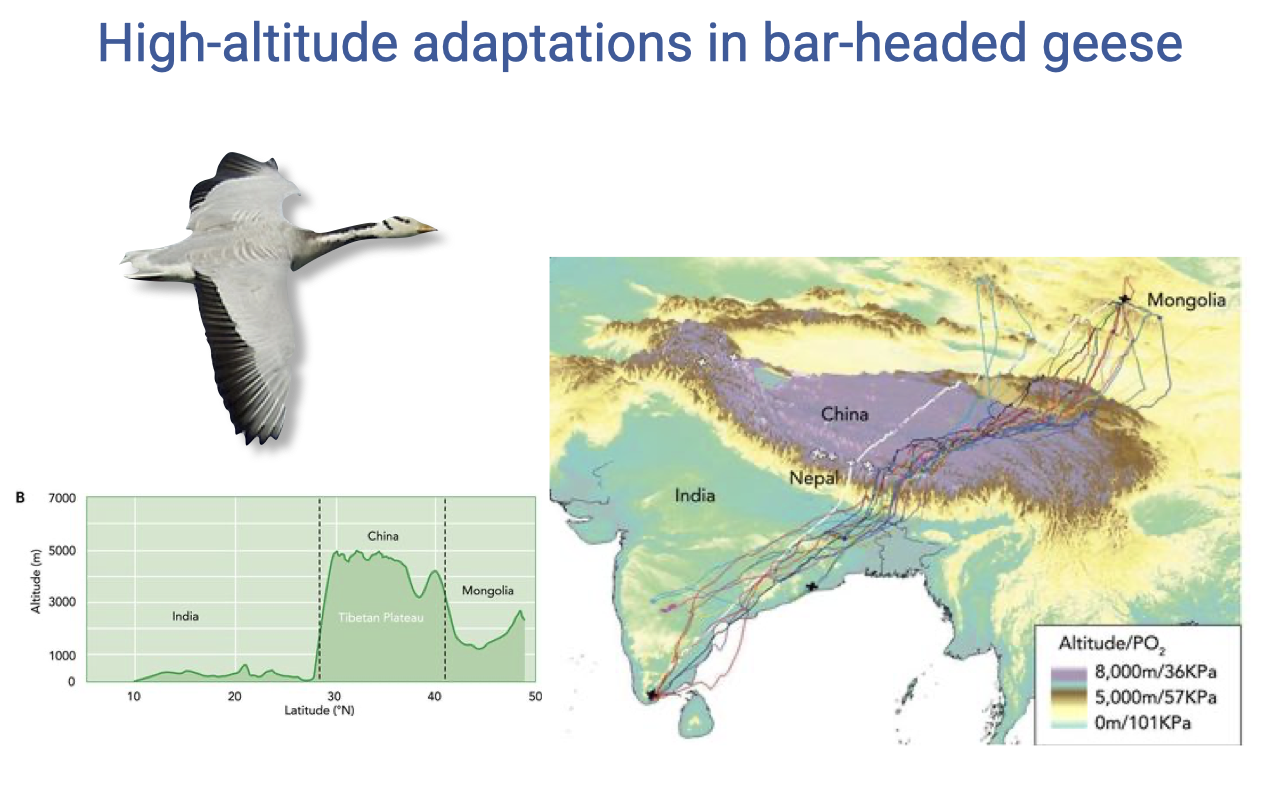
- Bar-headed geese migrate over the Tibetan Plateau between wintering grounds in India and breeding grounds in Mongolia.
- Crossing the high plateau allows a shorter route and lets them exploit tailwinds.
- Tracks color-coded by altitude show extended periods at altitudes where atmospheric PO₂ is roughly 35–60% of sea-level values.
Slide 23
Two Layers of High-Altitude Adaptation
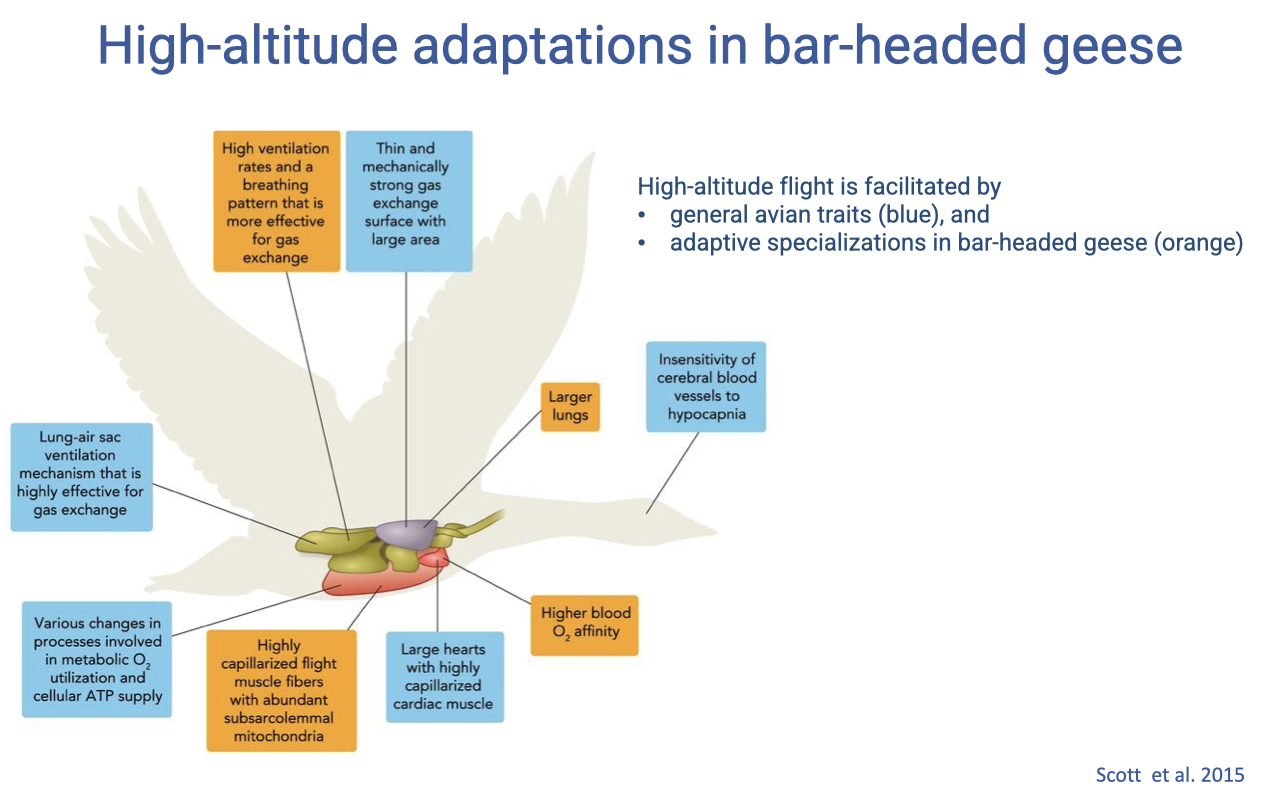
- Bar-headed goose performance results from two layers of features:
- General avian traits (shared with most birds)
- Specializations unique to (or strongly enhanced in) bar-headed geese
- These features span the entire oxygen supply cascade: ventilation, alveolar gas exchange, blood gas transport, systemic gas exchange, and mitochondrial respiration.
Slide 24
Bar-Headed Goose vs. Lowland Goose Across the Cascade
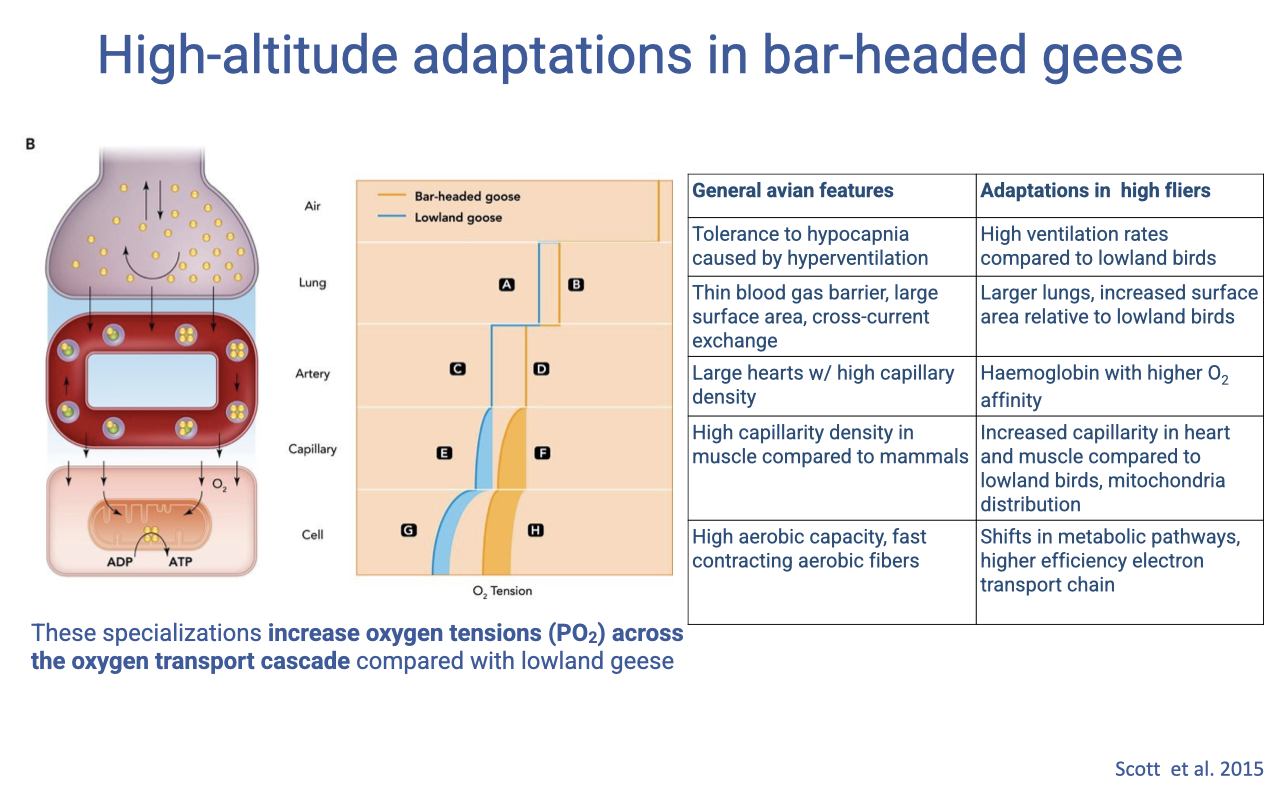
- Compared to a lowland goose, the bar-headed goose maintains higher PO₂ at every step of the oxygen supply cascade.
- General avian features include:
- Tolerance to hypocapnia caused by hyperventilation
- Thin blood-gas barrier with large surface area (cross-current exchange)
- Large hearts with high capillary density
- High capillary density in muscle (vs. mammals)
- High aerobic capacity, fast-contracting aerobic fibers
- Bar-headed goose specializations include:
- Higher ventilation rates than lowland birds
- Larger lungs and increased surface area
- Hemoglobin with higher O2 affinity
- Increased capillary density in heart and muscle
- Altered mitochondrial distribution in muscle
- Metabolic-pathway shifts and higher-efficiency electron transport
Slide 25
Leftward-Shifted Hemoglobin in Bar-Headed Geese
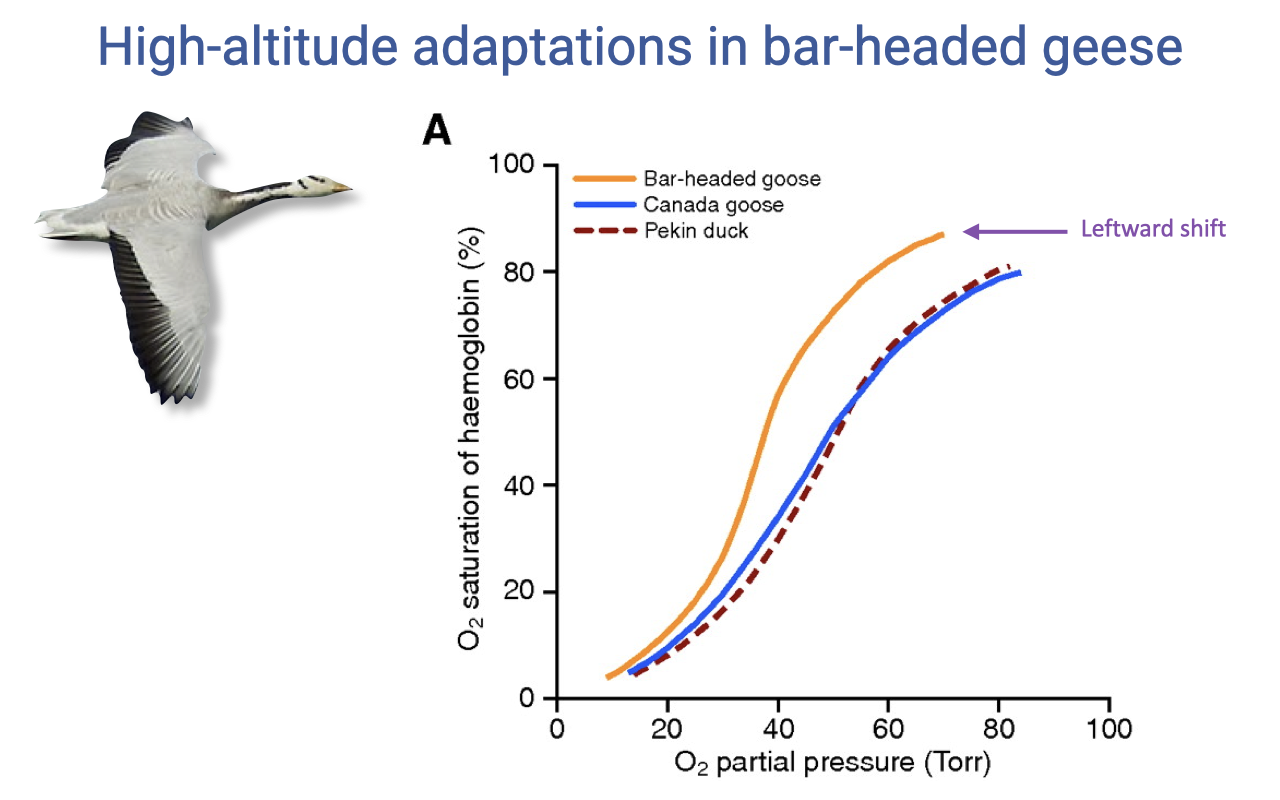
- Bar-headed goose hemoglobin has a higher oxygen affinity than lowland species (Canada goose, Pekin duck).
- The dissociation curve is leftward shifted, meaning hemoglobin reaches near-full saturation at the lower PO₂ values present in high-altitude lungs.
- Trade-off: higher affinity also means O2 is held more tightly in the periphery — but this is offset by the geese’s highly capillarized tissues, which enhance unloading.
Slide 26
Dr. Jessica Meir — Physiologist Turned Astronaut
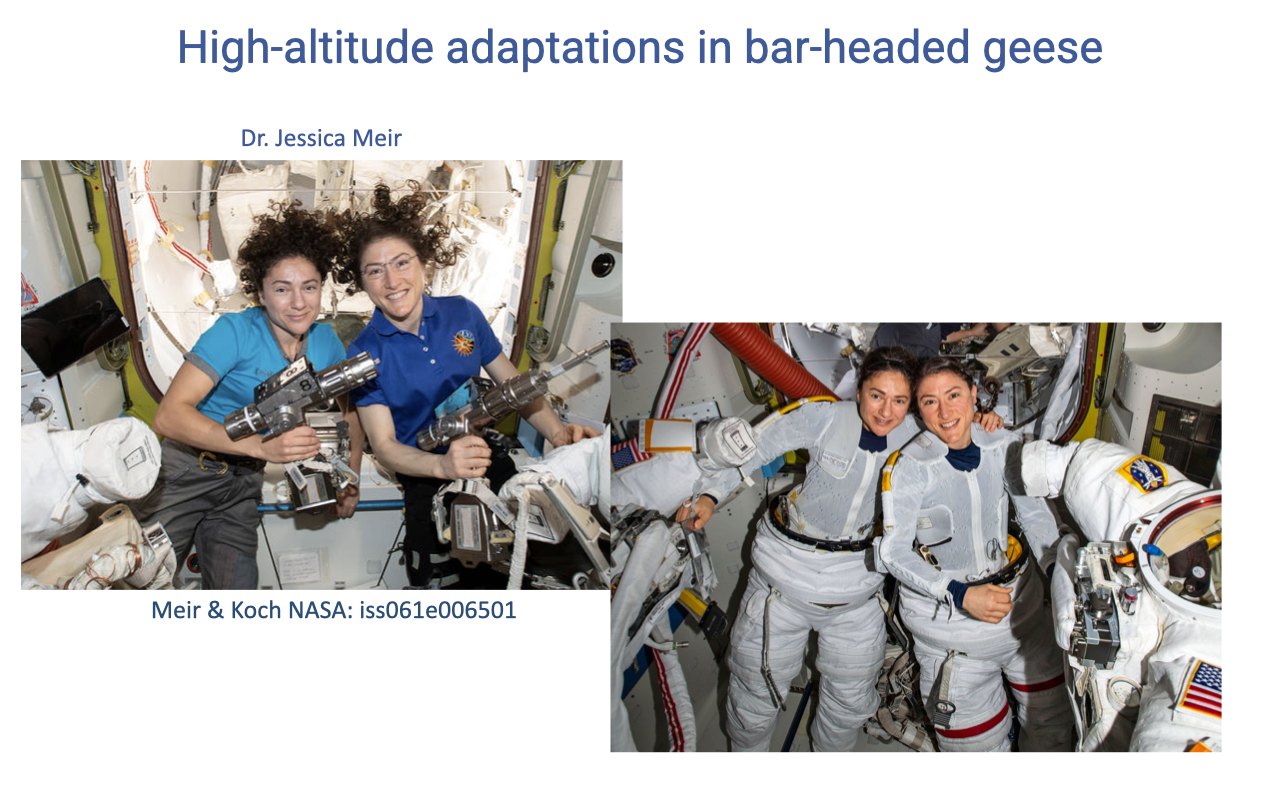
- The next several slides describe a remarkable bar-headed goose study by Dr. Jessica Meir, who later became a NASA astronaut and was part of the first all-female spacewalk.
- Before becoming an astronaut, Meir trained as a comparative physiologist and studied bar-headed goose flight in hypoxia.
Slide 27
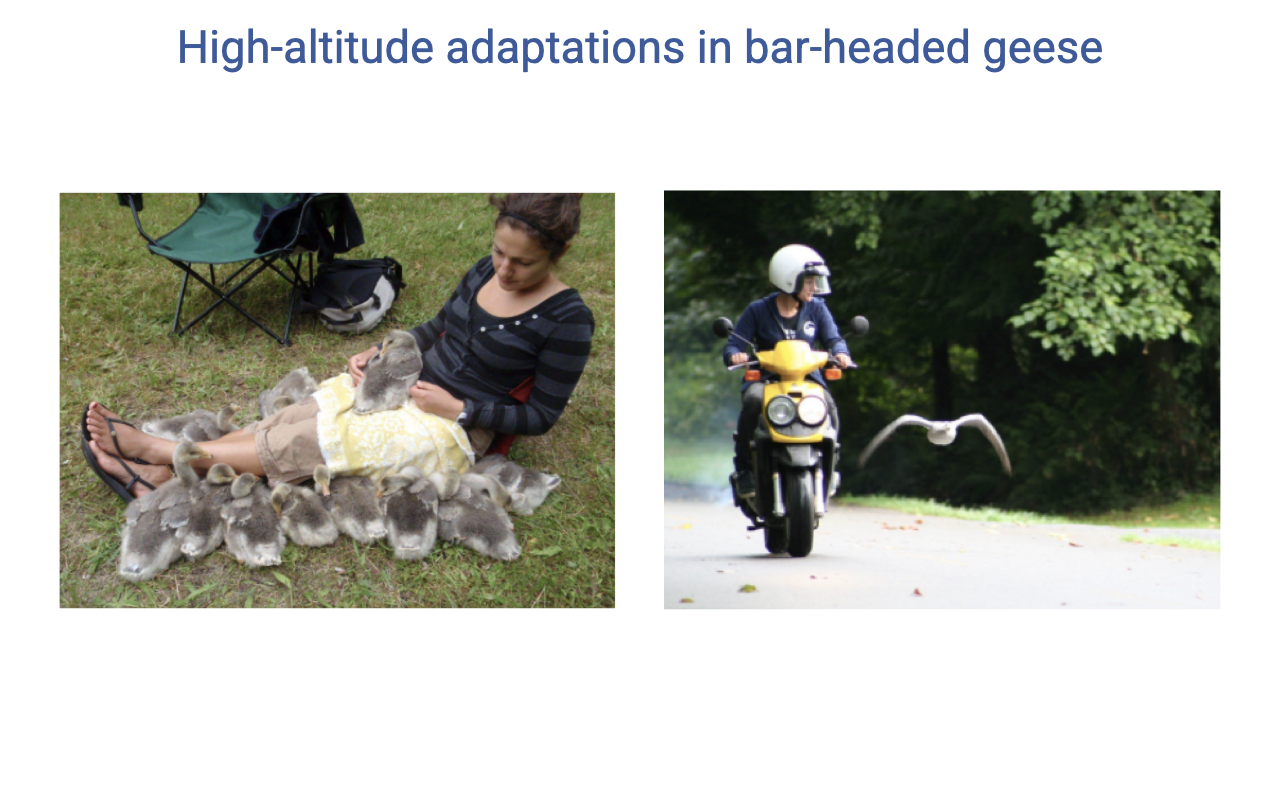
Hand-Rearing and Imprinting Bar-Headed Geese
- To study bar-headed geese in a wind tunnel, Meir had to hand-rear the birds from hatchlings so they would imprint on her.
- She then trained them to fly alongside her — including learning to fly herself — so they would also fly inside a wind tunnel under controlled conditions.
- This is an extreme example of the experimental effort sometimes required to make detailed physiological measurements on a wild species.
Slide 28
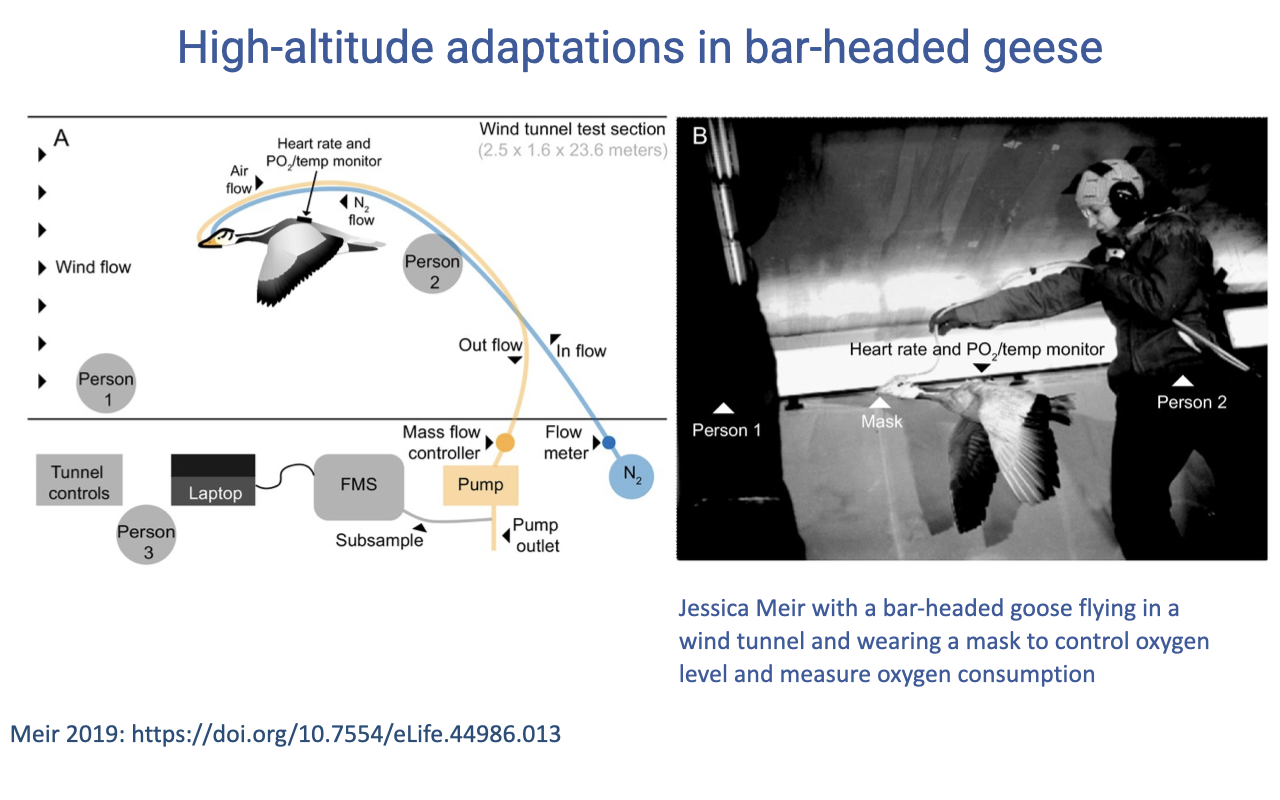
Wind Tunnel Experimental Setup
- Geese were trained to fly in a wind tunnel (a “treadmill for birds”) wearing a custom face mask.
- The mask allowed researchers to:
- Continuously measure inhaled and exhaled O2 and CO2 during flight
- Manipulate inspired O2 (set above or below ambient) to simulate different altitudes
- Heart rate and body temperature were also recorded.
- An accompanying video from Meir et al. (2019, eLife) shows bar-headed goose #32 flying in the University of British Columbia wind tunnel at 10.5% O2 (≈ 5500 m equivalent altitude). One person to the left encourages flight while a second person on the right supports the gas tubing extending outside the tunnel. Reference link: https://doi.org/10.7554/eLife.44986.013
Slide 29
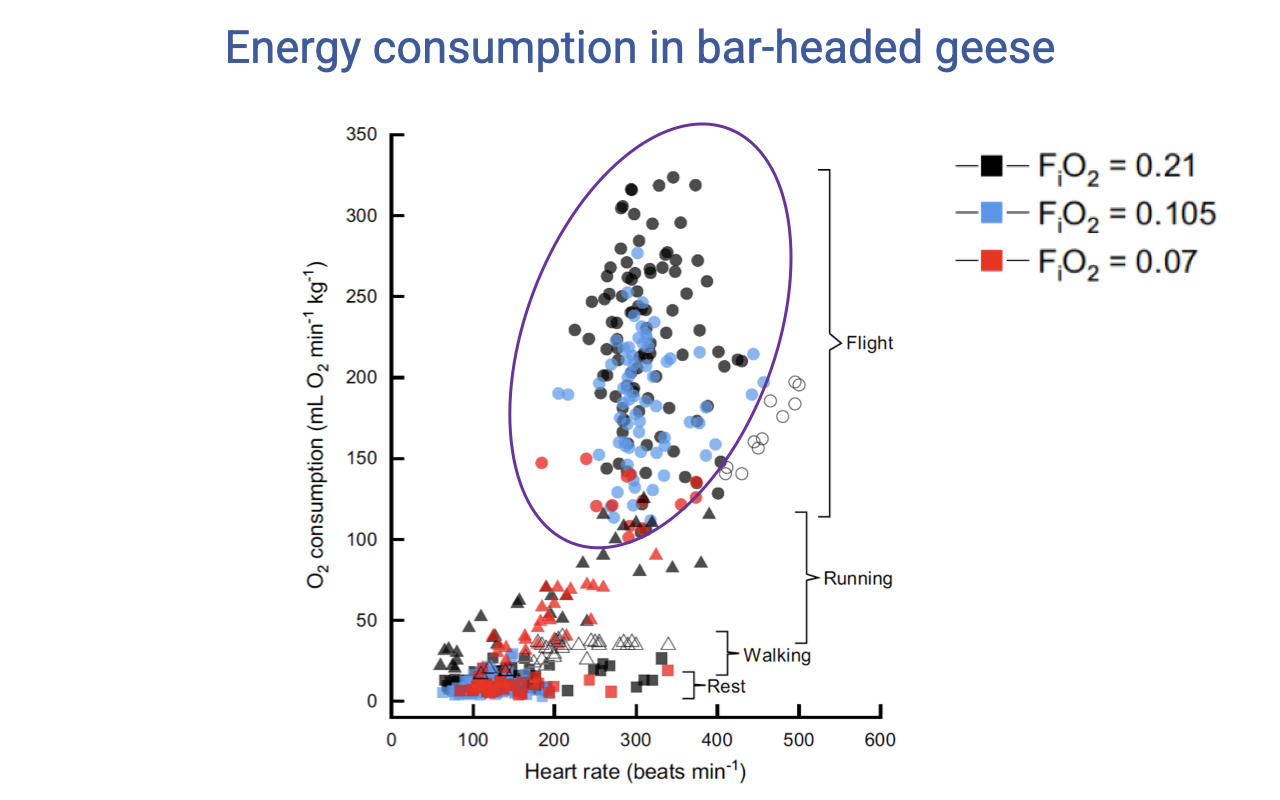
Heart Rate, VO2, and Oxygen Conditions
- During flight in the wind tunnel, VO2 and heart rate are roughly proportional but with substantial variation across trials.
- The data span rest, walking, running, and flight under normoxia and two levels of hypoxia (FIO₂ = 0.21, 0.105, 0.07).
- Key observation: the minimum VO2 during flight is similar across normoxic and hypoxic conditions — birds can fly at near-equivalent low costs in either condition, but the range of energy use is constrained in hypoxia.
- Some variability reflects behavioral flexibility in flight style — analogous to how a runner can choose a more or less economical gait.
Slide 30
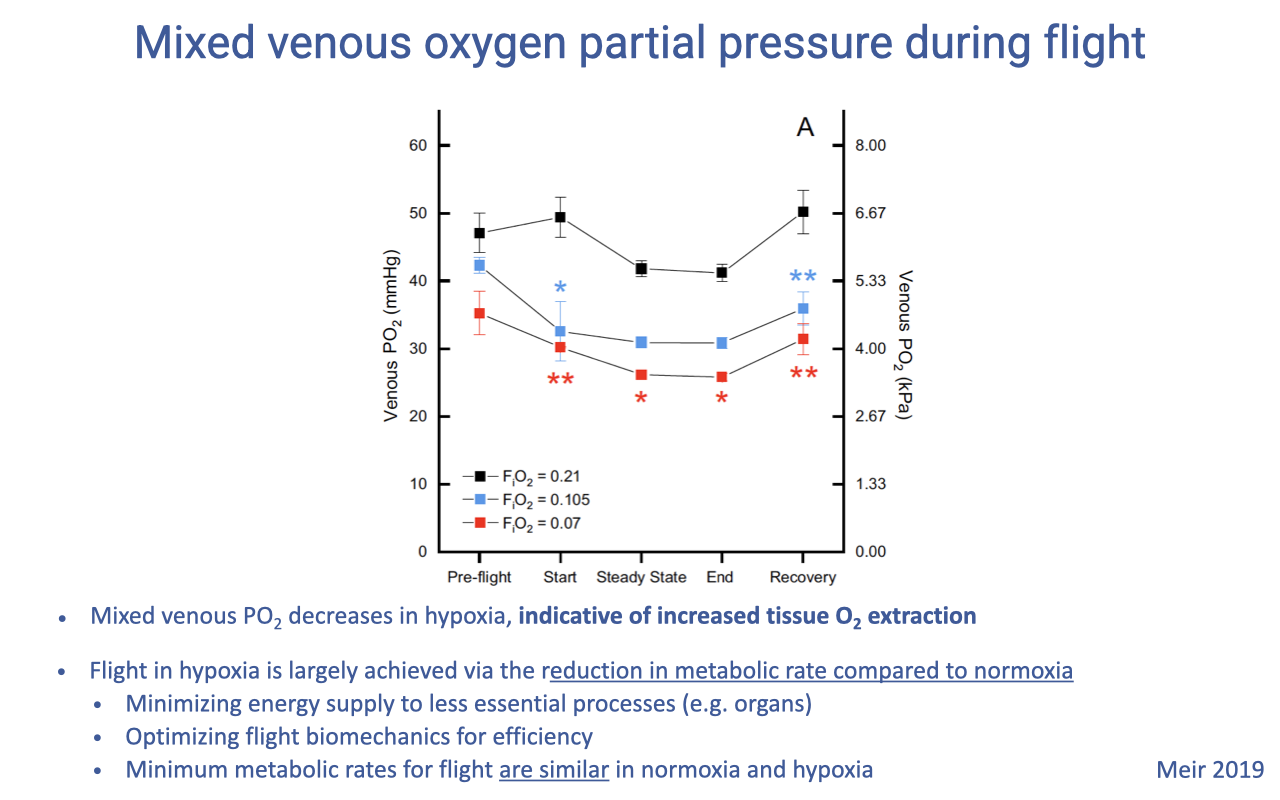
Mixed Venous PO₂ and the Flight Strategy in Hypoxia
- Mixed venous PO₂ falls during flight in hypoxia, signaling greater tissue O2 extraction — a wider arterio-venous O2 difference.
- The bird’s main strategy for flight in hypoxia is to reduce metabolic rate:
- Minimize energy supply to less essential processes
- Optimize flight biomechanics for efficiency
- The minimum cost of flight is similar in normoxia and hypoxia — but in hypoxia the bird is forced into the most efficient flight mode rather than choosing it.
Slide 31
Lecture 9 — Key Takeaways
- Inspired PO₂ falls with altitude, lowering PO₂ at every step of the oxygen supply cascade. At Everest’s summit, achievable VO2max ≈ basal metabolic rate.
- Acute lowlander responses include the hypoxic ventilatory response (HVR), increased cardiac output, increased [Hb], systemic vasodilation, hypoxic pulmonary vasoconstriction (with edema risk), and slow loss of mitochondrial density.
- High-altitude human populations (Tibetan, Andean) have evolved divergent solutions: Tibetans favor higher ventilation; Andeans favor higher [Hb] and saturation. These reflect a trade-off between cardiac output and blood viscosity.
- Sherpas show metabolic rather than structural adaptations — better mitochondrial coupling efficiency and lower fatty-acid oxidation, supporting aerobic supply with low mitochondrial volumes.
- Bar-headed geese combine general avian traits (cross-current lungs, large hearts, capillarized muscle) with specific adaptations (left-shifted hemoglobin, larger lungs, higher ventilation, mitochondrial redistribution) to maintain higher PO₂ across the cascade than lowland birds.
- In wind-tunnel studies (Meir et al.), bar-headed geese fly at high hypoxia by reducing metabolic rate and increasing tissue O2 extraction, not by increasing total O2 delivery.
- Time scales of adaptation differ: ventilation and hematocrit shift in days; mitochondrial density in weeks; population-level genetic adaptations across generations.
Key Equations
| Equation | Name | Description |
|---|---|---|
| $P_iO_2 = (P_B - P_{H_2O}) \cdot F_iO_2$ | Inspired PO₂ | Inspired PO₂ declines with barometric pressure (PB) at altitude even though FiO₂ ≈ 0.21 is constant. |
| $P_AO_2 \approx P_iO_2 - \frac{P_aCO_2}{R}$ | Alveolar gas equation (simplified) | Hyperventilation at altitude lowers PaCO₂, raising alveolar PO₂ for a given inspired PO₂. R = respiratory exchange ratio. |
| $\dot{V}O_2 = \dot{Q}(C_aO_2 - C_{\bar{v}}O_2)$ | Fick principle (cardiovascular) | Systemic O2 uptake equals cardiac output times the arterio-venous O2 content difference. At altitude, tissues widen the a-v difference to compensate. |
| $C_aO_2 = 1.39 \cdot [Hb] \cdot S_aO_2 + 0.003 \cdot P_aO_2$ | Arterial O2 content | At altitude, increased [Hb] partially offsets the lower SaO₂ to defend CaO₂. |
Glossary of Key Terms
| Term | Definition |
|---|---|
| Hypoxia | A condition of reduced oxygen availability — at altitude, caused by reduced barometric pressure and therefore reduced inspired PO₂. |
| Inspired PO₂ | Partial pressure of O2 in inspired air; falls curvilinearly with altitude as barometric pressure decreases. |
| Hypoxic ventilatory response (HVR) | The reflexive increase in ventilation as arterial PO₂ falls below a “hypoxic threshold” (~60 mmHg). Acts to raise alveolar PO₂ by lowering alveolar PCO₂. |
| Hypocapnia | Low arterial PCO₂, a consequence of hyperventilation. Drives respiratory alkalosis and altered cerebral blood flow at altitude. |
| Hypoxic pulmonary vasoconstriction | Pulmonary arteriolar constriction in response to low alveolar PO₂; normally matches perfusion to ventilation, but at altitude raises pulmonary pressure and can cause high-altitude pulmonary edema (HAPE). |
| Acclimatization | Reversible physiological changes (ventilation, [Hb], mitochondria) that occur within an individual over days to weeks of altitude exposure. |
| High-altitude native (HAN) | An individual or population that has lived at altitude for many generations and shows genetic and developmental adaptations distinct from lowlanders. |
| Tibetan high-altitude adaptation | Pattern of higher resting ventilation, higher HVR, lower [Hb], and lower SaO₂ (relative to Andean highlanders). |
| Andean high-altitude adaptation | Pattern of higher [Hb], higher SaO₂, and lower ventilation rates (relative to Tibetan highlanders). |
| Mitochondrial coupling efficiency | The ATP yield per O2 consumed in oxidative phosphorylation; enhanced in Sherpas, supporting aerobic energy supply with lower mitochondrial volume. |
| Cross-current gas exchange | The avian arrangement in which air capillaries and blood capillaries run perpendicular to each other; intermediate in efficiency between countercurrent (fish) and tidal-pool (mammals). |
| Bar-headed goose hemoglobin | A hemoglobin variant with higher O2 affinity than lowland goose hemoglobin; the dissociation curve is leftward-shifted, enabling near-full saturation at low PO₂. |
| Aerobic scope | The ratio (or difference) between maximum and resting metabolic rate; collapses to ≈ 1 at the summit of Everest. |
| Mixed venous PO₂ | The PO₂ of blood returning to the right heart; falls at altitude or with greater tissue O2 extraction. |