Lecture 8: Cardiovascular Responses to Exercise
Slide 1
- This lecture covers the cardiovascular responses to exercise, including O2-hemoglobin binding, myoglobin function, the graphical Fick principle for comparing O2 delivery across species, and the specific cardiovascular adjustments (heart rate, stroke volume, blood flow redistribution) during exercise.
- Topics bridge from the ventilatory system (covered in Lecture 6) to the circulatory system’s role in O2 delivery to the tissues.
Slide 2
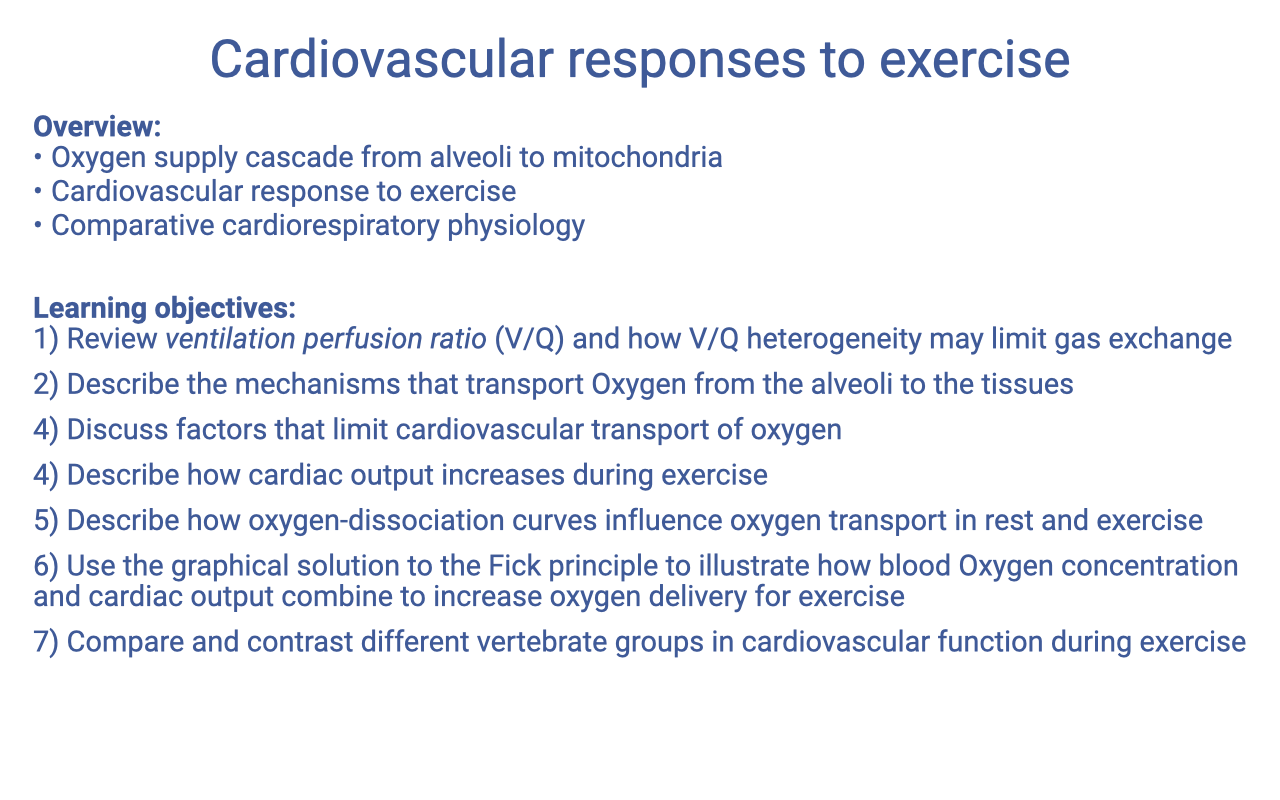
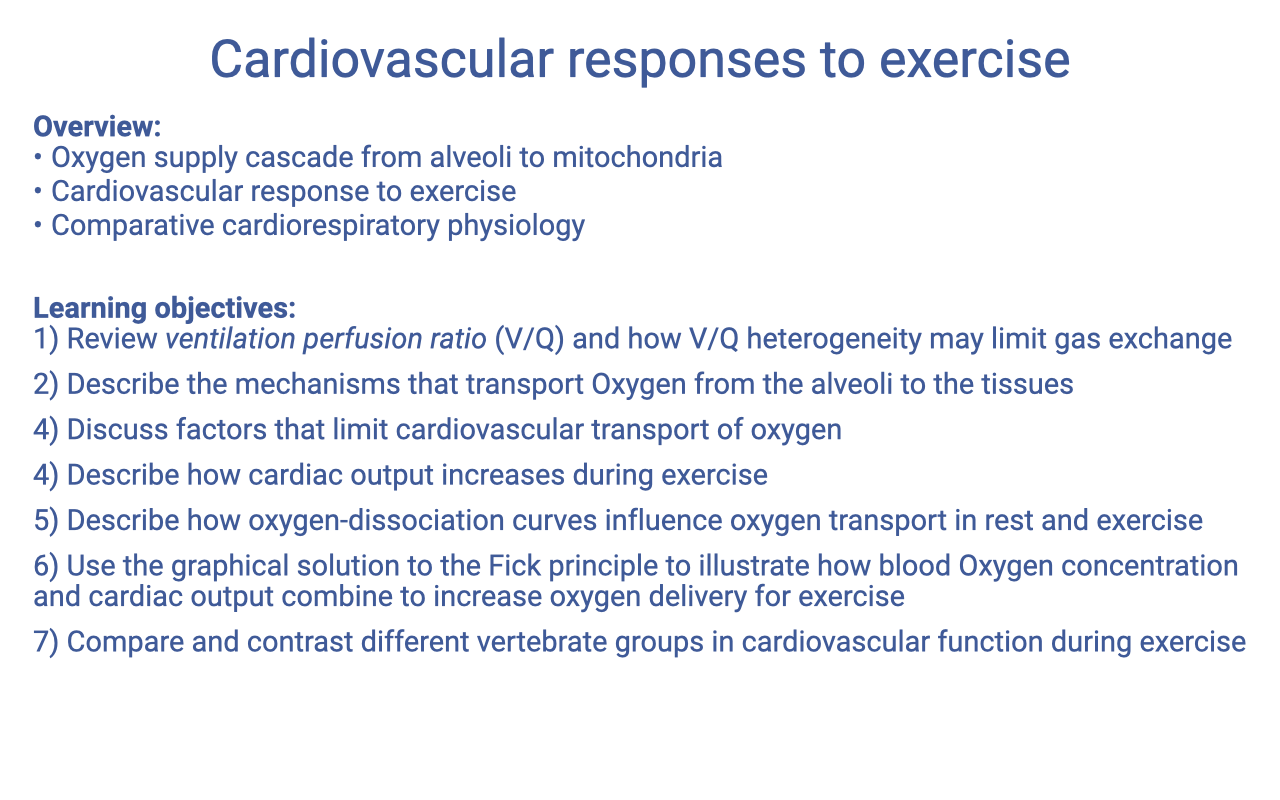
Overview and Learning Objectives
Overview:
- Oxygen supply cascade from alveoli to mitochondria
- Cardiovascular response to exercise
- Comparative cardiorespiratory physiology
Learning objectives:
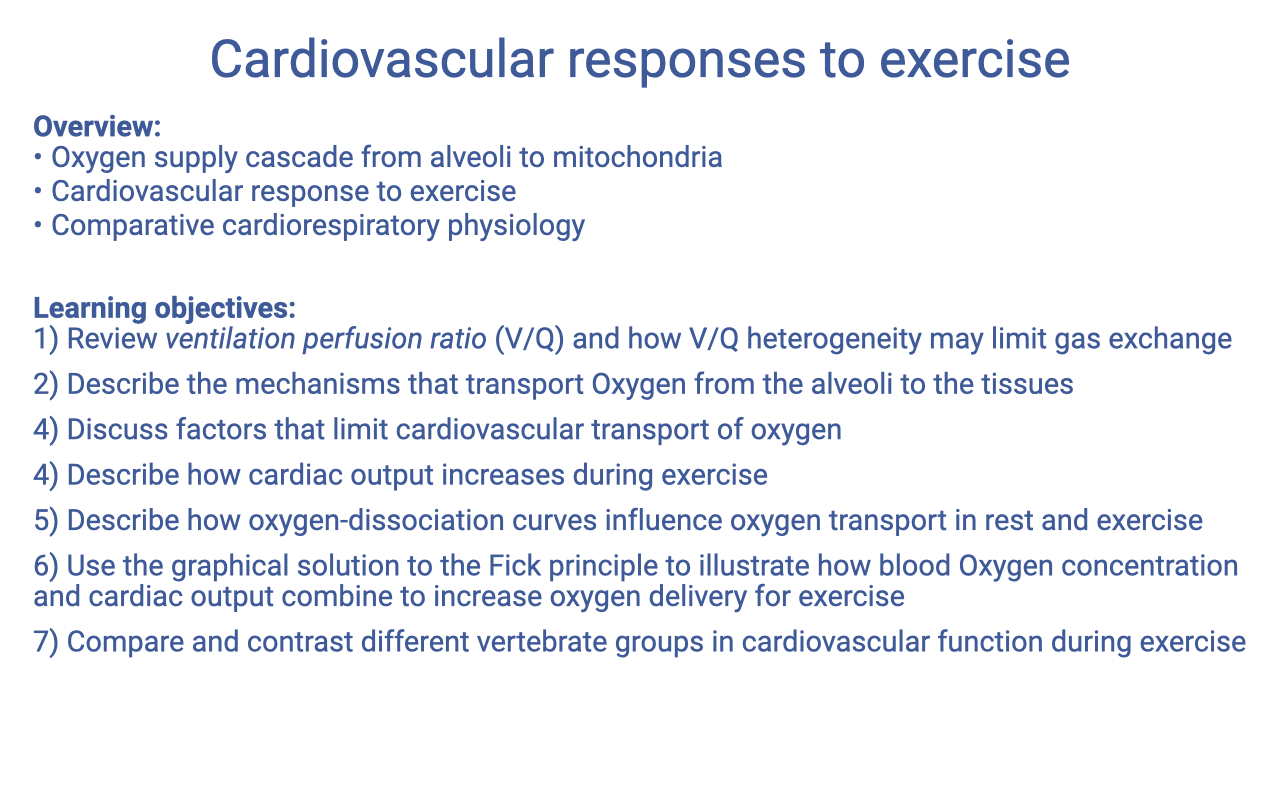
- Review ventilation-perfusion ratio (V/Q) and how V/Q heterogeneity may limit gas exchange.
- Describe the mechanisms that transport O2 from the alveoli to the tissues.
- Discuss factors that limit cardiovascular transport of O2.
- Describe how cardiac output increases during exercise.
- Describe how oxygen-dissociation curves influence O2 transport in rest and exercise.
- Use the graphical solution to the Fick principle to illustrate how blood O2 concentration and cardiac output combine to increase O2 delivery for exercise.
- Compare and contrast different vertebrate groups in cardiovascular function during exercise.
Slide 3
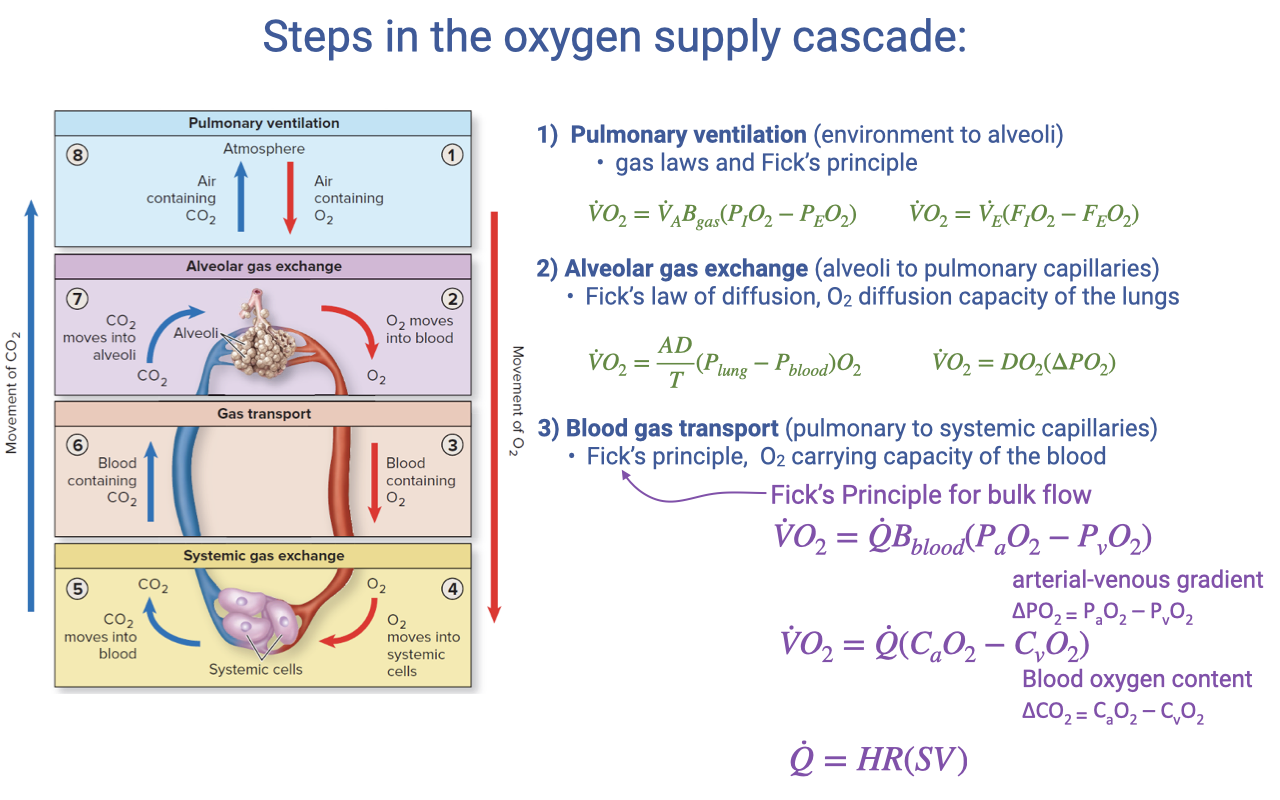
Review: Steps in the Oxygen Supply Cascade
- The oxygen supply cascade consists of four steps, each governed by specific equations:
- Pulmonary ventilation — Fick principle for air convection
- Alveolar gas exchange — Fick’s law of diffusion
- Blood gas transport (highlighted) — Fick principle for blood convection
- Systemic gas exchange — Fick’s law of diffusion at the tissue level
- The blood gas transport step uses:
- Equivalently, in terms of blood O2 content:
- Where cardiac output is: $\dot{Q} = HR \times SV$
Slide 4
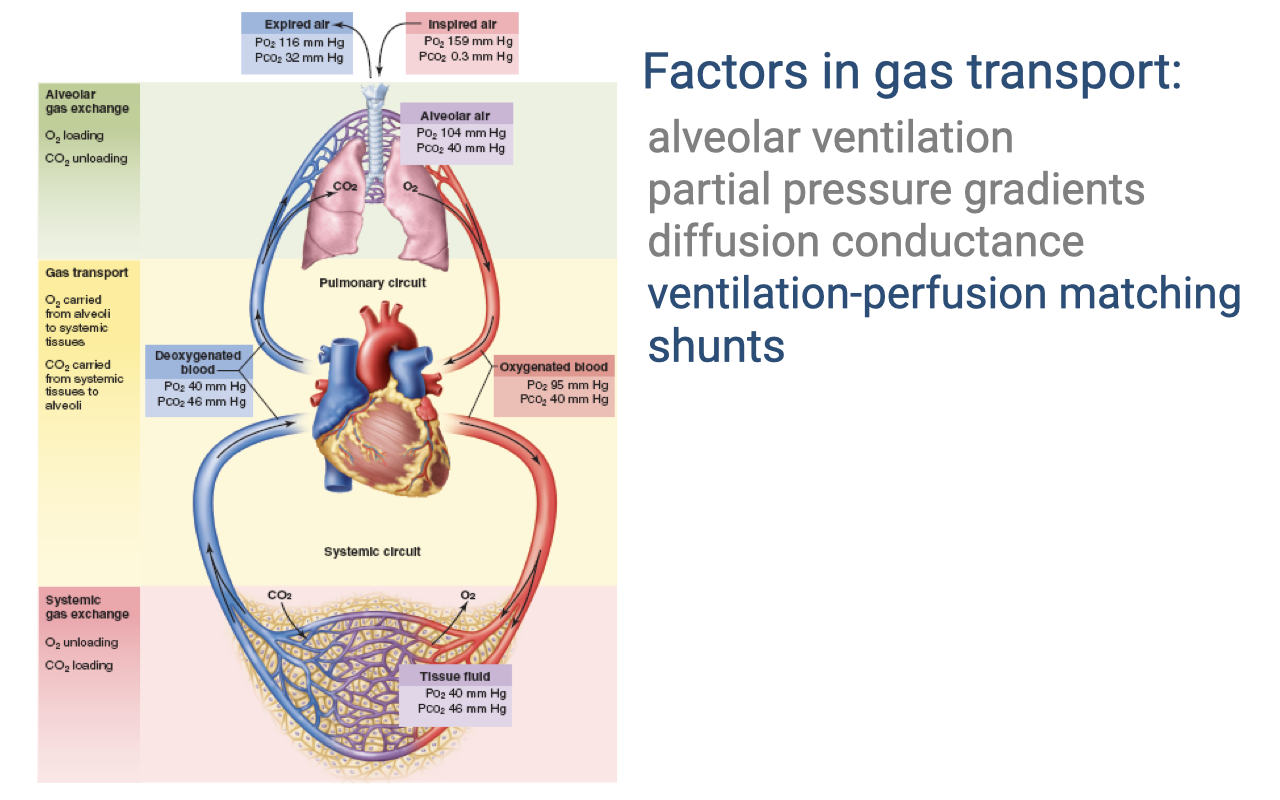
Review: Factors in Gas Transport
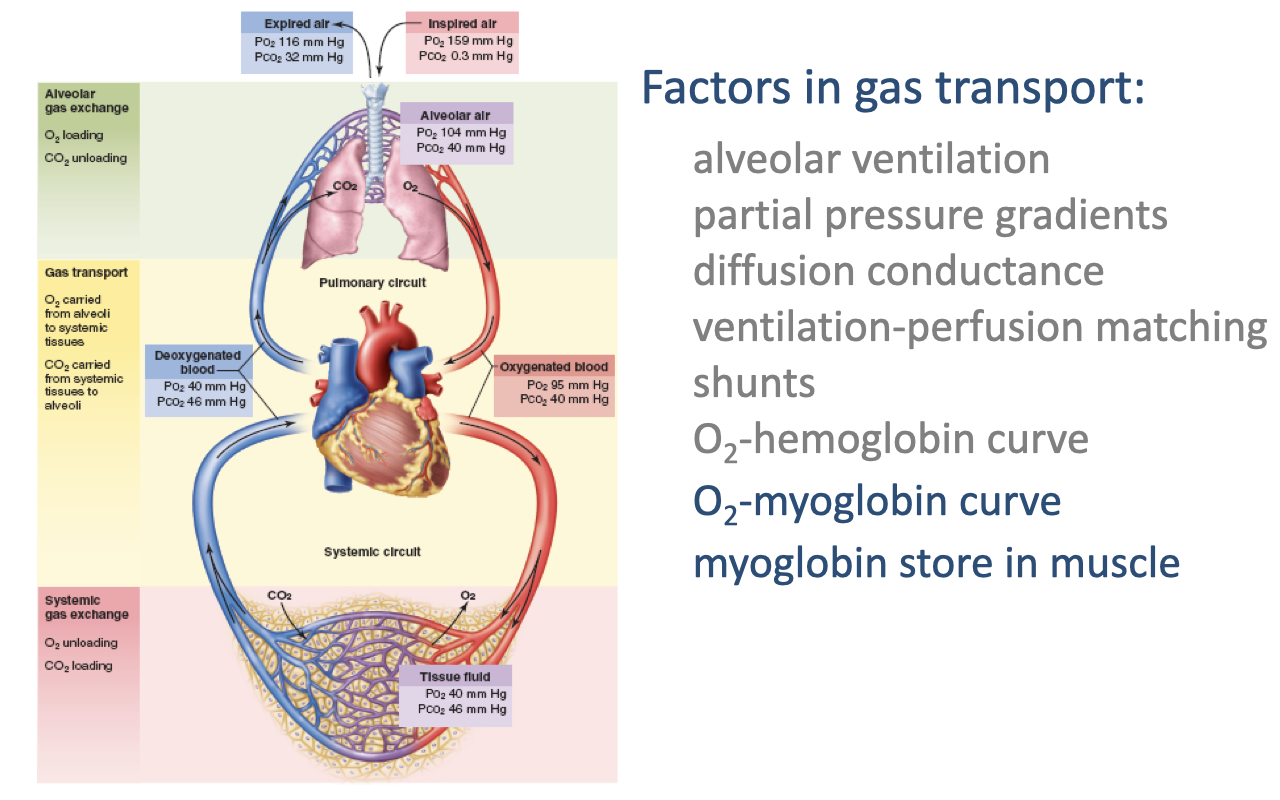
- The complete circuit of O2 transport shows progressive decreases in PO₂ at each step:
- Inspired air: PO₂ = 159 mmHg
- Alveolar air: PO₂ = 104 mmHg
- Oxygenated blood: PO₂ = 95 mmHg; PCO₂ = 40 mmHg
- Deoxygenated blood: PO₂ = 40 mmHg; PCO₂ = 46 mmHg
- Tissue fluid: PO₂ = 40 mmHg; PCO₂ = 46 mmHg
- Key factors: alveolar ventilation, partial pressure gradients, diffusion conductance, ventilation-perfusion matching, and shunts.
Slide 5
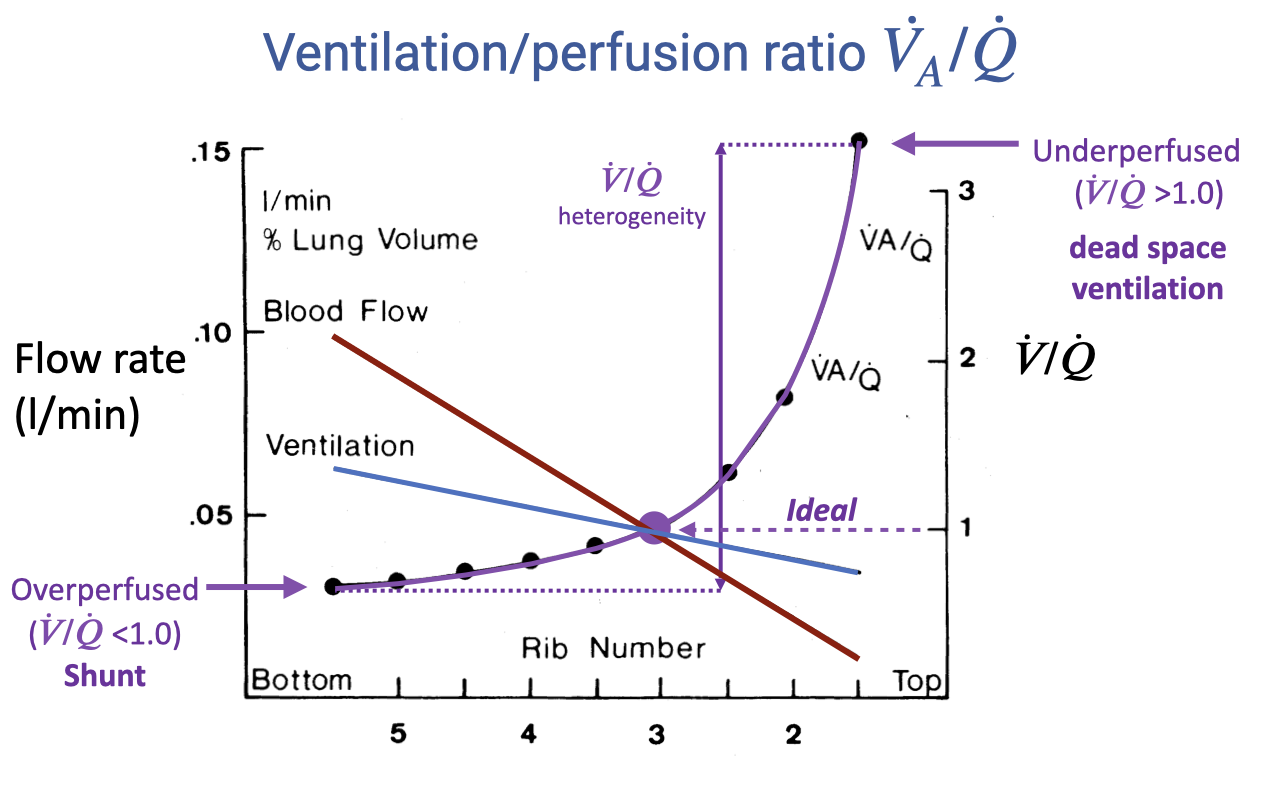
Review: V/Q Heterogeneity Across the Lung
- Blood flow declines steeply from the lung base to the apex; ventilation also declines but less steeply.
- The V/Q ratio rises from below 1.0 at the base (overperfused = shunt) to above 3.0 at the apex (underperfused = dead space ventilation).
- The spread between the highest and lowest V/Q values represents V/Q heterogeneity — greater heterogeneity reduces gas-exchange efficiency.
- The ideal V/Q ratio is 1.0 across all lung regions.
Slide 6
Transition: From Pulmonary to Cardiovascular Responses
- This slide marks the transition from the review of ventilation-perfusion matching to the main topic: cardiovascular responses to exercise.
- The remaining learning objectives focus on O2-hemoglobin binding, the Bohr effect, myoglobin function, cardiac output during exercise, and comparative cardiovascular physiology.
Slide 7
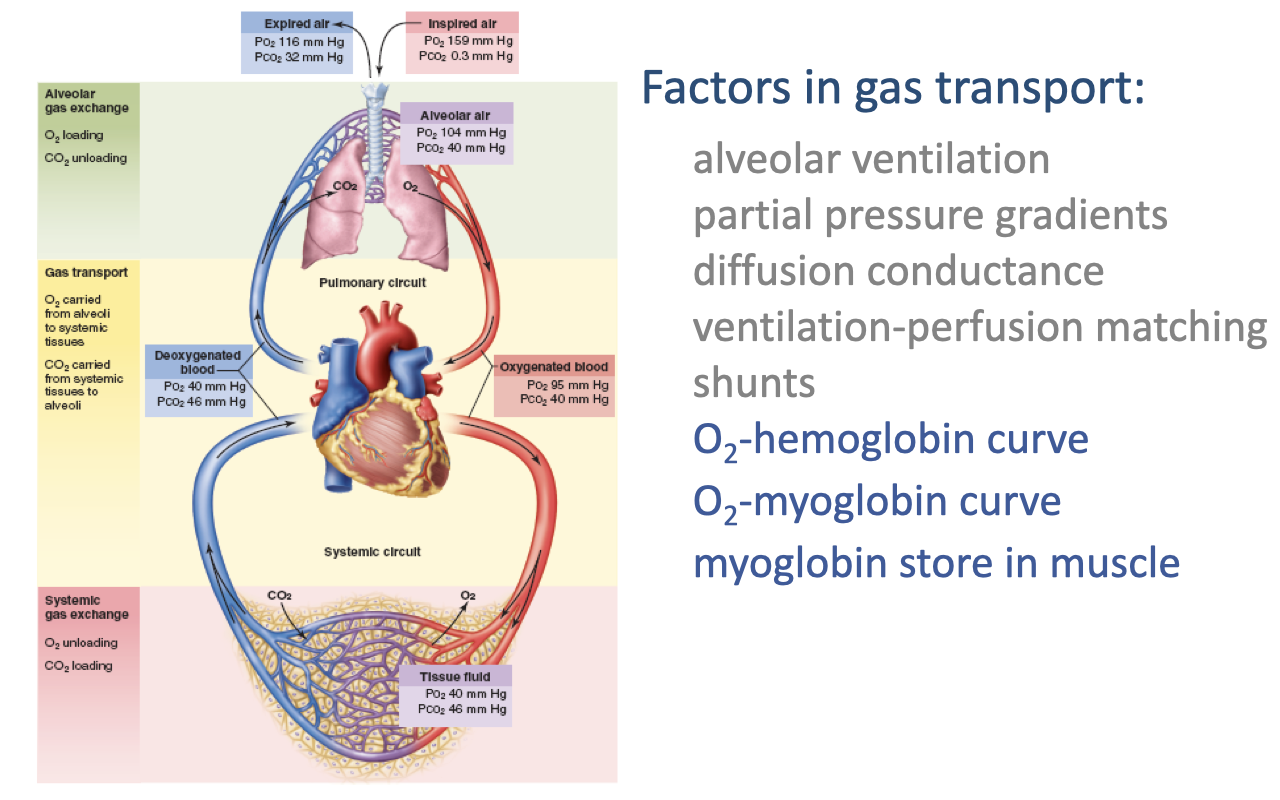
Factors in Gas Transport: New Topics
- Building on previously covered factors, this lecture introduces three additional mechanisms critical for O2 delivery to tissues:
- O2-hemoglobin curve — the relationship between PO₂ and hemoglobin saturation
- O2-myoglobin curve — myoglobin’s role in intramuscular O2 transport
- Myoglobin store in muscle — acting as an O2 reservoir and shuttle within muscle tissue
- These mechanisms operate at the interface between blood gas transport and systemic gas exchange, determining how effectively O2 moves from capillary blood to mitochondria.
Slide 8
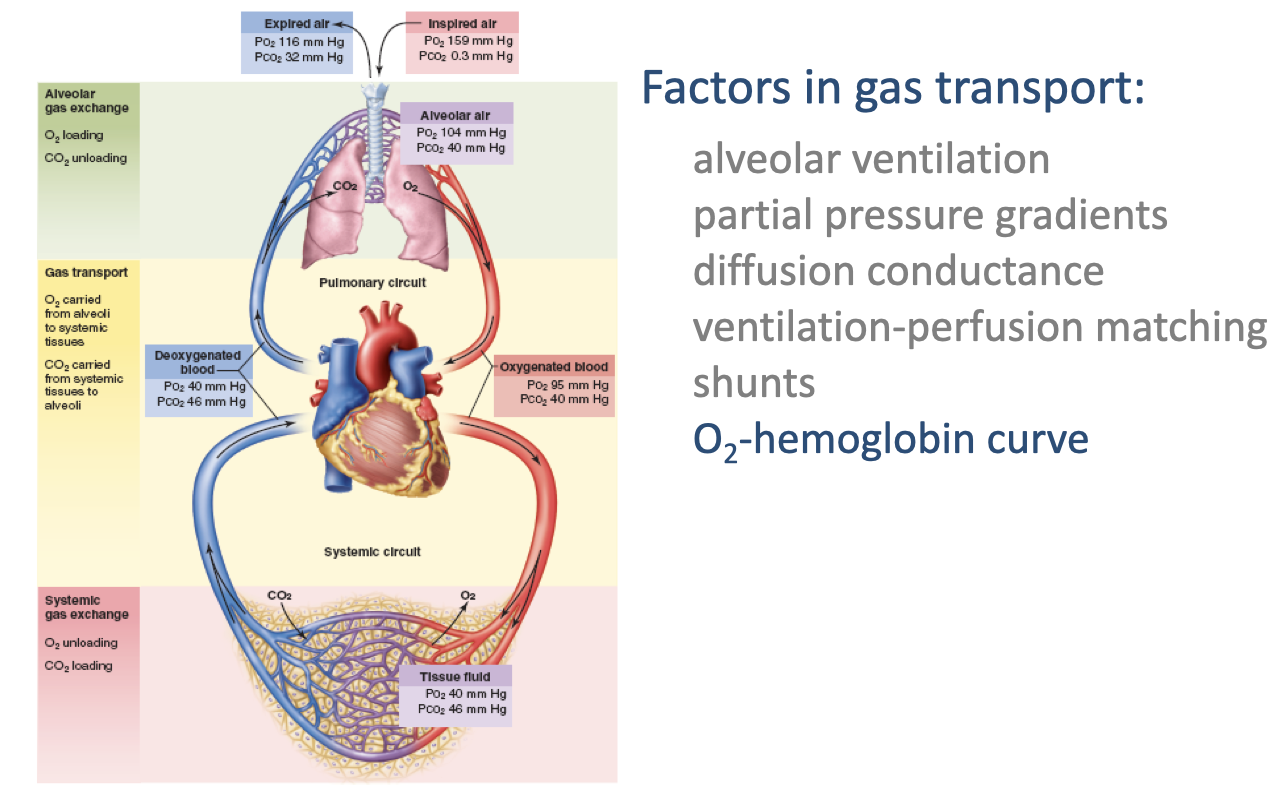
Focus: O2-Hemoglobin Curve
- The oxygen-hemoglobin dissociation curve describes how hemoglobin binds and releases O2 at different partial pressures.
- This curve is central to understanding how O2 is loaded in the lungs and unloaded at the tissues — and how exercise conditions modify this process.
Slide 9
![Slide titled "Oxygen-Hemoglobin Dissociation Curve." Left side shows the equation for percent saturation: %Sat = [O2]/O2 capacity × 100, with a note that O2 capacity is the maximum quantity of oxygen that will combine chemically with hemoglobin in a unit volume of blood (normally 1.34 mL O2 per g Hb, or 20 mL O2 per 100 mL of blood). Right side: a sigmoid curve with partial pressure of oxygen (mmHg) on the x-axis (0–120) and % saturation of Hb on the y-axis (0–100). The curve shows a steep rise between 20–60 mmHg and a plateau above 80 mmHg. A note states "On the y-axis we can have % Sat or [O2]."](/E183_ExercisePhysiology/week03/images/lec08/slide-009.png)
Oxygen-Hemoglobin Dissociation Curve
- Percent saturation of hemoglobin is defined as:
- O2 capacity is the maximum amount of O2 that can bind hemoglobin per unit volume of blood — normally 1.34 mL O2 per gram of Hb, or approximately 20 mL O2 per 100 mL of blood.
- The curve has a characteristic sigmoid (S-shaped) form:
- Steep rise between ~20–60 mmHg PO₂ — small changes in PO₂ cause large changes in saturation
- Plateau above ~80 mmHg — hemoglobin is nearly fully saturated
- The y-axis can show either percent saturation or absolute O2 concentration (mL O2/100 mL blood).
Slide 10
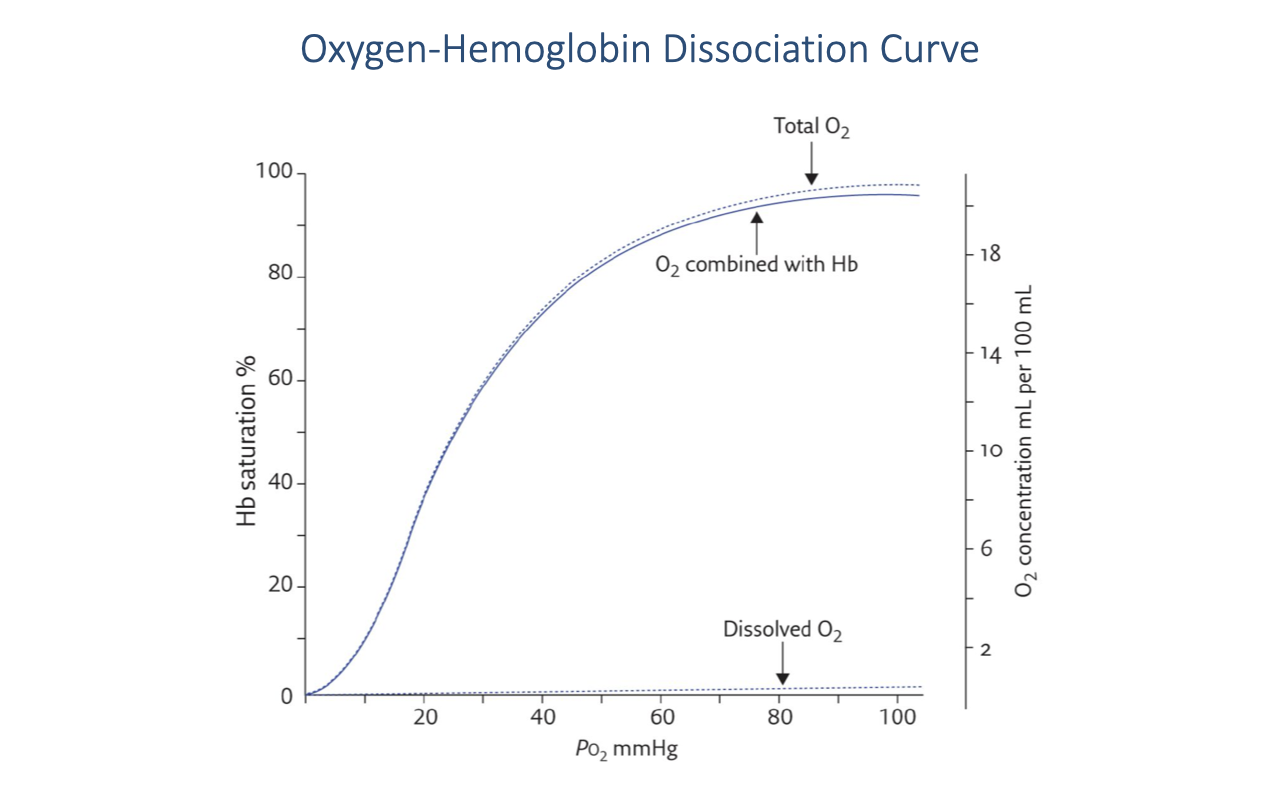
Hemoglobin-Bound vs. Dissolved Oxygen
- The vast majority of O2 in the blood is bound to hemoglobin (solid curve, “O2 combined with Hb”).
- Dissolved O2 in the plasma (bottom line) is a very small fraction of total blood O2 — only about 0.3 mL O2 per 100 mL blood at PO₂ = 100 mmHg.
- The dashed “Total O2” line is the sum of hemoglobin-bound and dissolved O2, running just slightly above the hemoglobin curve.
- At typical hemoglobin concentrations (~15 g/dL), fully saturated blood carries approximately 20 mL O2 per 100 mL — making hemoglobin the dominant O2 carrier.
- The properties of hemoglobin — specifically the PO₂ at which it binds and releases O2 — are therefore critically important for O2 delivery.
Slide 11
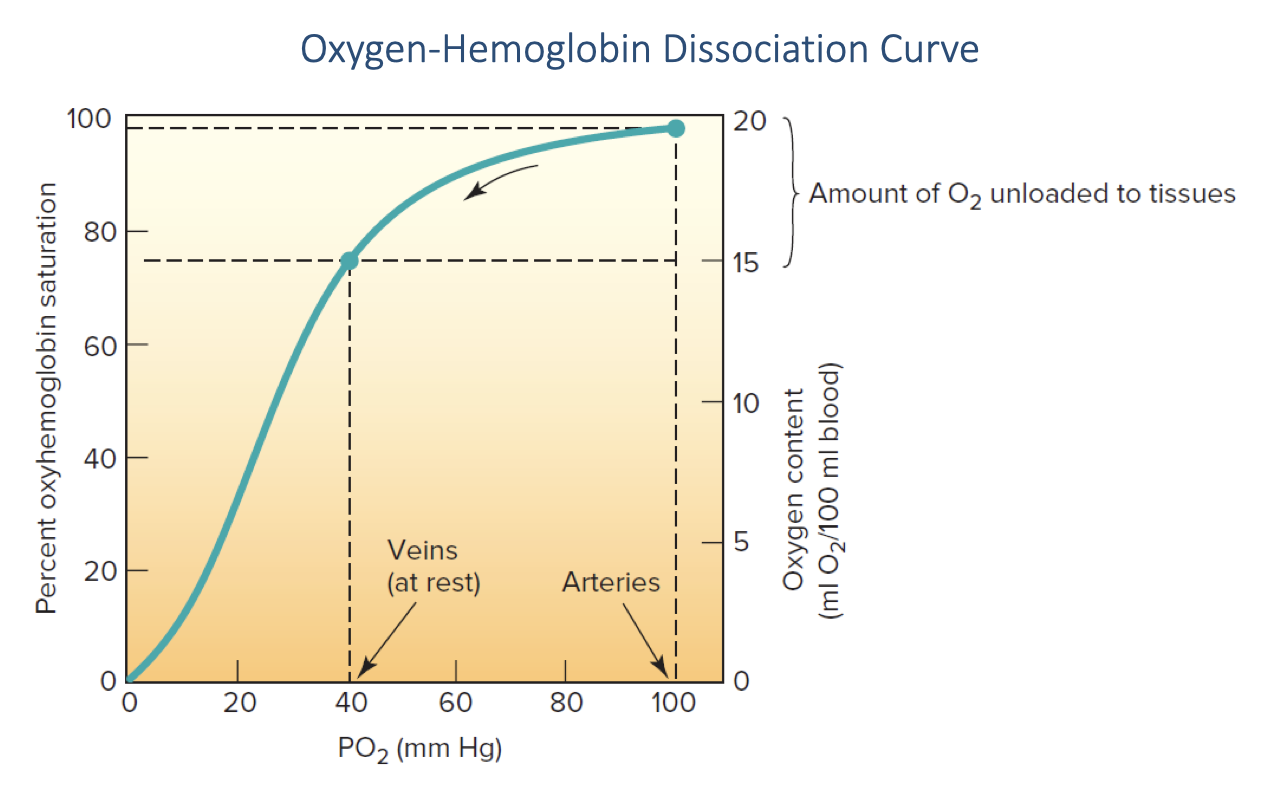
O2 Loading and Unloading In Vivo
- At arterial PO₂ (~100 mmHg), hemoglobin is essentially 100% saturated with O2 — this is in the plateau region of the curve.
- At resting venous PO₂ (~40 mmHg), hemoglobin is approximately 75% saturated.
- The difference between arterial and venous saturation represents the amount of O2 unloaded to the tissues — approximately 5 mL O2 per 100 mL blood at rest (a-v O2 difference of ~25% of total carrying capacity).
- At rest, a significant reserve of O2 remains bound to hemoglobin in the venous blood — this reserve can be tapped during exercise as venous PO₂ falls further.
- The steep portion of the sigmoid curve (20–60 mmHg) means that small decreases in venous PO₂ during exercise release large amounts of additional O2 to the tissues.
Slide 12
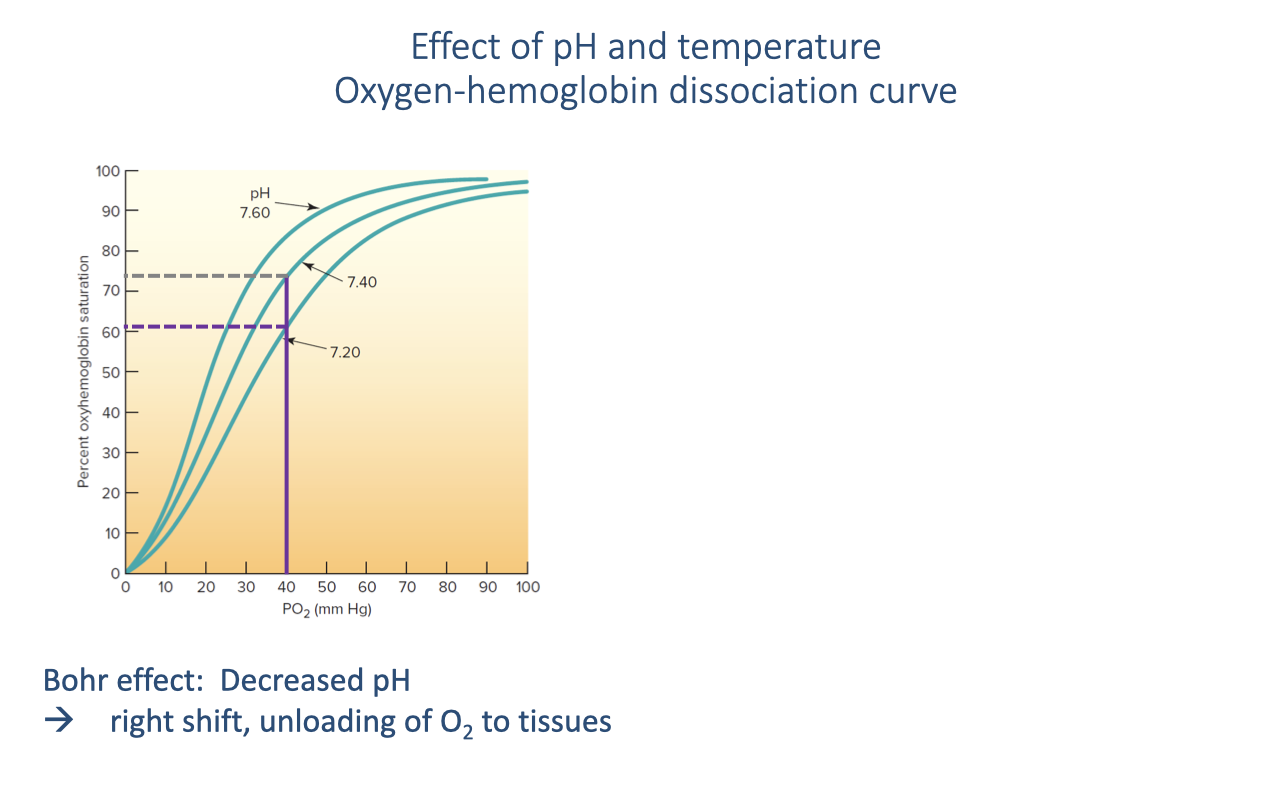
The Bohr Effect: pH and the Dissociation Curve
- The Bohr effect describes the rightward shift of the oxygen-hemoglobin dissociation curve when blood pH decreases.
- During exercise, active muscles produce CO2, which lowers local blood pH — causing a rightward shift.
- At a given venous PO₂ (e.g., ~40 mmHg):
- At pH 7.40 (normal): hemoglobin is ~75% saturated
- At pH 7.20 (exercising muscle): hemoglobin is ~60% saturated
- The rightward shift means more O2 is released to the tissues at the same PO₂.
- This is a self-regulating feedback: the tissues that are most metabolically active produce the most CO2 and acid, creating a local rightward shift precisely where O2 is most needed.
Slide 13
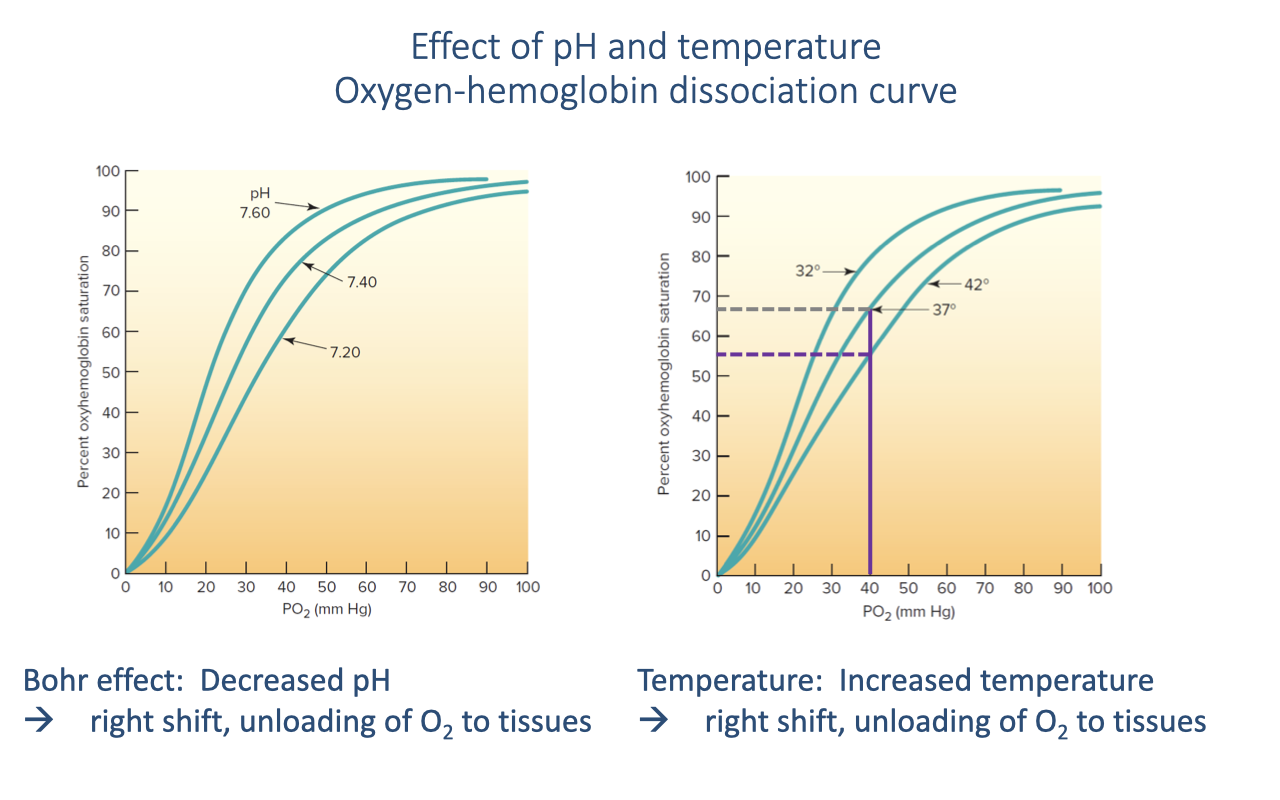
Temperature Effect on the Dissociation Curve
- Increased temperature also causes a rightward shift of the O2-hemoglobin dissociation curve, facilitating O2 release at the tissues.
- Normal body temperature is 37°C. During exercise, active muscles generate heat and can warm to ~42°C locally.
- At the same venous PO₂, the temperature increase shifts hemoglobin saturation from ~65% to ~55%, releasing more O2.
- This temperature effect is localized — it is most pronounced in the muscles that are actually working and generating heat.
- Both the Bohr effect (pH) and the temperature effect act together during exercise to enhance O2 offloading at the tissue level, directing O2 preferentially to active muscles.
- In ectotherms (reptiles, amphibians), the temperature effect is even more important because body temperature can vary over a much wider range.
Slide 14
Focus: Myoglobin and Intramuscular O2 Transport
- The next factors in gas transport are the O2-myoglobin curve and the myoglobin store in muscle.
- These operate at the final step of the oxygen supply cascade — getting O2 from the capillary blood across the muscle tissue to the mitochondria.
Slide 15
Myoglobin vs. Hemoglobin Dissociation Curves
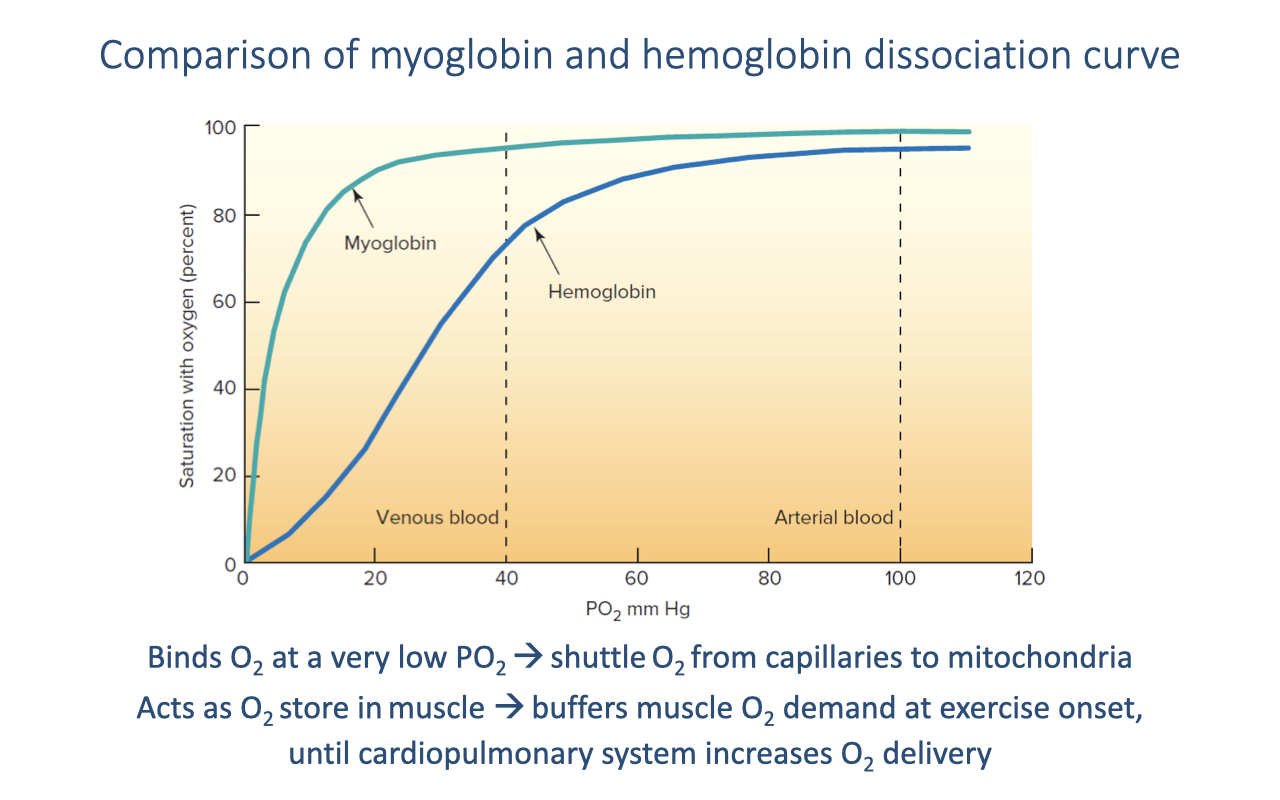
- Myoglobin (Mb) has a left-shifted dissociation curve compared to hemoglobin — it has a much higher O2 affinity.
- At typical venous PO₂ (~40 mmHg):
- Hemoglobin is ~75% saturated — it releases O2
- Myoglobin is nearly fully saturated — it accepts and binds the released O2
- Myoglobin only releases O2 at very low PO₂ values (near actively respiring mitochondria), creating an effective shuttle:
- Hemoglobin → releases O2 at the capillary → myoglobin binds it → carries it through the muscle cell → releases it at the mitochondria where PO₂ is near zero.
- Myoglobin also acts as an O2 store in muscle tissue, buffering the immediate demand for O2 at exercise onset before the cardiopulmonary system fully ramps up.
- Higher myoglobin concentration in trained muscle → greater O2 shuttling capacity and steeper diffusion gradient from capillary to mitochondria.
Slide 16
Summary: All Factors in Gas Transport
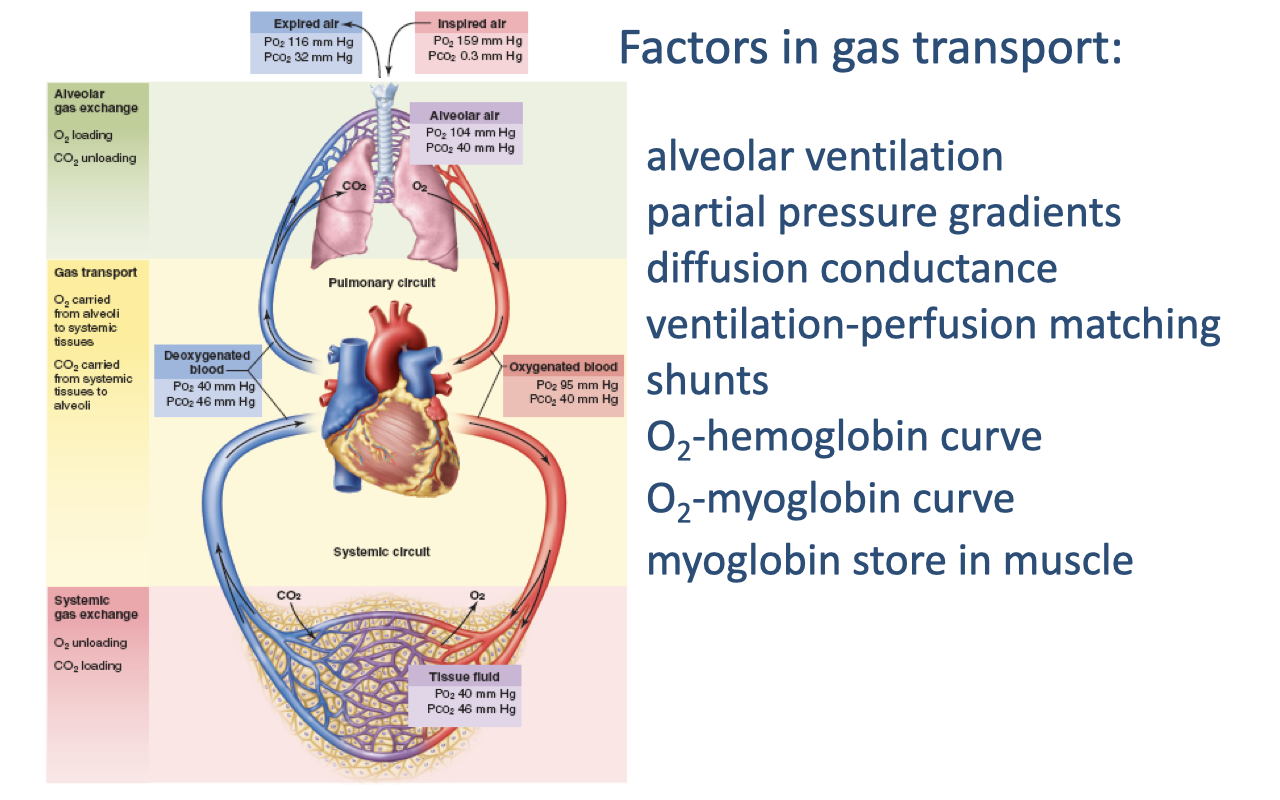
- All key factors in gas transport through the oxygen supply cascade have now been covered:
- Alveolar ventilation — delivery of fresh air to the gas-exchange surface
- Partial pressure gradients — the driving force at each step
- Diffusion conductance — membrane thickness and surface area
- Ventilation-perfusion matching — coordination of airflow and blood flow
- Shunts — blood bypassing gas exchange
- O2-hemoglobin curve — loading in lungs, unloading at tissues (modulated by pH and temperature)
- O2-myoglobin curve — intramuscular O2 shuttle from capillaries to mitochondria
- Myoglobin store in muscle — O2 reserve buffering demand at exercise onset
Slide 17
Think-pair-share in class Activity: Factors Influencing the Fick Equation
Slide 18
Review: Diversity in Vertebrate Cardiovascular Systems
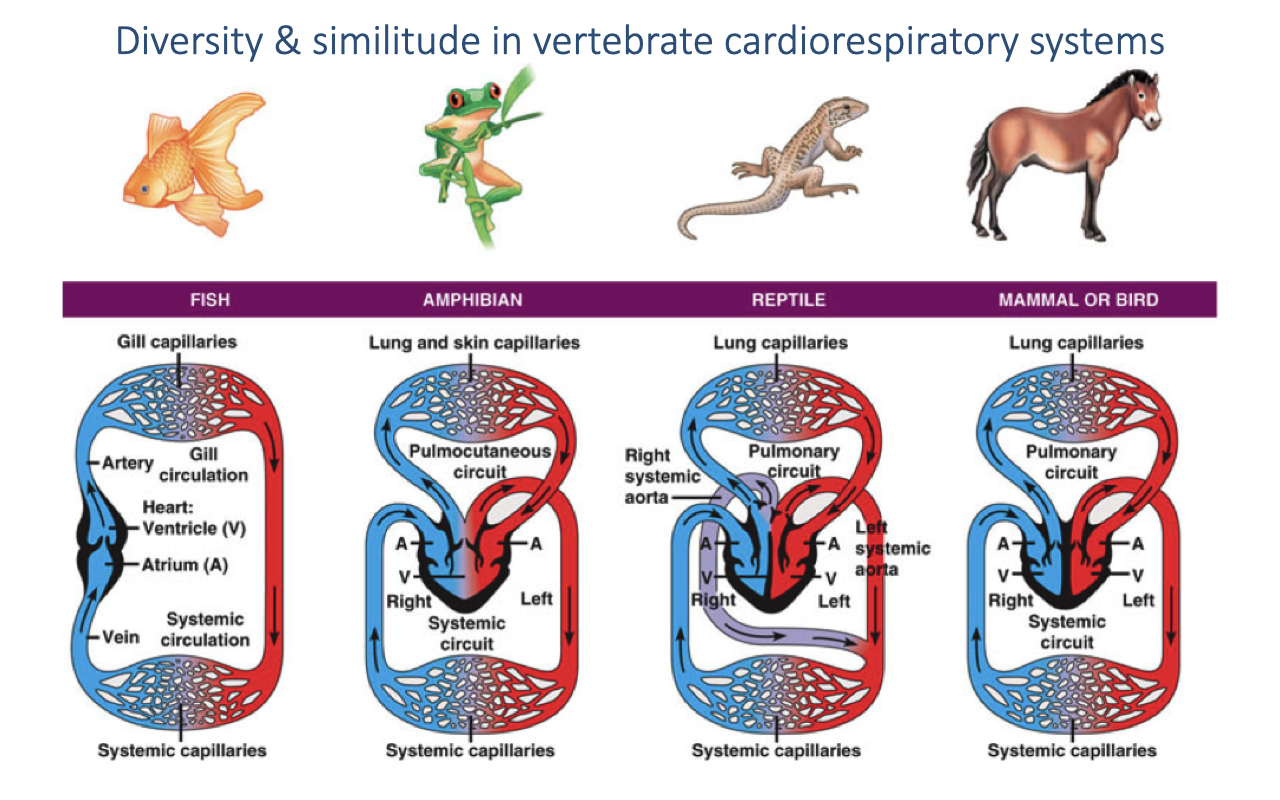
- Fish — two-chambered heart (one atrium, one ventricle); single-loop circulation through gills then to systemic capillaries.
- Amphibians — three-chambered heart; mixing of oxygenated and deoxygenated blood in a shared ventricle (pulmocutaneous + systemic circuits).
- Reptiles — partially divided ventricle; a functional cardiac shunt allows mixing at rest.
- Mammals and birds — fully divided four-chambered heart; completely separate pulmonary and systemic circuits with different pressures.
- Mammals and birds independently evolved complete ventricular division — convergent evolution associated with high aerobic demand.
- Animals with incomplete ventricular division can reduce their shunt during exercise, rapidly increasing arterial O2 saturation.
Slide 19
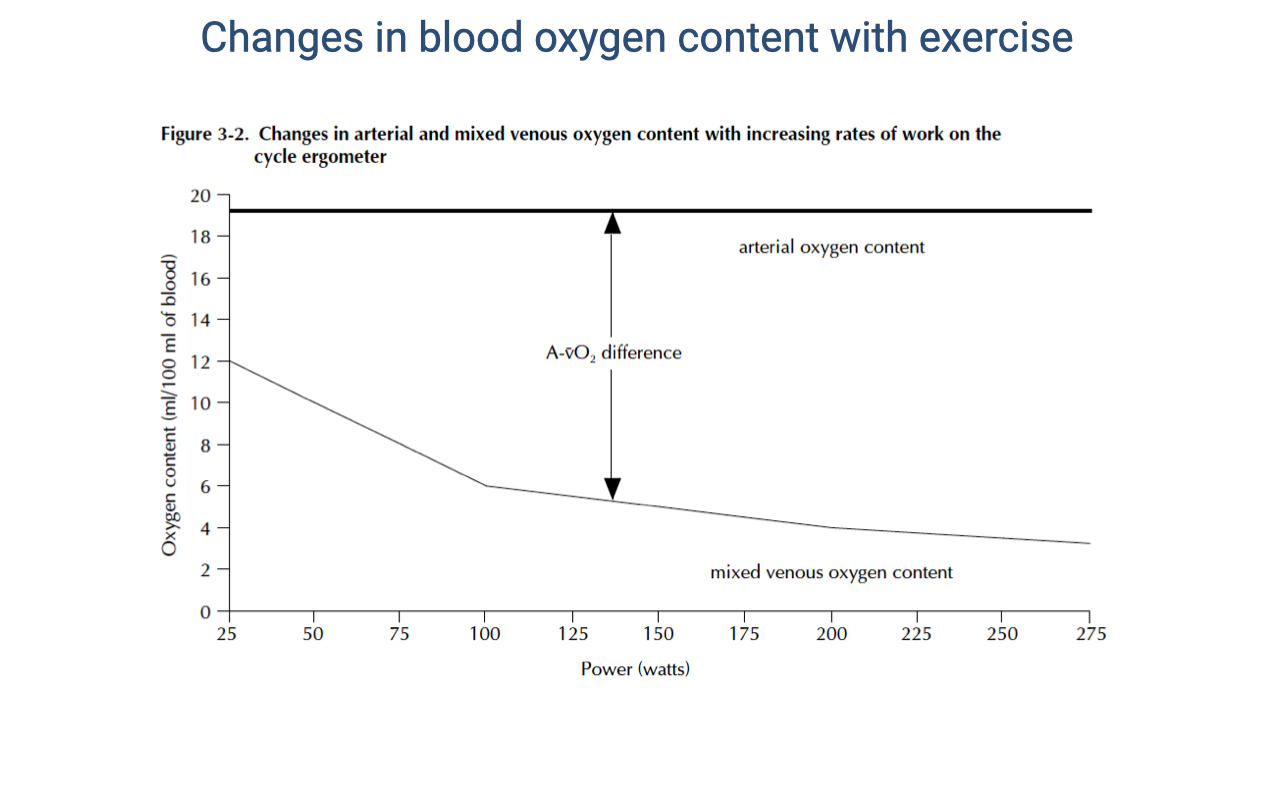
Changes in Blood O2 Content with Exercise
- Arterial O2 content remains relatively constant at ~20 mL O2/100 mL blood across the full range of exercise intensities — hemoglobin remains nearly fully saturated.
- Mixed venous O2 content decreases progressively with increasing work rate — from ~15 mL/100 mL at rest to ~4 mL/100 mL at maximal exercise.
- The a-v O2 difference (the gap between the two lines) expands dramatically with exercise:
- At rest: ~5 mL O2/100 mL blood
- At maximal exercise: ~16 mL O2/100 mL blood
- This widening a-v O2 difference reflects increased tissue O2 extraction, driven by:
- Lower venous PO₂ (mitochondria consuming O2 faster)
- The Bohr effect (lower pH facilitating O2 release)
- Increased temperature in active muscles
- Myoglobin shuttling O2 to mitochondria
Slide 20
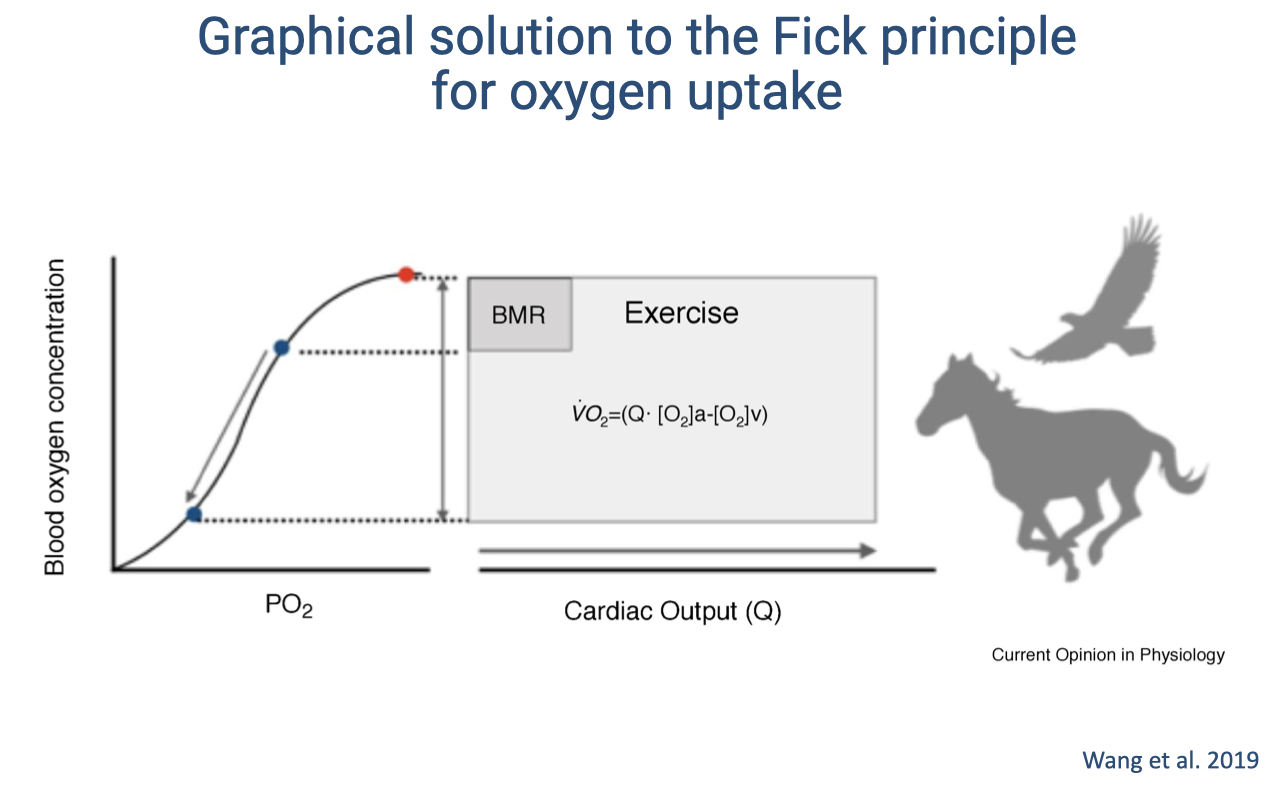
Graphical Fick Solution: Mammals and Birds
- The graphical solution to the Fick principle visualizes total O2 delivery as a rectangle:
- Width = cardiac output ($\dot{Q}$)
- Height = a-v O2 content difference ($C_aO_2 - C_{\bar{v}}O_2$)
- Area = $\dot{V}O_2$ (total O2 consumption)
- At rest (BMR): a small rectangle — low cardiac output and modest a-v O2 difference.
- During exercise: the rectangle expands in both dimensions — cardiac output increases dramatically and the a-v O2 difference widens as venous saturation drops further along the sigmoid curve.
- In mammals and birds (with fully divided hearts), the arterial side remains ~100% saturated, so the increase comes from:
- Higher cardiac output (wider rectangle)
- Greater O2 extraction — venous PO₂ drops into the steep portion of the curve, releasing large amounts of O2
Slide 21
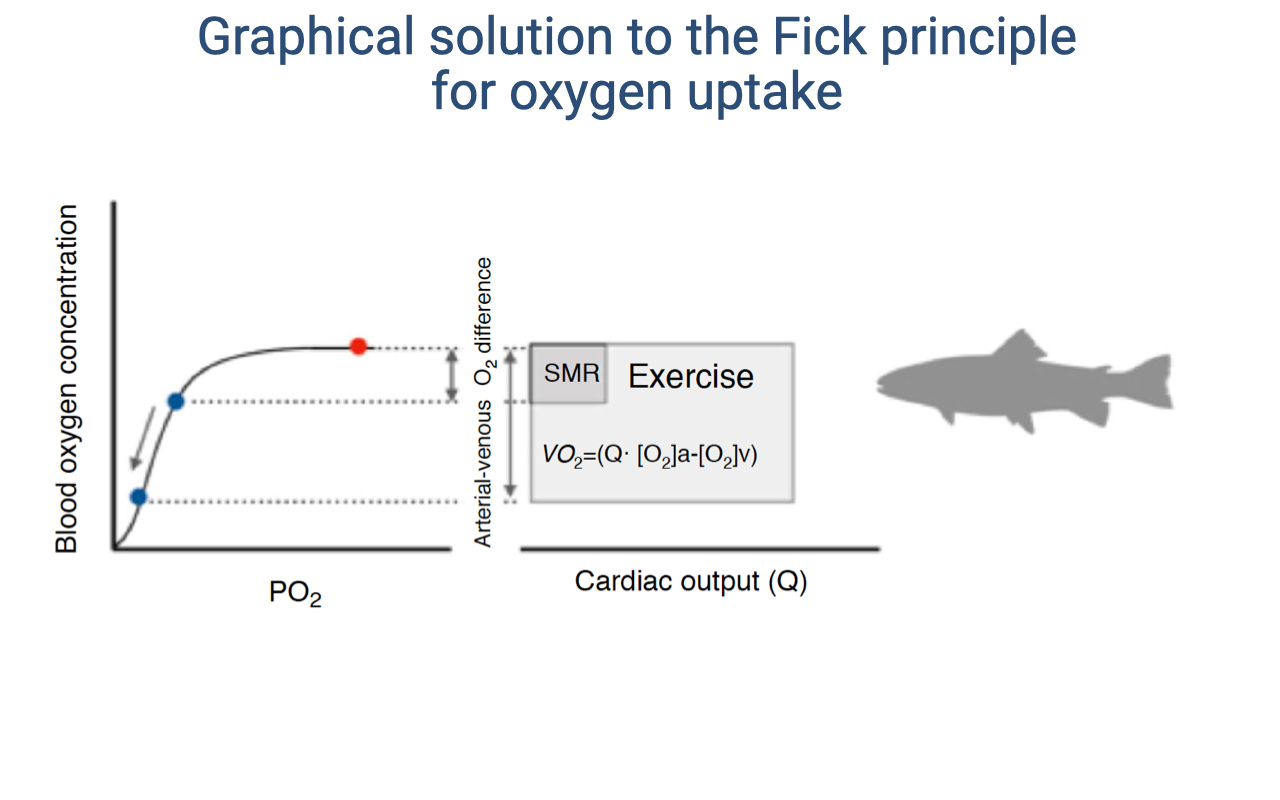
Graphical Fick Solution: Fish (Ectotherms)
- The same graphical principle applies to fish and other ectotherms, but with the terminology SMR (standard metabolic rate) instead of BMR.
- SMR must be measured at a standard ambient temperature because ectotherm metabolic rate varies dramatically with temperature.
- In fish, O2 is extracted from water (not air) through gill countercurrent exchange. The fundamental Fick principle is identical — $\dot{V}O_2 = \dot{Q}(C_aO_2 - C_{\bar{v}}O_2)$.
- The same graphical solution applies: the rectangle expands with exercise as both cardiac output and the a-v O2 difference increase.
- This illustrates that the same physical principles of O2 delivery govern gas exchange across all vertebrates, from fish to mammals.
Slide 22
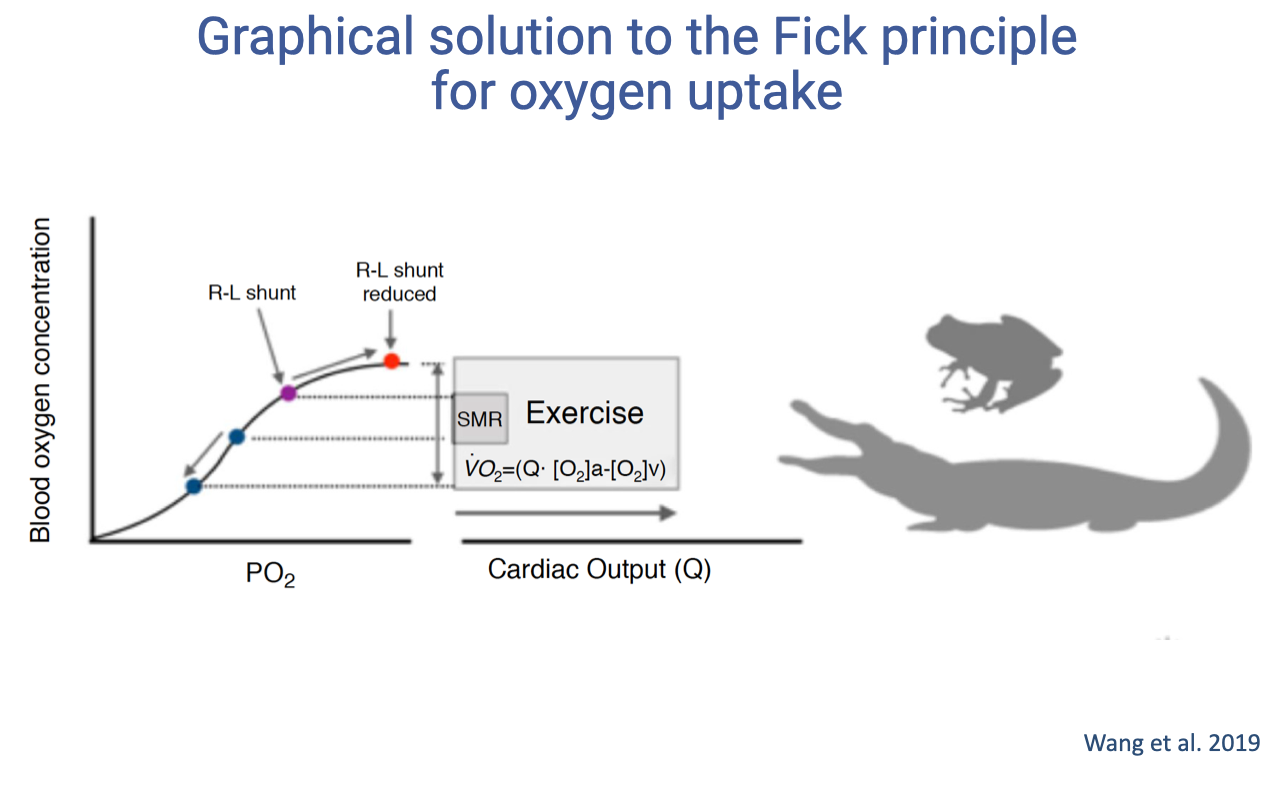
Graphical Fick Solution: Animals with Cardiac Shunts
- In animals with incomplete ventricular division (amphibians, non-crocodilian reptiles), a right-to-left shunt exists at rest.
- At rest: arterial blood is not fully oxygenated because deoxygenated blood mixes in the ventricle — the arterial point falls below 100% on the curve.
- During exercise: the shunt is reduced due to changes in cardiac fluid dynamics as the heart pumps harder. This means:
- Arterial saturation increases (moves up the curve toward full saturation)
- Venous saturation decreases (more O2 extracted by active tissues)
- The a-v O2 difference can therefore expand from both ends — a unique advantage.
- This enables a large increase in O2 delivery even with a relatively modest change in cardiac output.
- The shunt acts as a functional switch: costly at rest (lower arterial saturation) but enabling a rapid boost in O2 delivery during exercise.
Slide 23
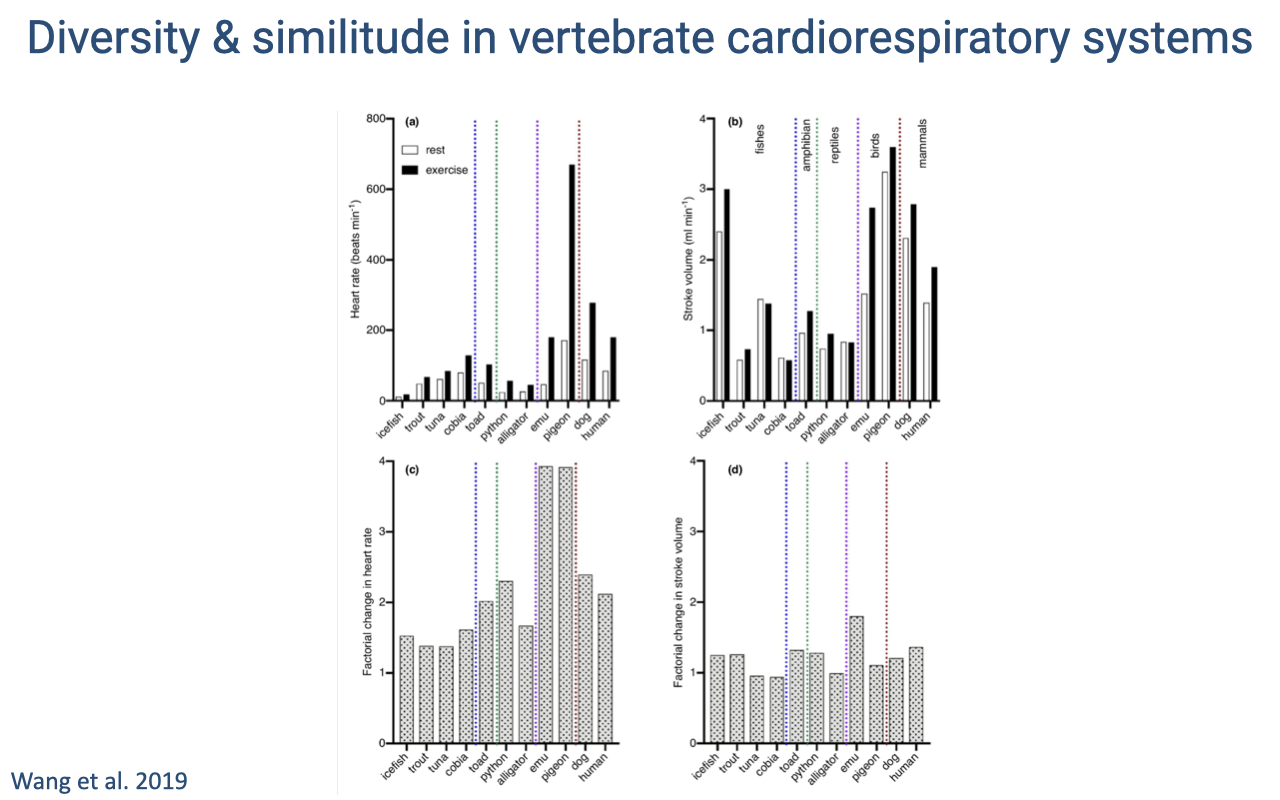
Comparative Cardiovascular Parameters Across Species
- Bar graphs compare cardiovascular parameters (heart rate, stroke volume, cardiac output) across diverse vertebrate species at rest and during exercise.
- Species are grouped by color: fish/amphibians, reptiles, birds, and mammals.
- The factorial change in heart rate between rest and exercise (bottom-right panel) shows that birds exhibit the largest increases — consistent with their exceptionally efficient respiratory and cardiovascular systems.
- Birds not only have more efficient lungs but also show a greater increase in cardiac output during exercise, which is one reason they are among the most impressive vertebrate athletes.
- Flight is an extremely energy-demanding activity, requiring both high cardiac output and efficient gas exchange.
Slide 24
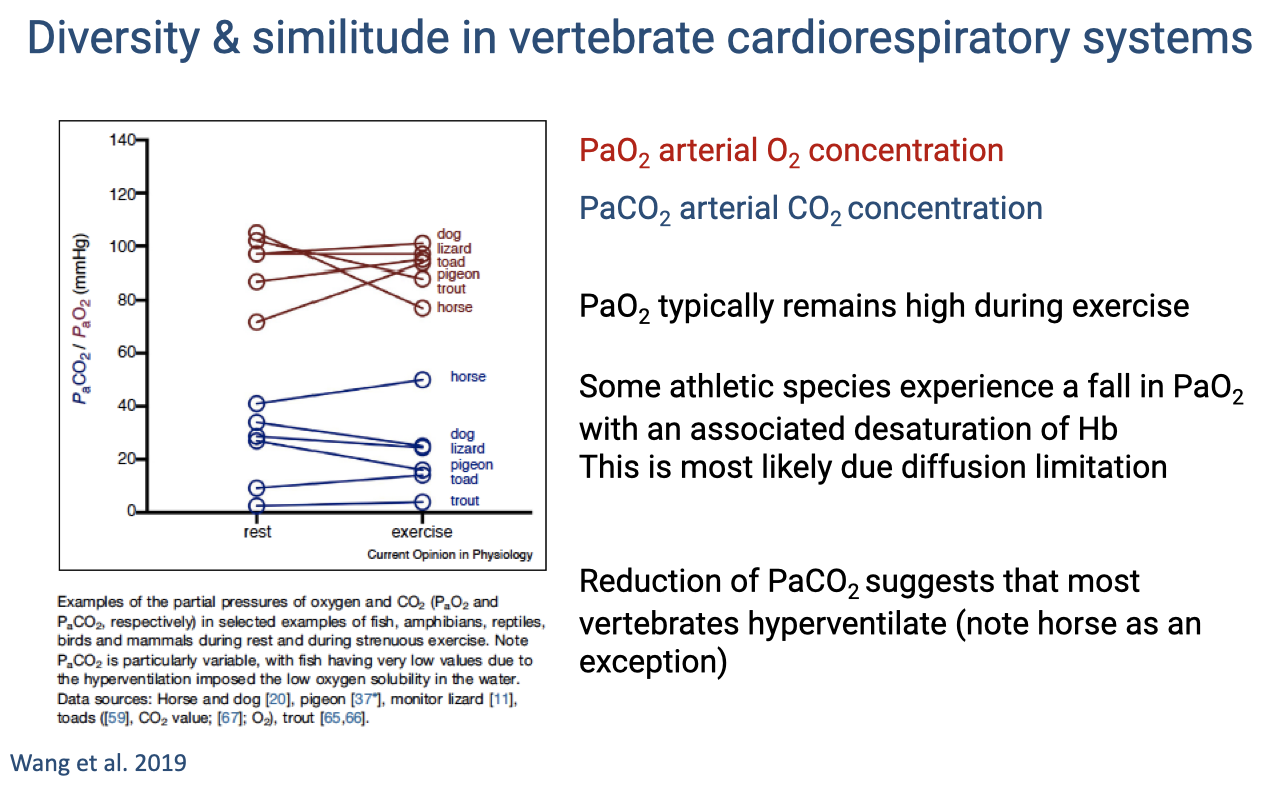
Arterial Blood Gases During Exercise Across Species
- PaO2 (red lines) typically remains high during exercise across most vertebrate species — the lungs maintain adequate oxygenation of arterial blood.
- Exception: the horse shows a significant decline in PaO2 during exercise — one of the elite athletes experiencing EIAH, most likely due to diffusion limitation in the lungs.
- PaCO2 (blue lines) typically declines during exercise in most species, suggesting that most vertebrates hyperventilate relative to their metabolic CO2 production.
- The horse is again an exception — maintaining or slightly increasing PaCO2.
- PaCO2 in fish is particularly variable due to the low O2 solubility of water, which imposes additional constraints on the hyperventilation response.
Slide 25
![Slide titled "Diversity & similitude in aerobic scope." Subtitle: "Factorial Aerobic scope: VO2max/SMR." A log-log scatter plot from Weibel et al. (2004) shows body mass (g) on the x-axis (0.01 to 1000 kg) and factorial aerobic scope on the y-axis (5 to approximately 50). Two regression lines are shown: one for mammals (fAS = 8.29 M^0.148, r² = 0.448) and one for all species (fAS = 17.66 M^0.244, r² = 0.866). The slope increases with body size. Text notes: "SMR = standard metabolic rate (~BMR in mammals)" and "fAS: 5–10 across diverse species, positive correlation with (1) heart mass relative to body mass, and (2) hemoglobin concentrations ([Hb])."](/E183_ExercisePhysiology/week03/images/lec08/slide-025.png)
Factorial Aerobic Scope Across Species
- Factorial aerobic scope (fAS) is the ratio of VO2max to standard metabolic rate (SMR), reflecting an animal’s capacity for aerobic exercise above baseline.
- Most vertebrates have a fAS of 5–10×, meaning maximum O2 uptake is 5–10 times the resting rate.
- Factorial aerobic scope shows a positive correlation with body mass — larger animals tend to have higher aerobic scope.
- The most athletic species (horses, birds in flight) can reach fAS values up to ~50×.
- Animals with high aerobic scope tend to have:
- A relatively large heart relative to body mass — enabling high cardiac output
- Higher hemoglobin concentrations — increasing blood O2-carrying capacity
- Some species (e.g., horses) have large spleens that release stored red blood cells during exercise, rapidly boosting hemoglobin concentration.
Slide 26
Transition: Cardiovascular Responses to Exercise
- The lecture now transitions from the comparative and mechanistic overview to the specific cardiovascular adjustments that occur during exercise in humans and other vertebrates.
- Topics include: heart rate and stroke volume dynamics, the Frank-Starling mechanism, effects of training, blood flow redistribution, and cardiovascular drift.
Slide 27
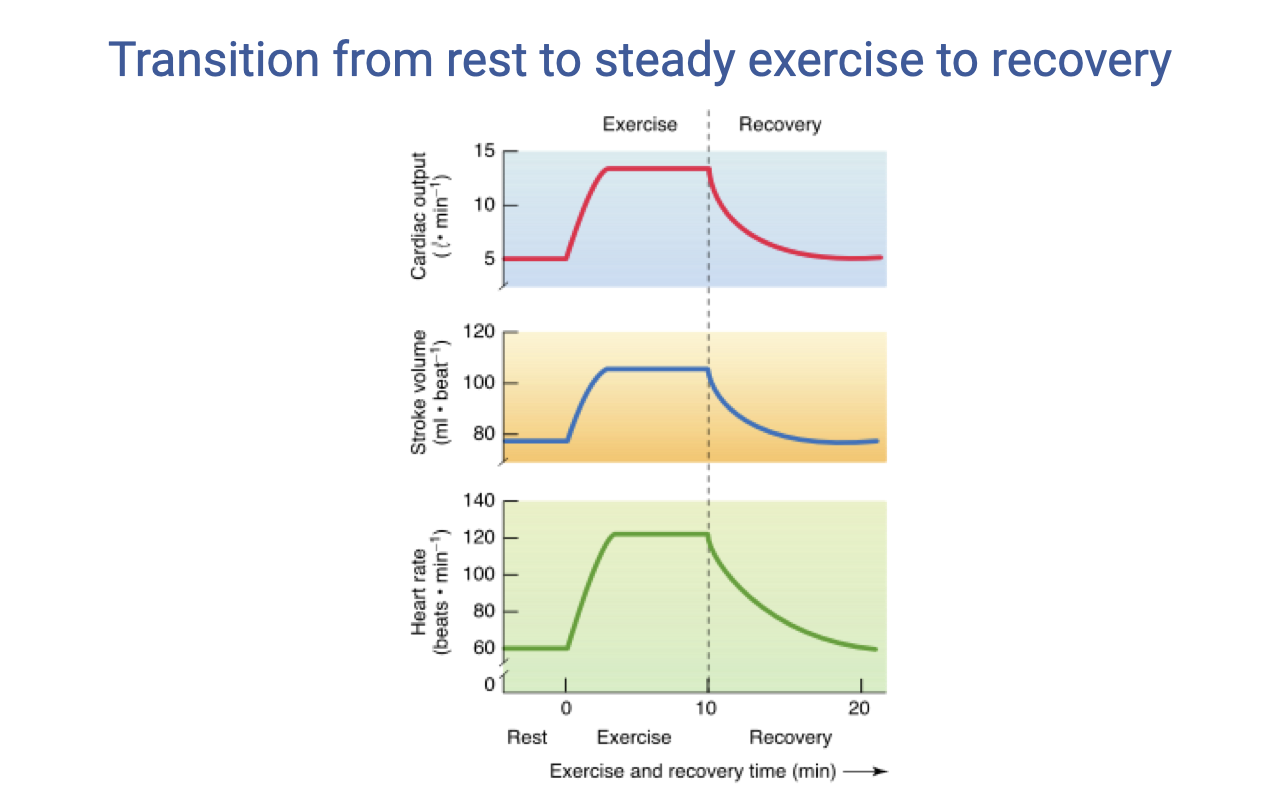
Transition from Rest to Steady Exercise to Recovery
- At exercise onset, all three components show a rapid increase:
- Cardiac output rises sharply from ~5 to ~15 L/min
- Stroke volume increases modestly from ~80 to ~120 mL and then plateaus
- Heart rate rises sharply from ~70 to ~160 beats/min
- During steady-state exercise, cardiac output and stroke volume maintain relatively stable levels.
- During recovery, all parameters gradually return toward resting values, with a characteristic lag.
- The rate of heart rate recovery after exercise is an indicator of cardiovascular fitness — faster recovery indicates better fitness. This is one of the metrics tracked by modern fitness watches.
Slide 28
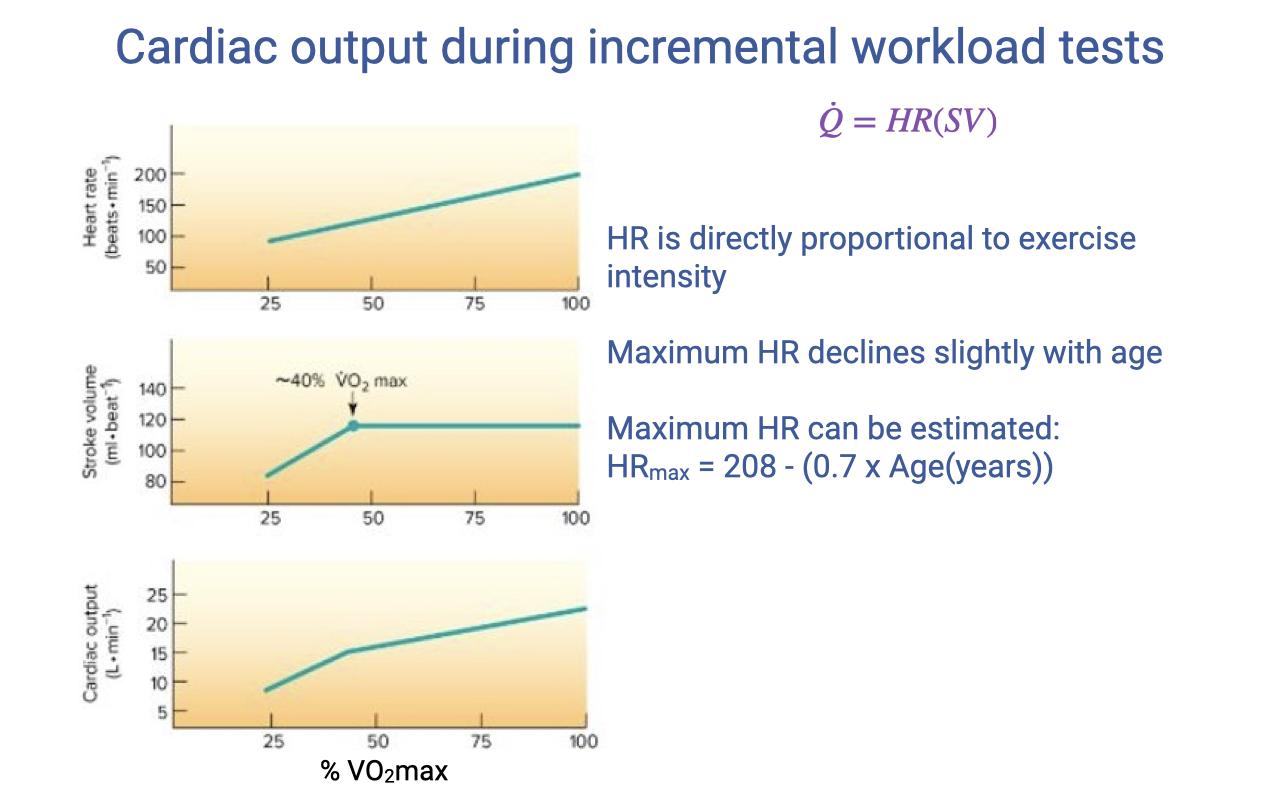
Heart Rate, Stroke Volume, and Cardiac Output During Incremental Exercise
- Heart rate (HR) increases approximately linearly with exercise intensity across the full range of % VO2max.
- Stroke volume (SV) increases at low work rates but plateaus at approximately 40% VO2max. At very high heart rates, diastolic filling time shortens, limiting further SV increases.
- Cardiac output ($\dot{Q} = HR \times SV$) rises linearly at low work rates. Above the SV plateau, continued increases in $\dot{Q}$ depend primarily on rising HR.
- Maximum heart rate declines slightly with age and can be estimated:
- There is substantial individual variability (±10–15 bpm) around this estimate, depending on training history and body size.
Slide 29
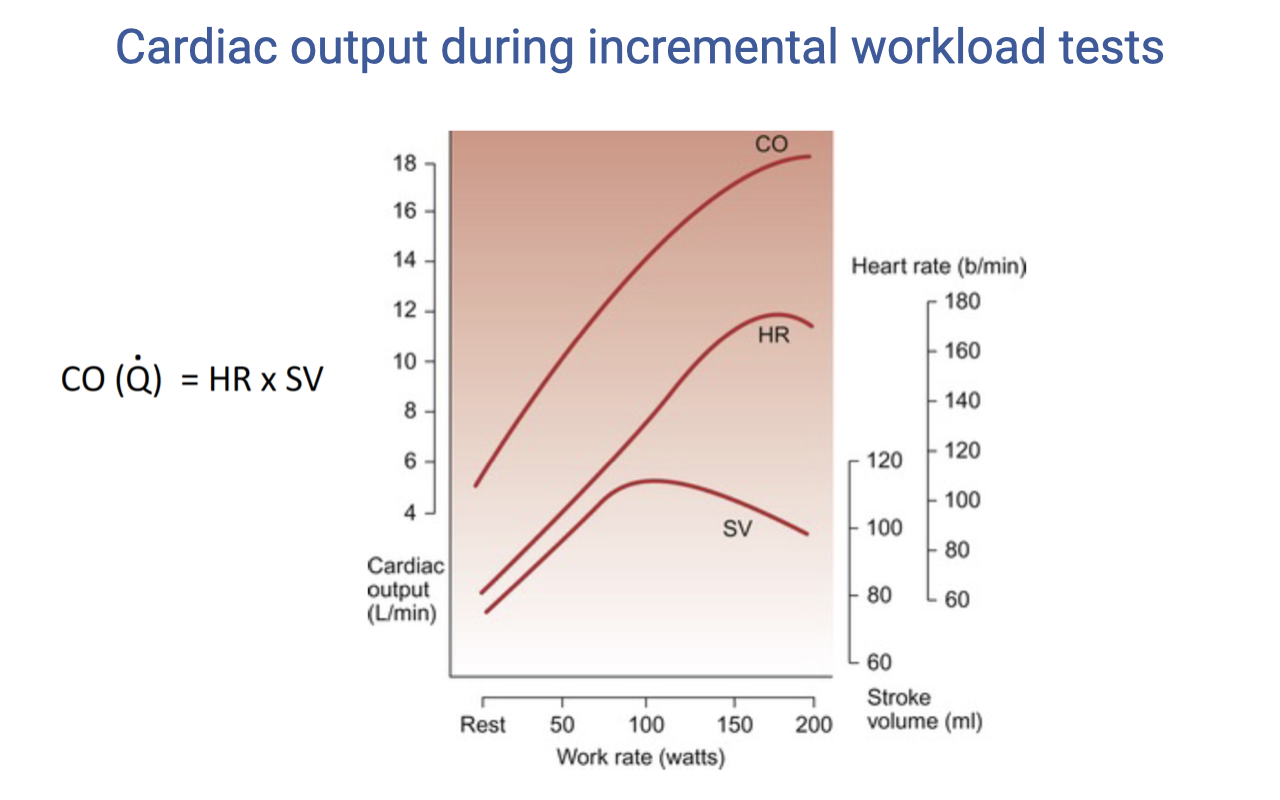
Stroke Volume at Very High Work Rates
- At very high work rates, stroke volume may actually decrease slightly — this occurs because extremely fast heart rates reduce diastolic filling time.
- The Frank-Starling mechanism depends on adequate venous return filling the ventricle during diastole. At extreme heart rates, the interval between beats becomes too short for complete filling, reducing end-diastolic volume and therefore SV.
- This represents operating at the limits of the cardiovascular system for that individual.
- Despite the SV plateau (or slight decline), cardiac output continues to increase because heart rate continues to rise — but the rate of $\dot{Q}$ increase slows.
Slide 30
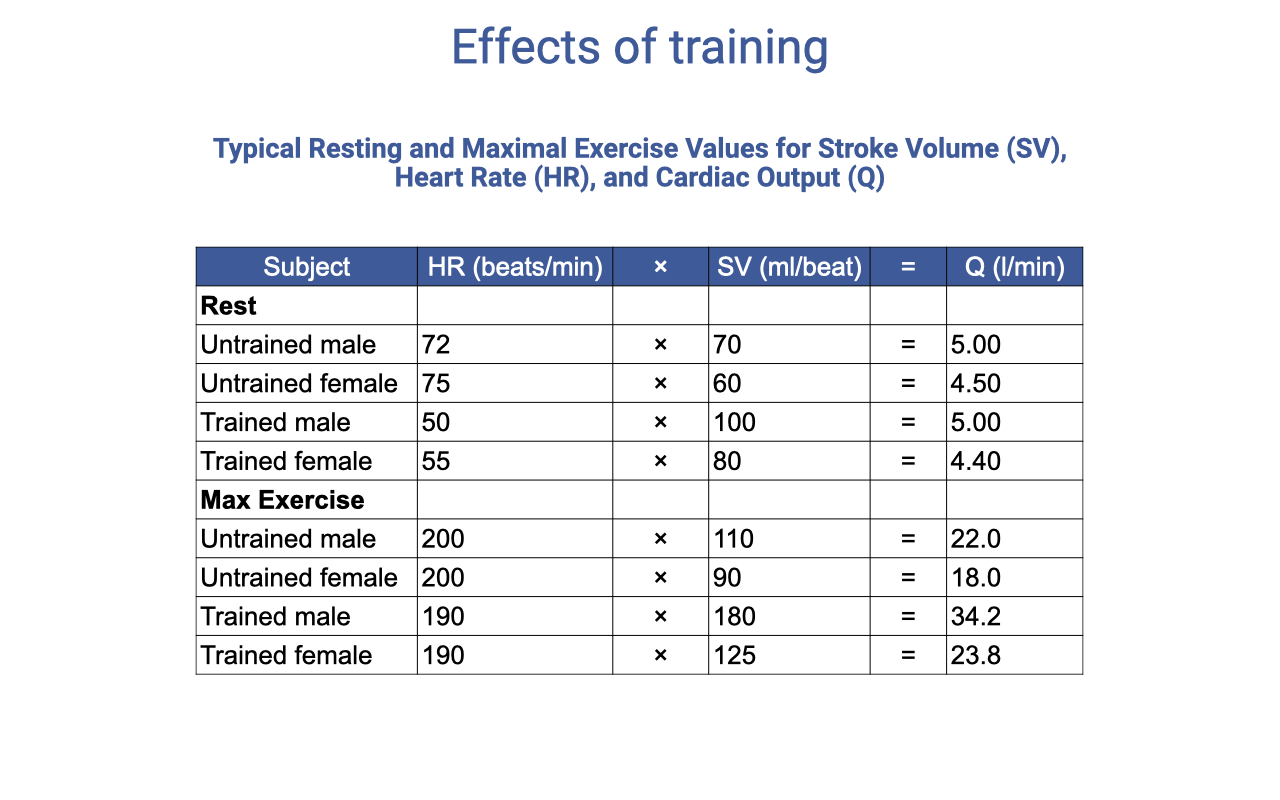
Effects of Training on Cardiovascular Parameters
| Subject | Rest HR (b/min) | Rest SV (mL) | Rest Q̇ (L/min) | Max HR (b/min) | Max SV (mL) | Max Q̇ (L/min) |
|---|---|---|---|---|---|---|
| Untrained male | 72 | 70 | 5.00 | 200 | 110 | 22.0 |
| Untrained female | 75 | 60 | 4.50 | 200 | 90 | 18.0 |
| Trained male | 50 | 100 | 5.00 | 190 | 180 | 34.2 |
| Trained female | 55 | 80 | 4.40 | 190 | 125 | 23.8 |
- Resting cardiac output is similar between trained and untrained individuals — the same blood flow is needed at rest regardless of fitness.
- Trained individuals have a lower resting heart rate because their stroke volume is higher (cardiac hypertrophy increases the volume of blood ejected per beat).
- Maximum heart rate changes very little with training (~190 vs. 200 b/min).
- The main training effect is a large increase in maximum stroke volume — trained males can achieve 180 mL vs. 110 mL untrained — which drives the increase in maximum cardiac output (34.2 vs. 22.0 L/min).
Slide 31
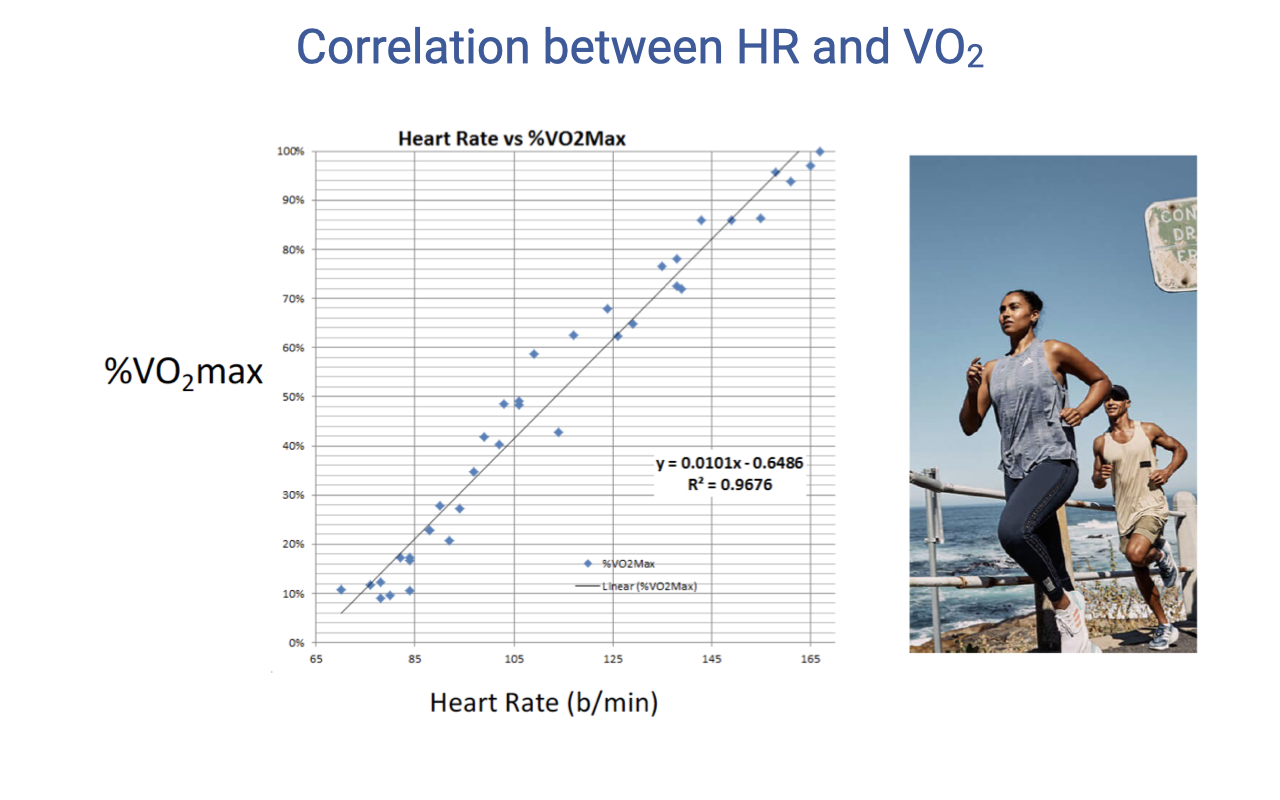
Correlation Between Heart Rate and VO2
- There is a strong linear relationship between heart rate and % VO2max (R² = 0.97).
- This linear correlation is physiologically useful because VO2 is difficult to measure directly during exercise (requires a mask and metabolic cart).
- Heart rate is easily and continuously measurable using fitness watches and heart rate monitors.
- Modern fitness watches exploit this relationship to estimate VO2 from heart rate data, using population-level normative data sets.
- The accuracy of these estimates depends on individual variability in the HR–VO2 relationship, which is influenced by training history, body size, and genetics.
Slide 32
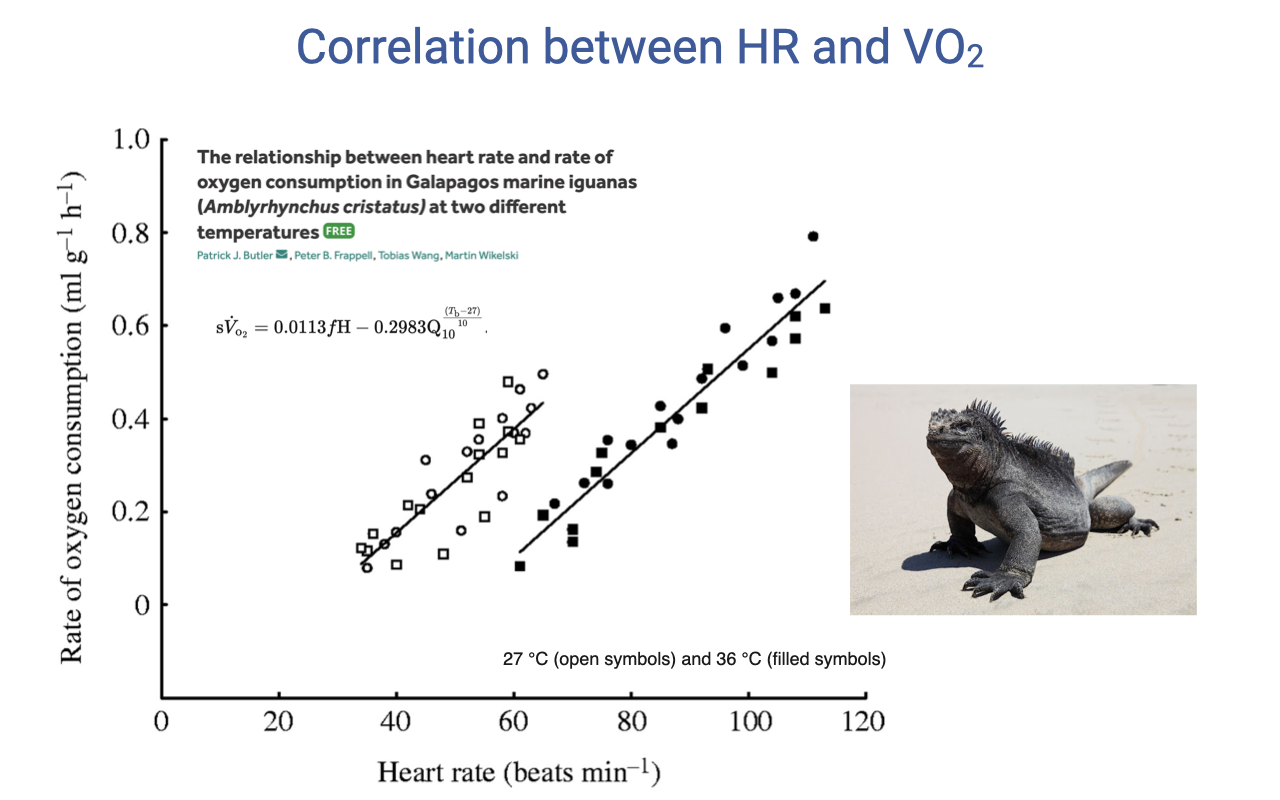
HR–VO2 Correlation in Ectotherms
- The linear relationship between heart rate and VO2 holds not just for humans but also for other vertebrates, including Galápagos marine iguanas.
- However, in ectotherms the relationship is temperature-dependent — different regression lines for 27°C vs. 36°C body temperature.
- At higher body temperature, the metabolic rate is higher at any given heart rate, shifting the relationship upward.
- This temperature dependence is expected because ectotherm metabolic rate varies directly with body temperature, unlike endotherms where core temperature is tightly regulated.
- This comparative finding reinforces the fundamental physiological principle that heart rate tracks metabolic demand, but the specific relationship varies with species and environmental conditions.
Slide 33
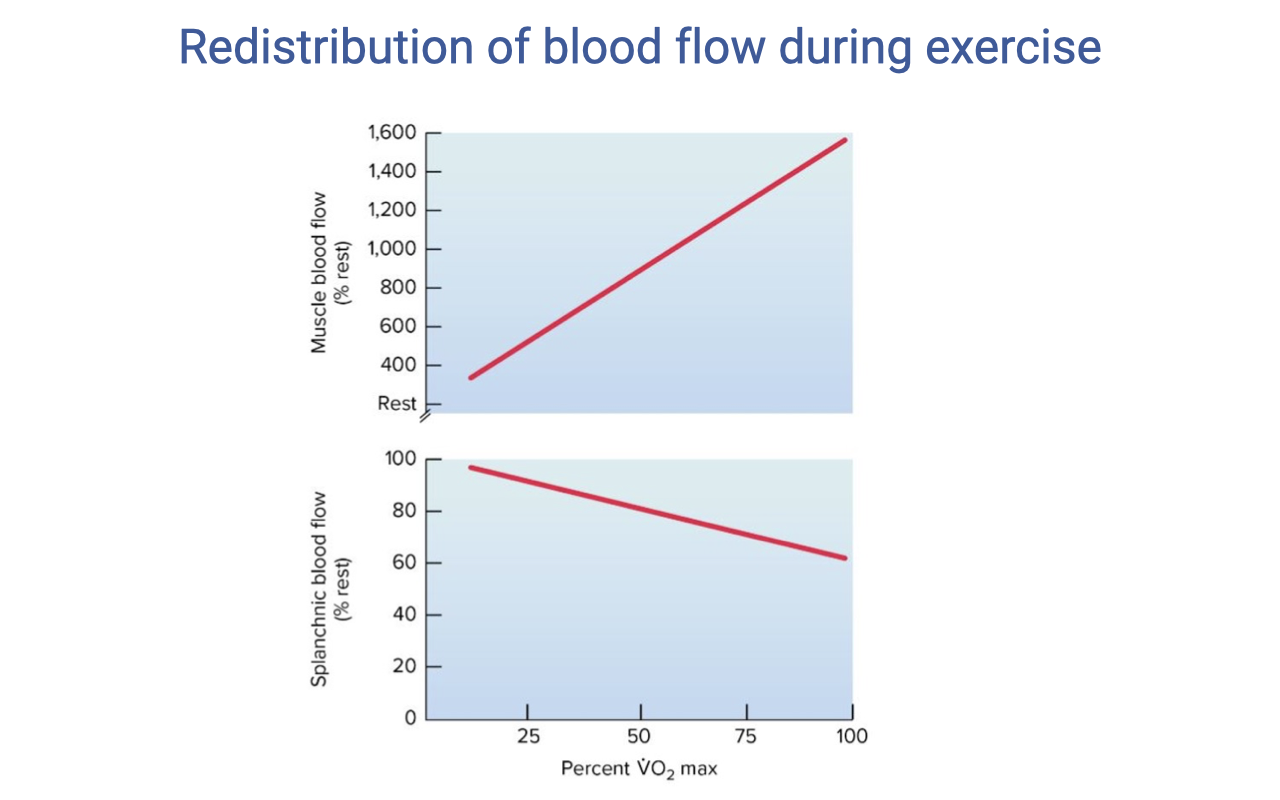
Redistribution of Blood Flow During Exercise
- During exercise, blood flow is dramatically redistributed from non-essential organs to working muscles:
- Muscle blood flow increases steeply — from ~400 mL at rest to ~1500 mL at maximal exercise.
- Splanchnic (digestive organ) blood flow decreases from ~100 mL to near 20 mL.
- This redistribution is mediated by:
- Sympathetic vasoconstriction — norepinephrine acting on α-adrenergic receptors constricts arterioles in non-essential organs (gut, kidney, inactive muscle).
- Local metabolic vasodilation — CO2, H+, adenosine, nitric oxide, and K+ accumulating in active muscles dilate local arterioles, overriding sympathetic tone.
- The net effect: up to 80–85% of cardiac output is directed to working muscles during heavy exercise, compared to only 15–20% at rest.
Slide 34
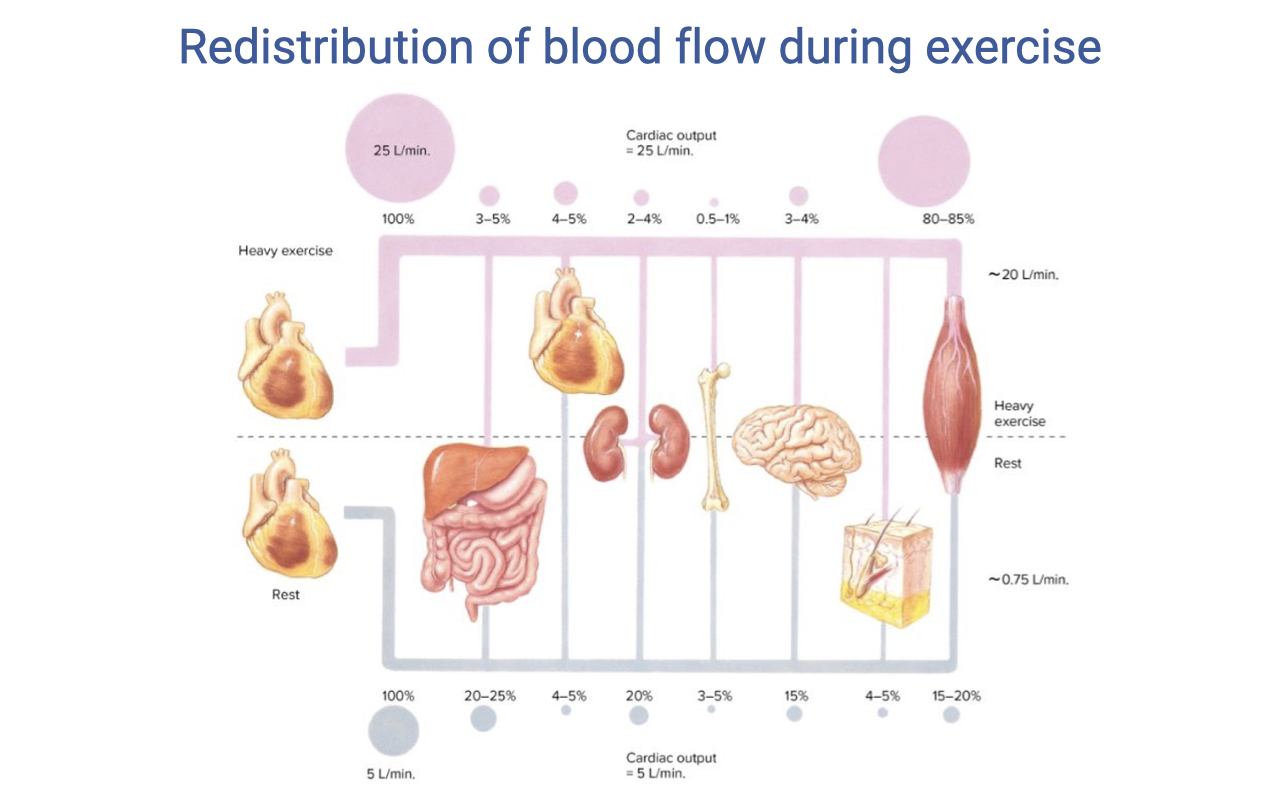
Blood Flow Distribution: Rest vs. Heavy Exercise
- At rest (cardiac output ~5 L/min):
- Skeletal muscle: ~15–20%
- Splanchnic organs: ~20–25%
- Kidneys: ~20%
- Brain: ~15%
- Heart: ~4–5%
- Skin and other organs: remaining share
- During heavy exercise (cardiac output ~25 L/min):
- Skeletal muscle: 80–85%
- Splanchnic organs: ~3–5%
- Kidneys: ~3–5%
- Brain and heart: absolute flow maintained, but a smaller percentage of the much larger total cardiac output
- Skin: initially reduced, then increases as core temperature rises (thermoregulatory competition for cardiac output)
- Brain and heart circulations are never vasoconstricted — they are protected at all intensities.
Slide 35
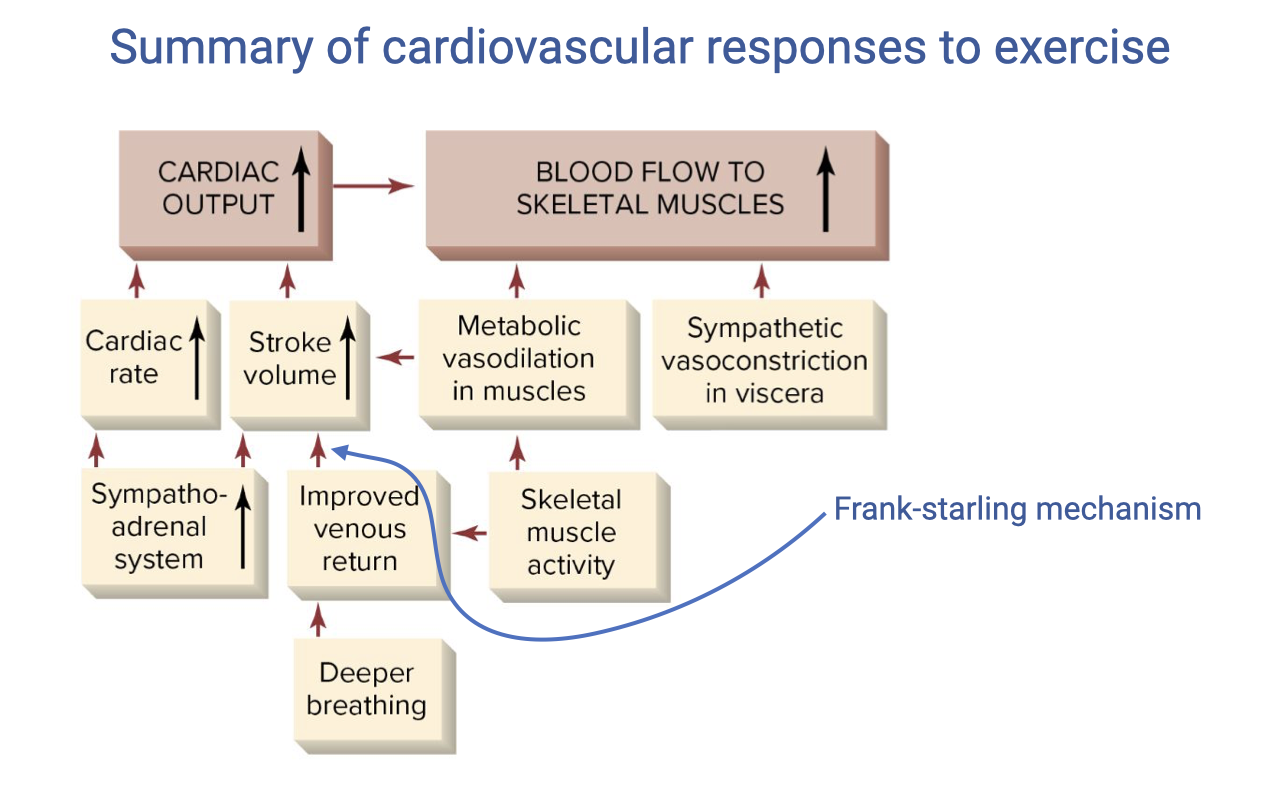
Summary: Cardiovascular Responses to Exercise
- Cardiac output increases through two mechanisms:
- Heart rate — increased by the sympatho-adrenal system (sympathetic stimulation + circulating epinephrine) and parasympathetic withdrawal
- Stroke volume — increased by:
- Improved venous return via the skeletal muscle pump (contracting muscles compress veins) and the respiratory pump (deeper breathing creates greater intrathoracic pressure swings)
- Frank-Starling mechanism — greater venous return stretches the ventricle, producing stronger contractions
- Increased contractility from sympathetic stimulation (positive inotropy)
- Blood flow to skeletal muscles increases through:
- Metabolic vasodilation in active muscles (local accumulation of CO2, H+, adenosine, NO, K+)
- Sympathetic vasoconstriction in visceral organs (gut, kidney) diverts blood to muscles
Slide 36
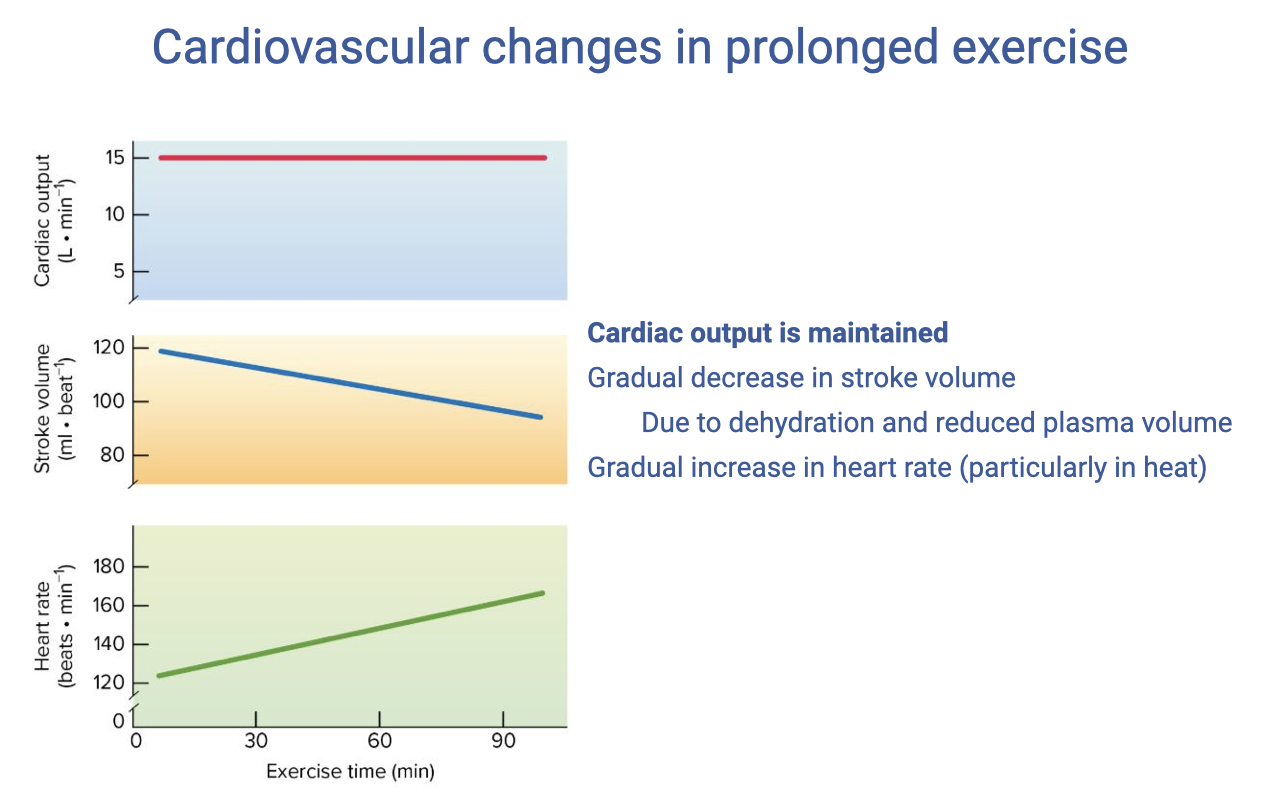
Cardiovascular Drift During Prolonged Exercise
- During prolonged exercise (especially in warm environments), a characteristic pattern called cardiovascular drift emerges:
- Cardiac output is maintained at a relatively stable level
- Stroke volume gradually decreases — from ~120 mL to ~95 mL over 50 minutes
- Heart rate progressively increases to compensate — from ~150 to ~180 beats/min
- The mechanism: dehydration from sweating reduces plasma volume → less venous return → lower end-diastolic volume → reduced stroke volume (Frank-Starling mechanism).
- Heart rate increases reflexively to maintain the cardiac output needed for the constant work rate.
- Practical consequence: athletes using heart rate to regulate pace must slow down to maintain a target HR in a dehydrated state, because the same work rate now requires a higher HR.
Slide 37
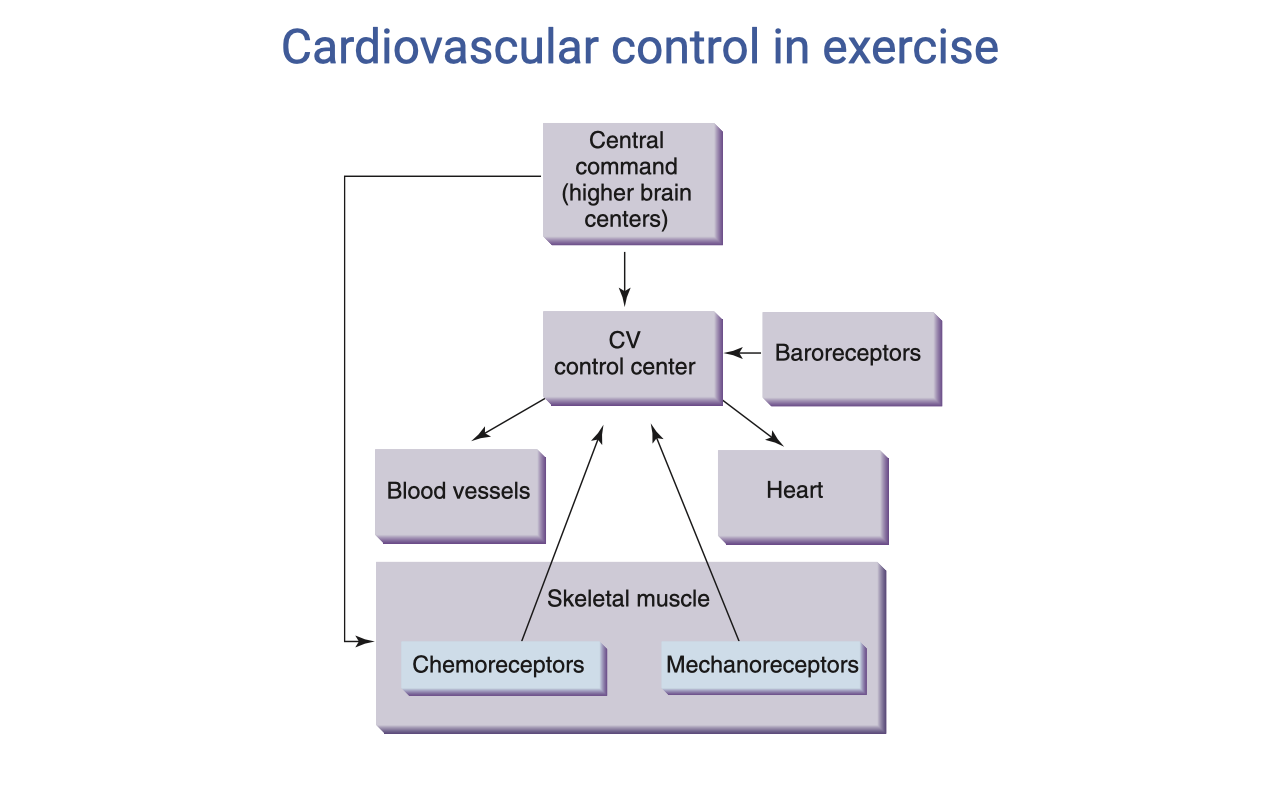
Cardiovascular Control in Exercise
- The cardiovascular (CV) control center integrates multiple inputs to coordinate the cardiovascular response:
- Central command (higher brain centers) — anticipatory, feed-forward drive at exercise onset (parallel to ventilatory central command)
- Baroreceptors — sense arterial blood pressure and adjust to maintain appropriate MAP
- The CV control center modulates:
- Blood vessels — vasoconstriction/vasodilation to redirect blood flow
- Heart — heart rate (chronotropy) and contractility (inotropy)
- Skeletal muscle provides feedback via:
- Chemoreceptors — detect metabolic byproducts (H+, K+, adenosine) — the exercise pressor reflex
- Mechanoreceptors — detect mechanical activity and contribute to the rapid cardiovascular response at exercise onset
- This control scheme parallels the ventilatory control system, reflecting the tight coordination required between breathing and circulation.
Slide 38

Questions
- Open question-and-answer session for students to clarify concepts from the lecture.
Slide 39
Lecture 7 — Key Takeaways
- The oxygen-hemoglobin dissociation curve has a sigmoid shape. The steep portion (~20–60 mmHg) enables efficient O2 loading in the lungs and unloading at the tissues. At rest, venous blood is still ~75% saturated — a large reserve exists for exercise.
- The Bohr effect (decreased pH → rightward shift) and temperature effect (increased temperature → rightward shift) both enhance O2 unloading at active muscle tissue during exercise. These effects are localized, directing O2 where it is most needed.
- Myoglobin acts as an intramuscular O2 shuttle (capillary → mitochondria) and as an O2 store that buffers demand at exercise onset before the cardiopulmonary system ramps up.
- The graphical Fick solution shows that total O2 delivery = cardiac output × a-v O2 difference. In mammals/birds, expansion comes from both higher $\dot{Q}$ and a wider a-v difference. In animals with cardiac shunts, the arterial side can also increase during exercise.
- Heart rate increases linearly with exercise intensity; stroke volume plateaus at ~40% VO2max. Training primarily increases maximum stroke volume, not maximum heart rate.
- Blood flow redistribution during exercise directs up to 80–85% of cardiac output to working muscles via sympathetic vasoconstriction of non-essential organs and local metabolic vasodilation in active muscles.
- Cardiovascular drift during prolonged exercise reflects dehydration-induced reduction in stroke volume compensated by rising heart rate to maintain cardiac output.
Key Equations
| Equation | Name | Description |
|---|---|---|
| $\dot{V}O_2 = \dot{Q}(C_aO_2 - C_{\bar{v}}O_2)$ | Fick principle (cardiovascular) | O2 consumption from cardiac output and the arteriovenous O2 content difference |
| $\dot{Q} = HR \times SV$ | Cardiac output | Cardiac output (L/min) equals heart rate (beats/min) times stroke volume (mL/beat) |
| $\%\text{Sat} = \frac{[O_2]}{O_2 \text{ capacity}} \times 100$ | Hemoglobin percent saturation | Fraction of hemoglobin binding sites occupied by O2; O2 capacity ≈ 1.34 mL O2/g Hb |
| $HR_{max} \approx 208 - (0.7 \times \text{Age})$ | Age-predicted maximum heart rate | Estimates maximum heart rate (beats/min) from age; substantial individual variability (±10–15 bpm) |
| $fAS = \frac{\dot{V}O_2\text{max}}{SMR}$ | Factorial aerobic scope | Ratio of maximum O2 uptake to standard (or basal) metabolic rate; typically 5–10× in vertebrates |
Glossary of Key Terms
| Term | Definition |
|---|---|
| Oxygen-hemoglobin dissociation curve | The sigmoid-shaped curve describing the relationship between PO₂ and hemoglobin O2 saturation; determines O2 loading and unloading characteristics. |
| Bohr effect | Rightward shift of the O2-hemoglobin dissociation curve at lower pH (higher CO2); promotes O2 unloading at metabolically active tissues. |
| Temperature effect (on Hb curve) | Rightward shift of the dissociation curve at higher temperature; exercising muscles generate heat locally, enhancing O2 release precisely where demand is highest. |
| Myoglobin (Mb) | An O2-binding protein in muscle cells with higher O2 affinity than hemoglobin; acts as an intramuscular O2 shuttle from capillaries to mitochondria and as a short-term O2 store at exercise onset. |
| a-v O2 difference | The difference in O2 content between arterial and mixed venous blood; reflects the amount of O2 extracted by tissues per unit of blood. Widens from ~5 to ~16 mL O2/dL from rest to maximal exercise. |
| Cardiac output ($\dot{Q}$) | Volume of blood pumped per minute by one ventricle; product of heart rate and stroke volume (L/min). |
| Stroke volume (SV) | Volume of blood ejected by one ventricle per heartbeat (mL/beat); increases with training due to cardiac hypertrophy. |
| Frank-Starling mechanism | Intrinsic cardiac property where greater venous return stretches the ventricle during diastole, producing a stronger contraction and higher stroke volume. |
| Cardiac shunt | Mixing of oxygenated and deoxygenated blood in animals with incompletely divided ventricles; reduces arterial O2 saturation at rest but can be reduced during exercise to boost O2 delivery. |
| Graphical Fick solution | Visualization of total O2 delivery as a rectangle where width = cardiac output and height = a-v O2 difference; area = VO2. |
| Standard metabolic rate (SMR) | The resting metabolic rate of an ectotherm measured at a standard ambient temperature; analogous to BMR in endotherms. |
| Factorial aerobic scope (fAS) | Ratio of VO2max to SMR (or BMR); typically 5–10× in vertebrates; animals with high fAS tend to have large hearts and high hemoglobin concentrations. |
| Cardiovascular drift | Progressive rise in heart rate and fall in stroke volume during prolonged exercise with dehydration; cardiac output is maintained but at a different HR–SV balance. |
| Blood flow redistribution | The shift of blood flow from non-essential organs (gut, kidney) to working skeletal muscles during exercise, mediated by sympathetic vasoconstriction and local metabolic vasodilation. |
| Sympathetic vasoconstriction | α-adrenergic receptor-mediated narrowing of arterioles in non-essential organs during exercise, diverting blood flow to active muscles. |
| Metabolic vasodilation | Local dilation of arterioles in active muscles caused by accumulation of CO2, H+, adenosine, nitric oxide, and K+; overrides sympathetic vasoconstriction in working muscles. |
| Exercise pressor reflex | Reflex increase in cardiovascular drive triggered by muscle chemoreceptors and mechanoreceptors detecting metabolic byproducts and mechanical activity during exercise. |