Slide 1
- Friday review and discussion session for Week 3.
- Consolidates the ventilatory and cardiovascular content from the week in preparation for the quiz.
- Includes a Q&A on material from the background reading, a think-pair-share conceptual activity, and a quantitative practice problem applying the Fick principle.
Slide 2
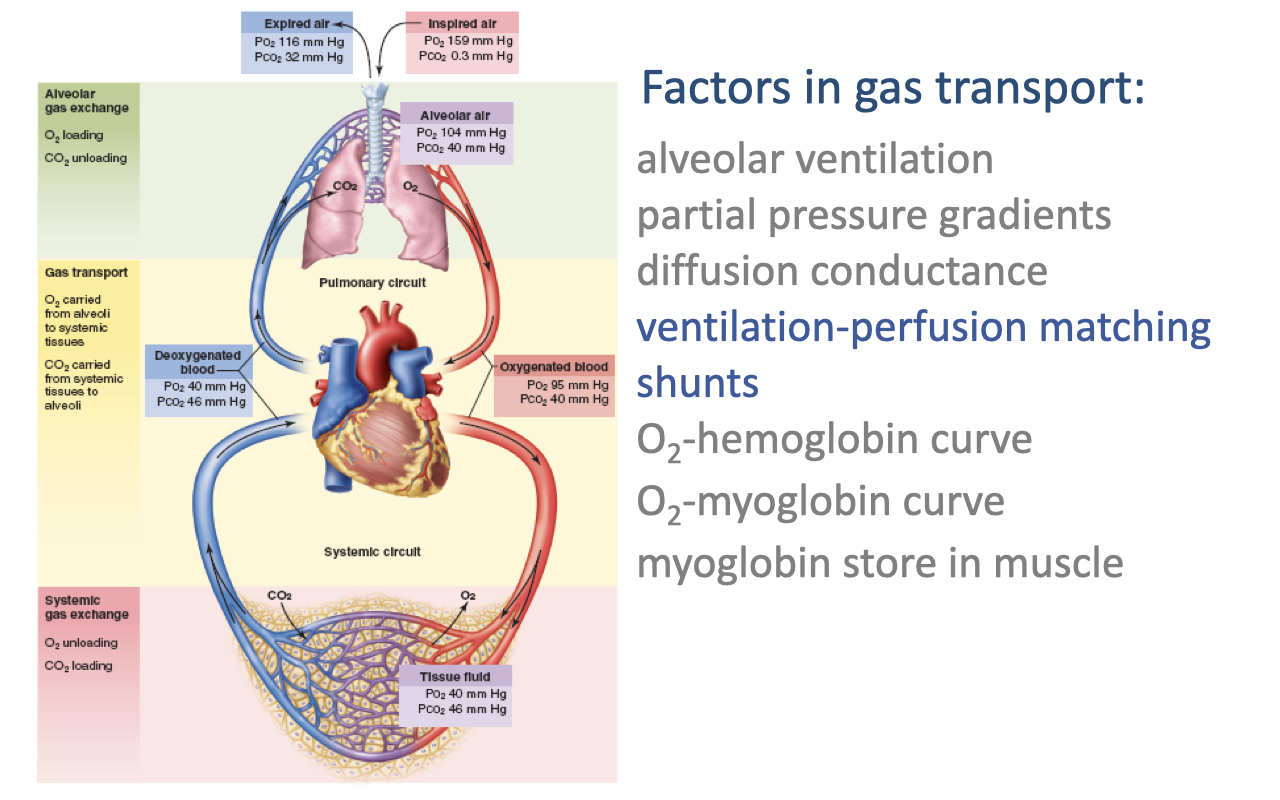
Factors in Gas Transport — Overview
- Effective transport of O2 from inspired air to mitochondria depends on several steps and the factors that govern each one:
- Alveolar ventilation — rate of fresh air delivery to the alveoli
- Partial pressure gradients — the driving force for diffusion at each interface
- Diffusion conductance — determined by membrane thickness and surface area
- Ventilation-perfusion matching — how closely airflow in the alveoli is matched to blood flow in the pulmonary capillaries
- Shunts — blood flow that bypasses the gas-exchange surface
- O2-hemoglobin dissociation curve — how arterial and venous PO₂ translate into hemoglobin saturation and blood O2 content
- O2-myoglobin curve and myoglobin store in muscle — facilitate O2 unloading at the tissue and buffer muscle O2 demand at exercise onset
Slide 3
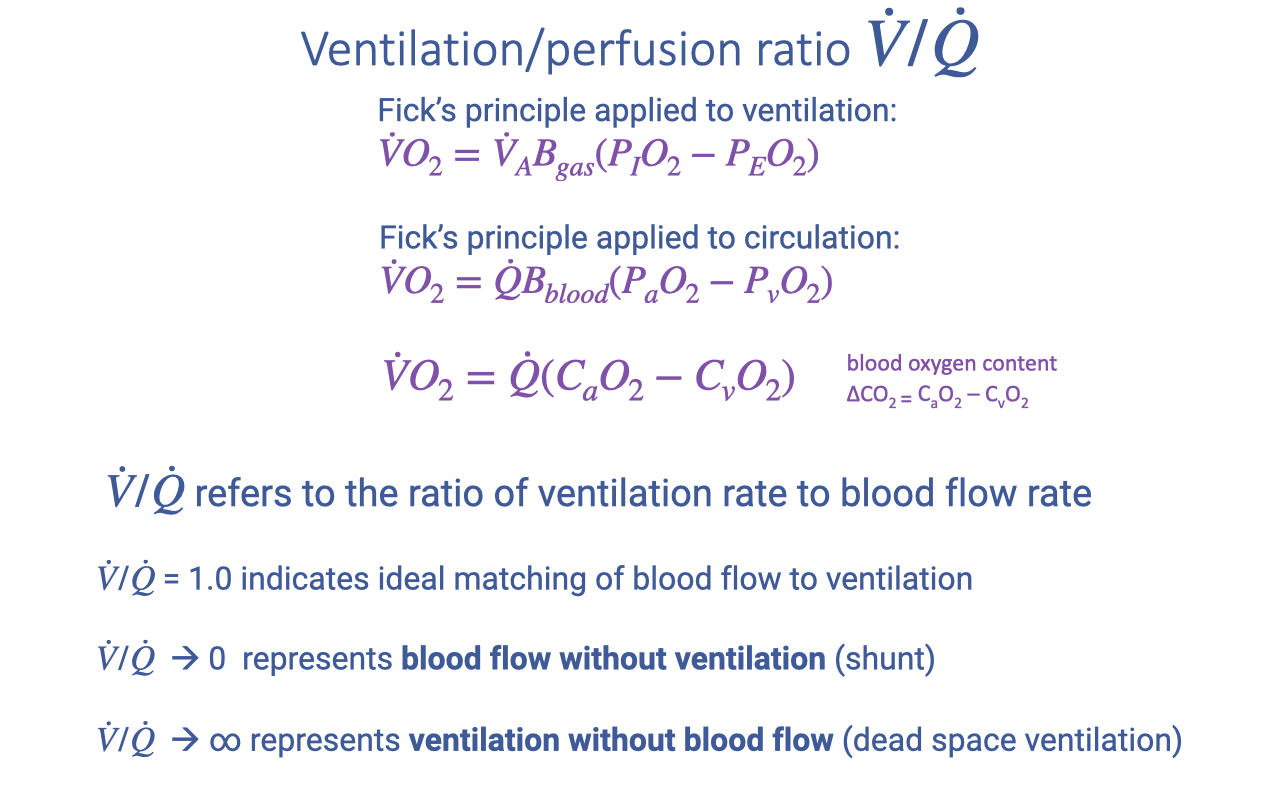
V/Q Ratio Connects the Two Fick Equations
- The same Fick principle framework applies to both the ventilatory and the circulatory steps of the oxygen cascade:
- Ventilatory Fick: $\dot{V}O_2 = \dot{V}_A B_{gas}(P_IO_2 - P_EO_2)$
- Circulatory Fick: $\dot{V}O_2 = \dot{Q} B_{blood}(P_aO_2 - P_vO_2)$
- Blood-content form: $\dot{V}O_2 = \dot{Q}(C_aO_2 - C_vO_2)$
- The ventilation-perfusion ratio ($\dot{V}/\dot{Q}$) is the ratio of alveolar ventilation rate to pulmonary blood flow rate:
- $\dot{V}/\dot{Q} \approx 1.0$ — ideal matching for efficient gas exchange
- $\dot{V}/\dot{Q} \to 0$ — blood flow without ventilation (shunt)
- $\dot{V}/\dot{Q} \to \infty$ — ventilation without blood flow (dead space ventilation)
Slide 4
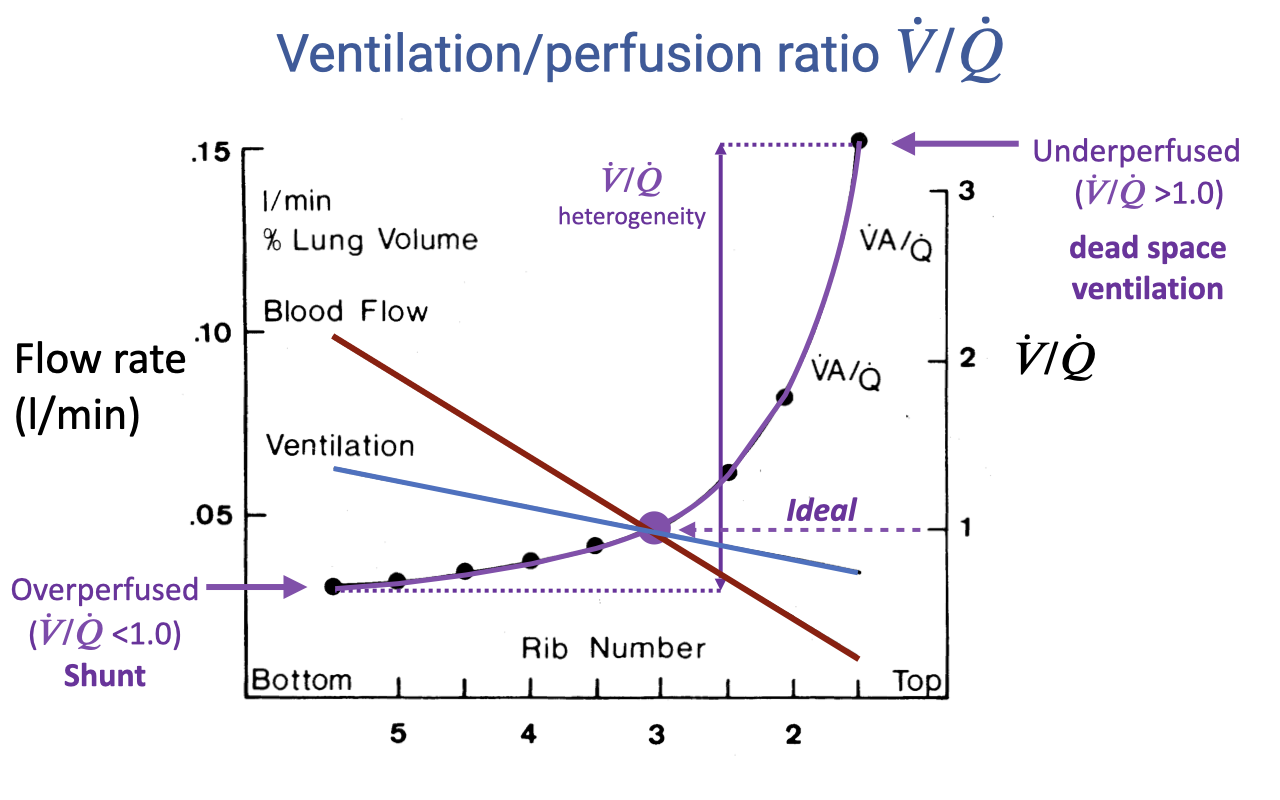
Regional V/Q Heterogeneity in the Upright Lung
- In an upright resting lung, both ventilation and perfusion decline from base to apex, but blood flow declines more steeply than ventilation due to the effect of gravity.
- The V/Q ratio therefore varies continuously across the lung:
- Base (rib 5): V/Q < 1.0 — overperfused relative to ventilation; behaves as functional shunt.
- Mid-lung (rib 3): V/Q ≈ 1.0 — ideal matching.
- Apex (rib 2): V/Q > 3.0 — underperfused relative to ventilation; behaves as dead space ventilation.
- The spread between the highest and lowest V/Q values defines V/Q heterogeneity — greater heterogeneity lowers overall gas-exchange efficiency.
Slide 5
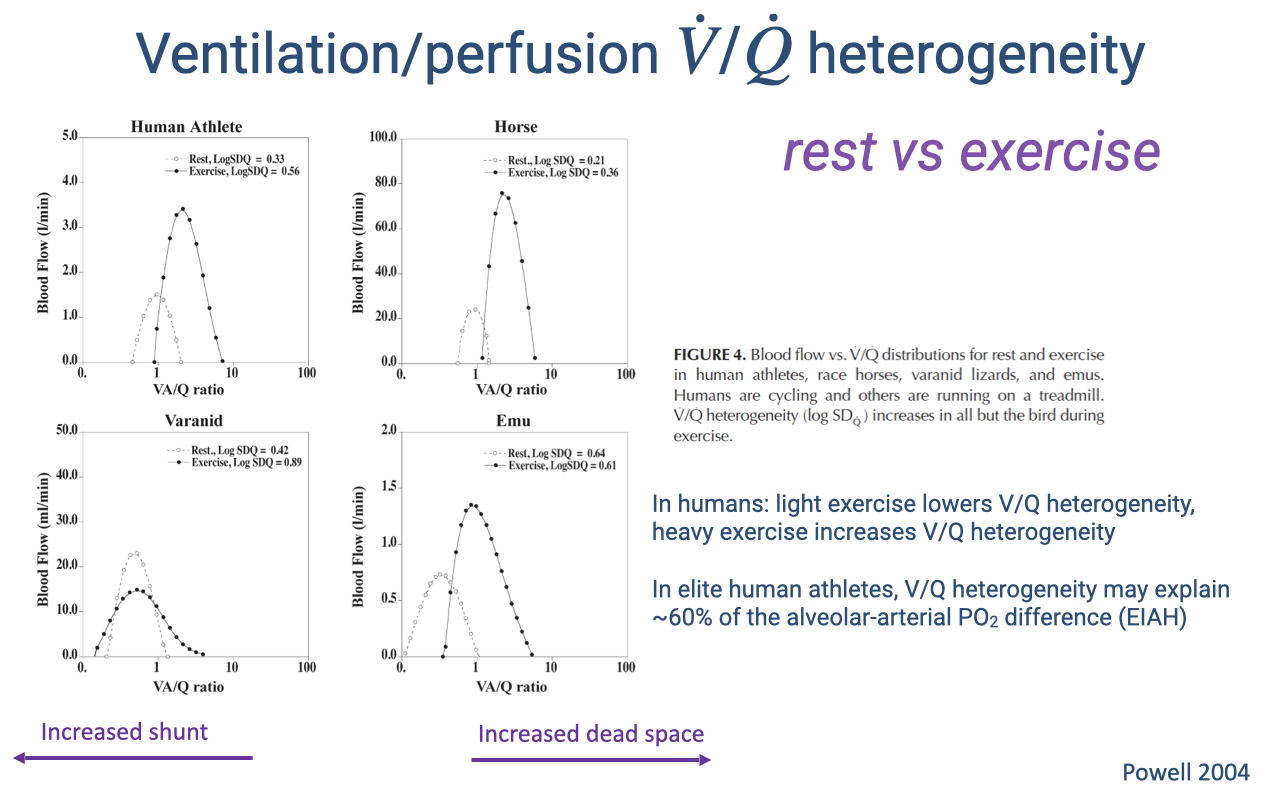
V/Q Heterogeneity at Rest and During Exercise Across Species
- The direction of the V/Q shift from rest to exercise differs among species:
- Human athletes — light exercise improves matching, but heavy exercise increases heterogeneity, contributing to exercise-induced arterial hypoxemia (EIAH).
- Horses — heterogeneity increases during exercise, consistent with EIAH in racehorses.
- Varanid lizards — exercise reduces the resting cardiac shunt, shifting the distribution rightward toward 1.0.
- Emus (birds) — distribution stays narrow and centered near 1.0 at both rest and exercise — the parabronchial lung maintains efficient V/Q matching regardless of exercise intensity.
- In elite human athletes, V/Q heterogeneity may account for roughly 60% of the alveolar-arterial PO₂ difference observed during heavy exercise.
Slide 6
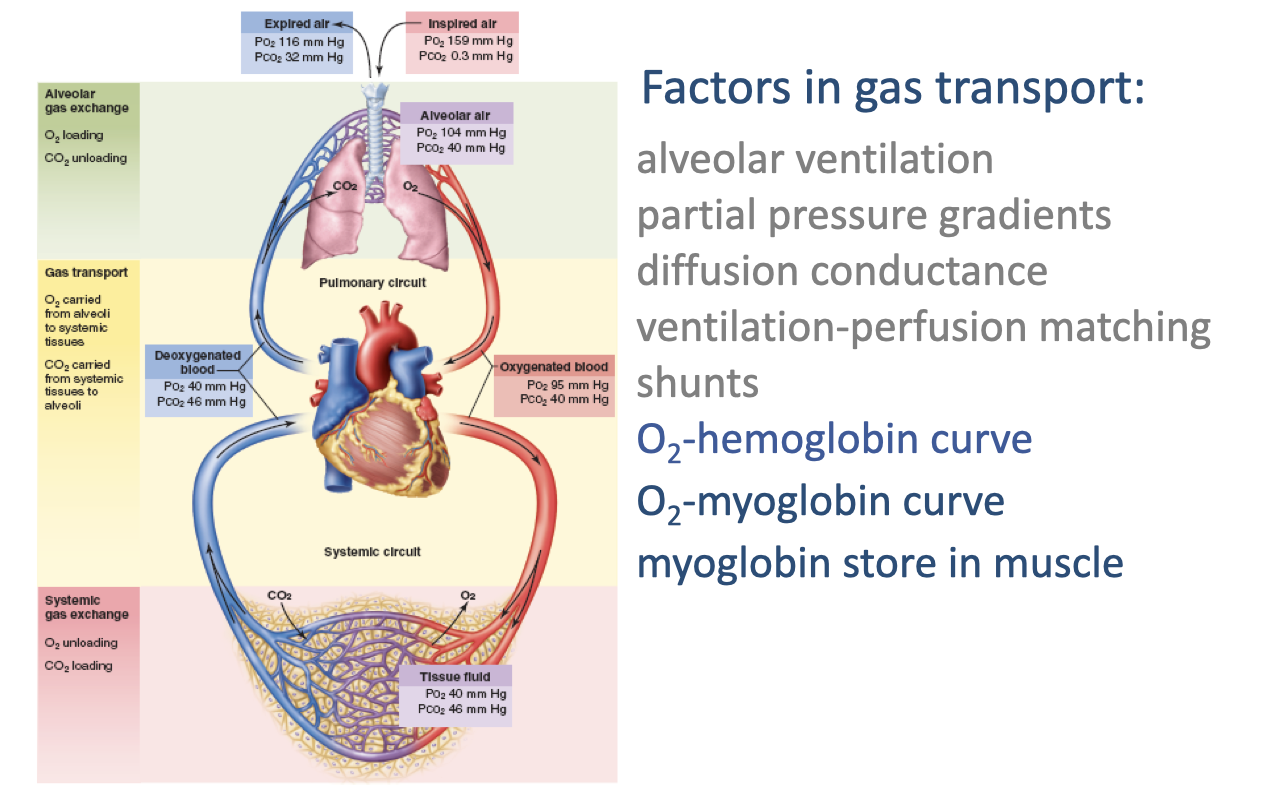
Transition — Focus Shifts to O2-Binding Curves
- Returning to the factors list as a roadmap.
- The previous slides addressed V/Q matching and shunts; the next slides address blood O2 content — how arterial and venous PO₂ translate into hemoglobin and myoglobin saturation, and how that determines the a-v O2 difference used in the Fick equation.
Slide 7
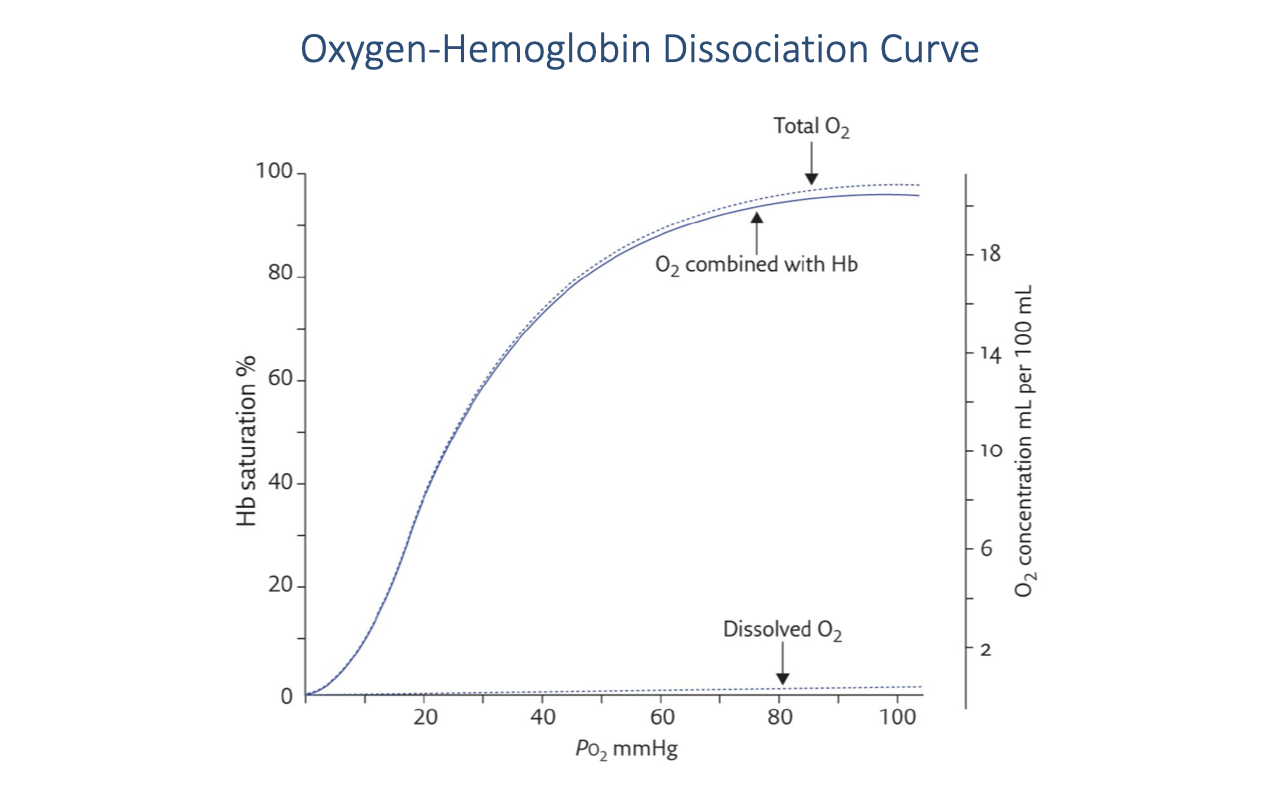
Oxygen-Hemoglobin Dissociation Curve — Core Shape
- The relationship between PO₂ and hemoglobin saturation is a sigmoid curve.
- The sigmoidal shape reflects cooperative binding of O2 to the four heme sites — binding of the first O2 increases the affinity for subsequent O2 molecules.
- Dissolved O2 (lower dashed line) rises linearly with PO₂ but contributes only a very small fraction of total blood O2 content.
- Hemoglobin-bound O2 dominates total blood O2 content across the physiological range.
- Above ~60 mmHg, hemoglobin is nearly fully saturated — further increases in arterial PO₂ produce only modest increases in total blood O2 content.
Slide 8
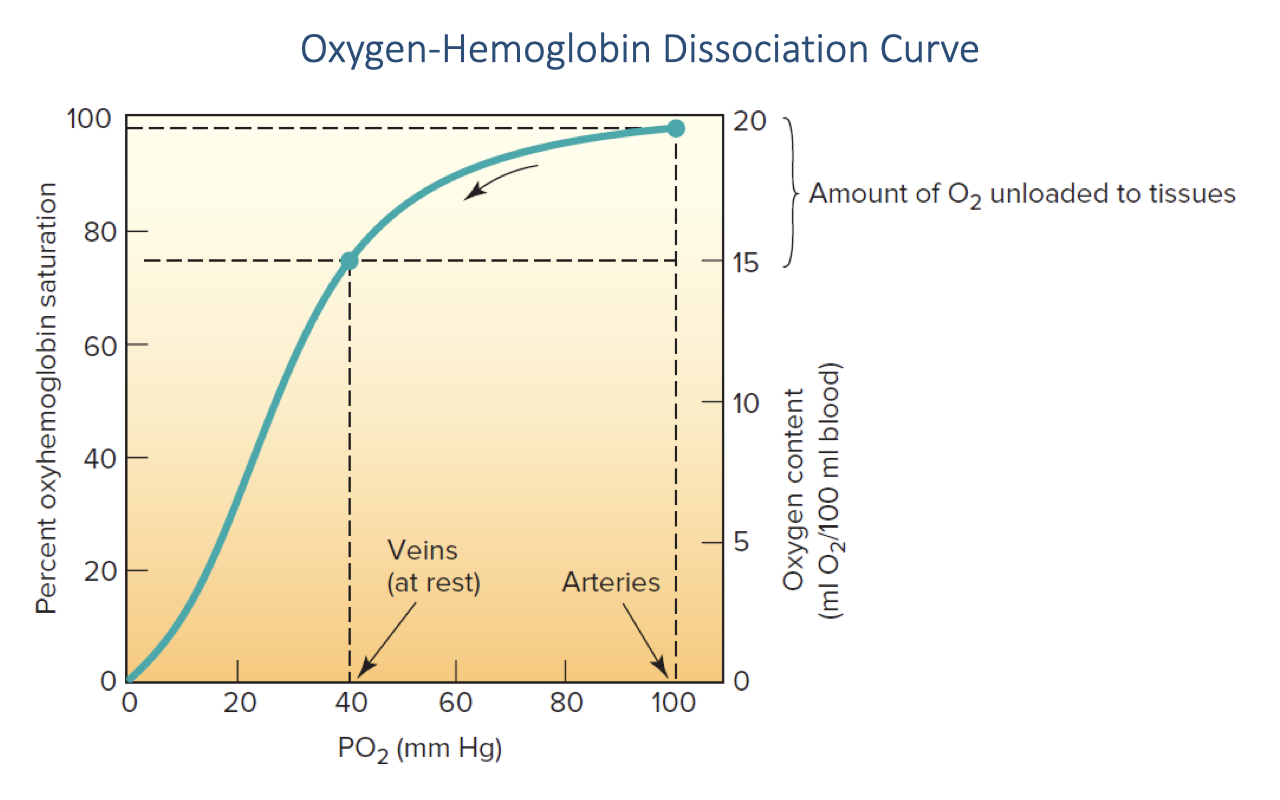
Arterial and Venous Operating Points on the O2-Hb Curve
- Typical resting operating points on the curve:
- Arterial blood: PO₂ ≈ 100 mmHg → Hb saturation ≈ 98% → ~20 mL O2/100 mL blood
- Mixed venous blood (at rest): PO₂ ≈ 40 mmHg → Hb saturation ≈ 75% → ~15 mL O2/100 mL blood
- The vertical bracket shows the amount of O2 unloaded to tissues — this is the a-v O2 difference (~5 mL O2/100 mL blood at rest).
- To convert a measured PO₂ to hemoglobin saturation, read across from the curve (either from a standardized curve or, in clinical practice, a computer look-up table).
- Increases in arterial PO₂ above ~80 mmHg have little effect on Hb-bound O2 because Hb is already saturated — the plateau is what limits the benefit of hyperoxic inspired air.
Slide 9
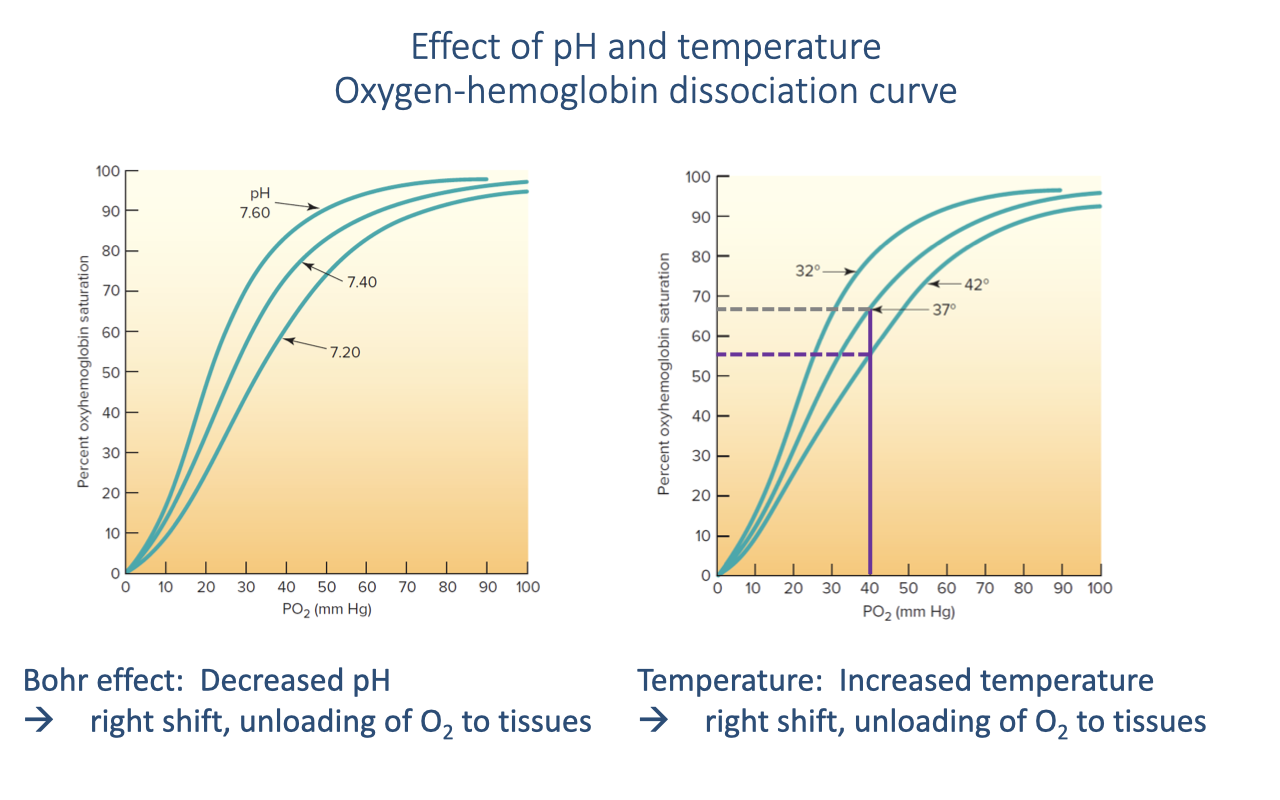
pH and Temperature Shifts — The Bohr Effect
- Both decreased pH (rising H+, typically from CO2 and lactate) and increased temperature shift the O2-Hb curve to the right.
- A rightward shift lowers Hb affinity for O2 at any given PO₂, promoting O2 unloading at the tissues — precisely where the local environment is most acidic and warm (i.e., active skeletal muscle).
- The Bohr effect is the pH/CO2 component of this rightward shift.
- A leftward shift (higher pH, lower temperature) raises Hb affinity and promotes O2 loading in the lungs.
- Together, these shifts create a dynamic system that automatically matches O2 delivery to local metabolic demand during exercise.
Slide 10
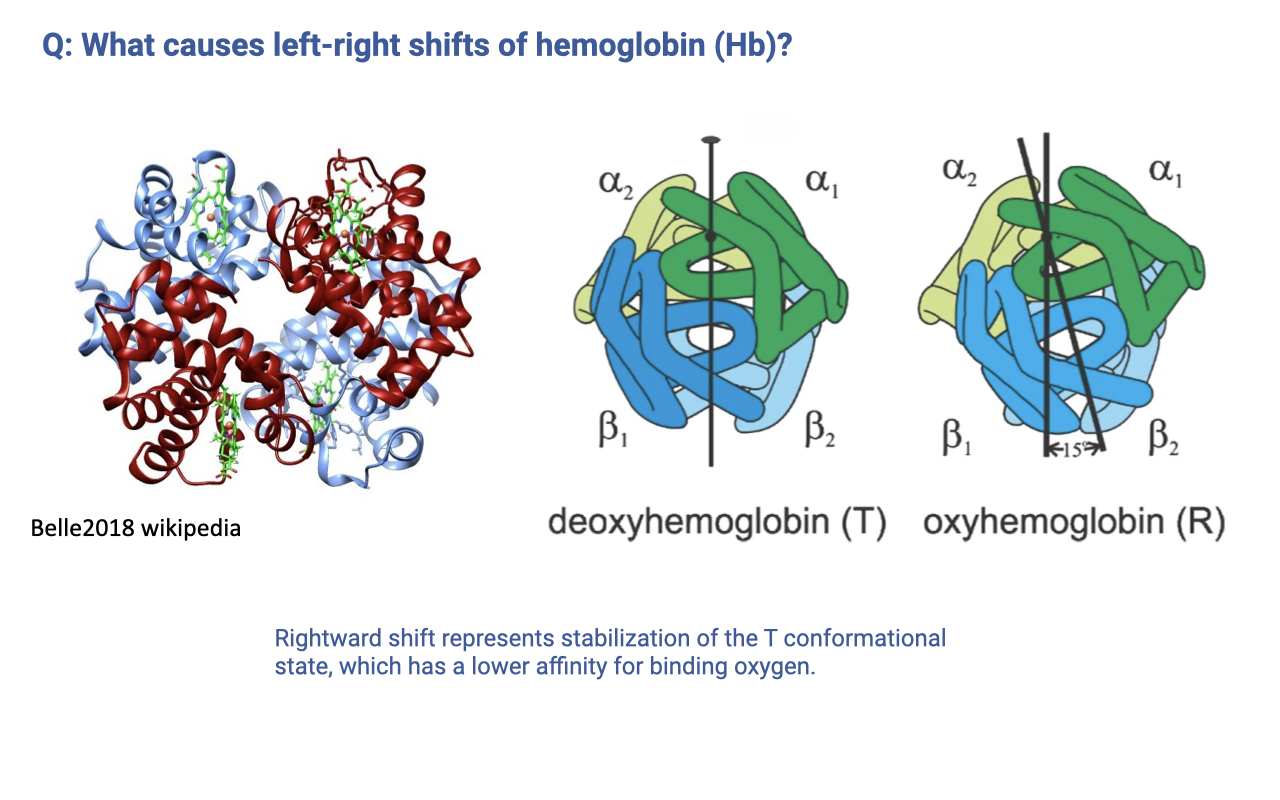
- Hemoglobin exists in two quaternary conformations:
- T (tense) state — deoxyhemoglobin — lower O2 affinity
- R (relaxed) state — oxyhemoglobin — higher O2 affinity
- A rightward shift of the dissociation curve corresponds to stabilization of the T state, which lowers the probability of O2 binding at any given PO₂.
- Factors that stabilize the T state (and therefore right-shift the curve) include increased H+, CO2, 2,3-bisphosphoglycerate (2,3-BPG), and temperature.
- This is a mechanistic answer to a student question from the reading — the curve shift is not just a phenomenological curve, but reflects a protein conformational equilibrium that can be perturbed by local chemistry.
Slide 11
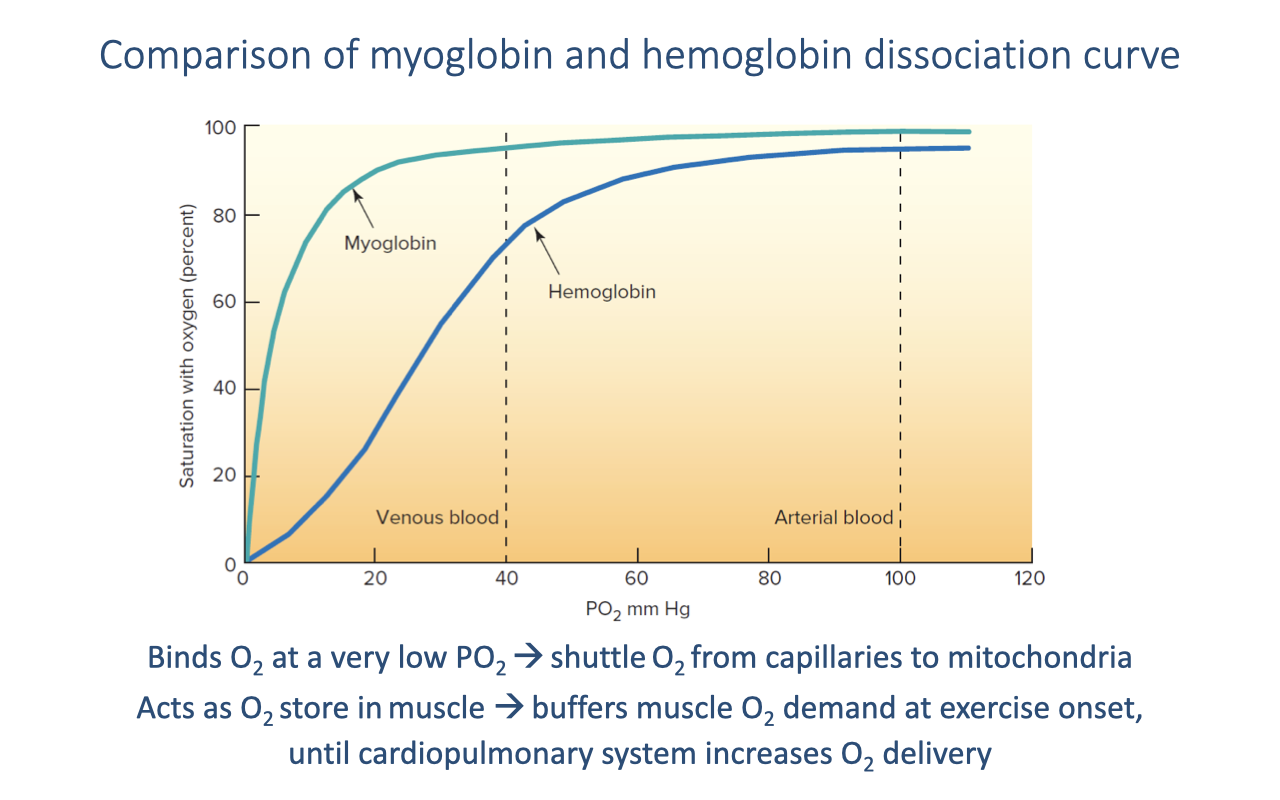
Myoglobin vs. Hemoglobin
- Myoglobin (muscle) has a much higher O2 affinity than hemoglobin — its curve is a hyperbola (single binding site, no cooperativity) that saturates at very low PO₂.
- At typical venous PO₂ (~40 mmHg), myoglobin is still nearly fully saturated (~90%) while hemoglobin is only ~75% saturated — the affinity difference ensures O2 flows from Hb to Mb in the muscle capillary bed.
- Functional roles:
- Shuttle — transfers O2 from the capillary to the mitochondrion down a steep local gradient.
- Intracellular O2 store — buffers muscle O2 demand at the onset of exercise until the cardiopulmonary response ramps up O2 delivery.
- Myoglobin content is higher in oxidative (slow-twitch) fibers and in the muscles of diving mammals, reflecting training status and adaptation.
Slide 12
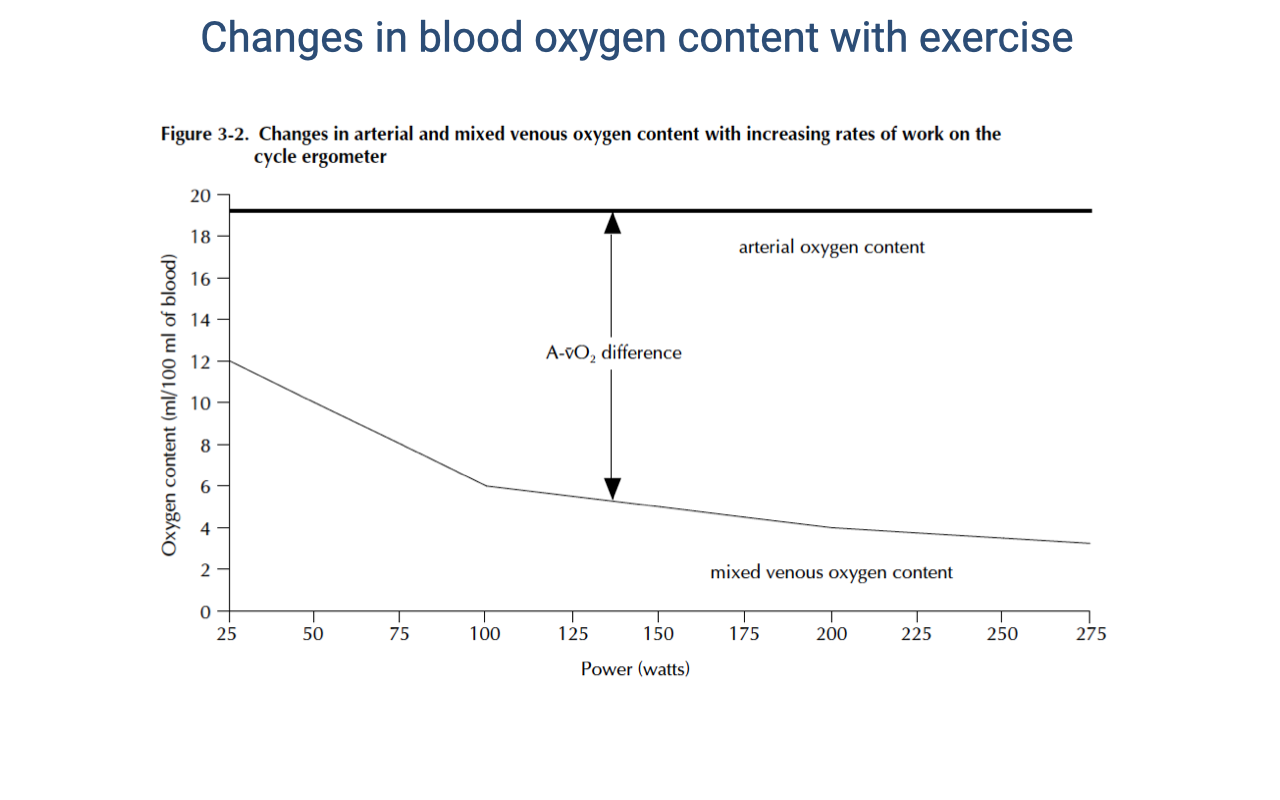
Arterial and Mixed Venous O2 Content During Graded Exercise
- As exercise intensity increases:
- Arterial O2 content ($C_aO_2$) remains nearly constant — the lungs continue to saturate hemoglobin because arterial PO₂ is maintained near ~100 mmHg.
- Mixed venous O2 content ($C_{\bar{v}}O_2$) declines substantially — working muscle extracts a larger fraction of the delivered O2, dropping venous PO₂ well below 40 mmHg at peak effort.
- The a-v O2 difference (the gap between the two lines) widens during exercise.
- This widening, combined with increased cardiac output, produces the large rise in $\dot{V}O_2$ seen during exercise — both terms of the Fick equation $\dot{V}O_2 = \dot{Q}(C_aO_2 - C_{\bar{v}}O_2)$ increase together.
Slide 13
![Slide titled "Graphical solution to the Fick principle for oxygen uptake" with a silhouette of a galloping horse and a flying raptor on the right. A schematic graph on the left plots blood oxygen concentration on the y-axis versus PO2 on the x-axis, overlaid on a rectangular area representing cardiac output. A sigmoid oxygen-hemoglobin curve is drawn on the PO2 axis. Two blue dots on the curve mark resting arterial and venous points, and a red dot marks the exercise arterial point; a dashed bracket along the y-axis indicates the a-v O2 difference. A small grey rectangle labeled "BMR" (basal metabolic rate) sits inside a larger rectangle labeled "Exercise," representing expanded cardiac output. The equation VO2 = Q·([O2]a − [O2]v) is written inside the Exercise box. Citation: Wang et al. 2019, Current Opinion in Physiology.](/E183_ExercisePhysiology/week03/images/friday-review/slide-013.png)
Graphical Solution to the Fick Principle — Mammals and Birds
- The Fick equation $\dot{V}O_2 = \dot{Q}(C_aO_2 - C_{\bar{v}}O_2)$ can be represented geometrically as the area of a rectangle:
- The vertical dimension is the a-v O2 content difference (set by the O2-Hb curve and the arterial/venous PO₂ operating points).
- The horizontal dimension is cardiac output ($\dot{Q}$).
- The area inside the small grey box represents basal O2 uptake; the full rectangle represents exercise O2 uptake.
- In mammals and birds with fully divided four-chambered hearts, both dimensions can expand independently during exercise — $\dot{Q}$ increases sharply, and the a-v O2 difference widens as venous PO₂ drops.
Slide 14
![Slide titled "Graphical solution to the Fick principle for oxygen uptake" with silhouettes of a frog and a crocodile on the right. The same graphical rectangle is shown, but with two arterial points on the O2-Hb curve: one labeled "R-L shunt" at a lower arterial PO2 (purple dot) and one labeled "R-L shunt reduced" at a higher arterial PO2 (red dot). The venous points remain at lower positions. The SMR (standard metabolic rate) grey box is inside an Exercise rectangle. The equation VO2 = Q·([O2]a − [O2]v) is written inside. Citation: Wang et al. 2019.](/E183_ExercisePhysiology/week03/images/friday-review/slide-014.png)
Graphical Solution — Ectotherms With a Right-to-Left Cardiac Shunt
- In ectotherms with an incompletely divided ventricle (amphibians, non-crocodilian reptiles), a right-to-left (R-L) cardiac shunt mixes deoxygenated pulmonary blood with oxygenated systemic blood, lowering arterial PO₂ and shrinking the a-v O2 content difference.
- Reducing the shunt during exercise (or by physiological control, as in some reptiles) raises arterial PO₂ and widens the Fick rectangle vertically, increasing $\dot{V}O_2$ without necessarily increasing $\dot{Q}$.
- This illustrates that non-mammalian vertebrates can modulate O2 delivery by regulating cardiac shunt fraction — a lever that is not available to mammals and birds.
Slide 15
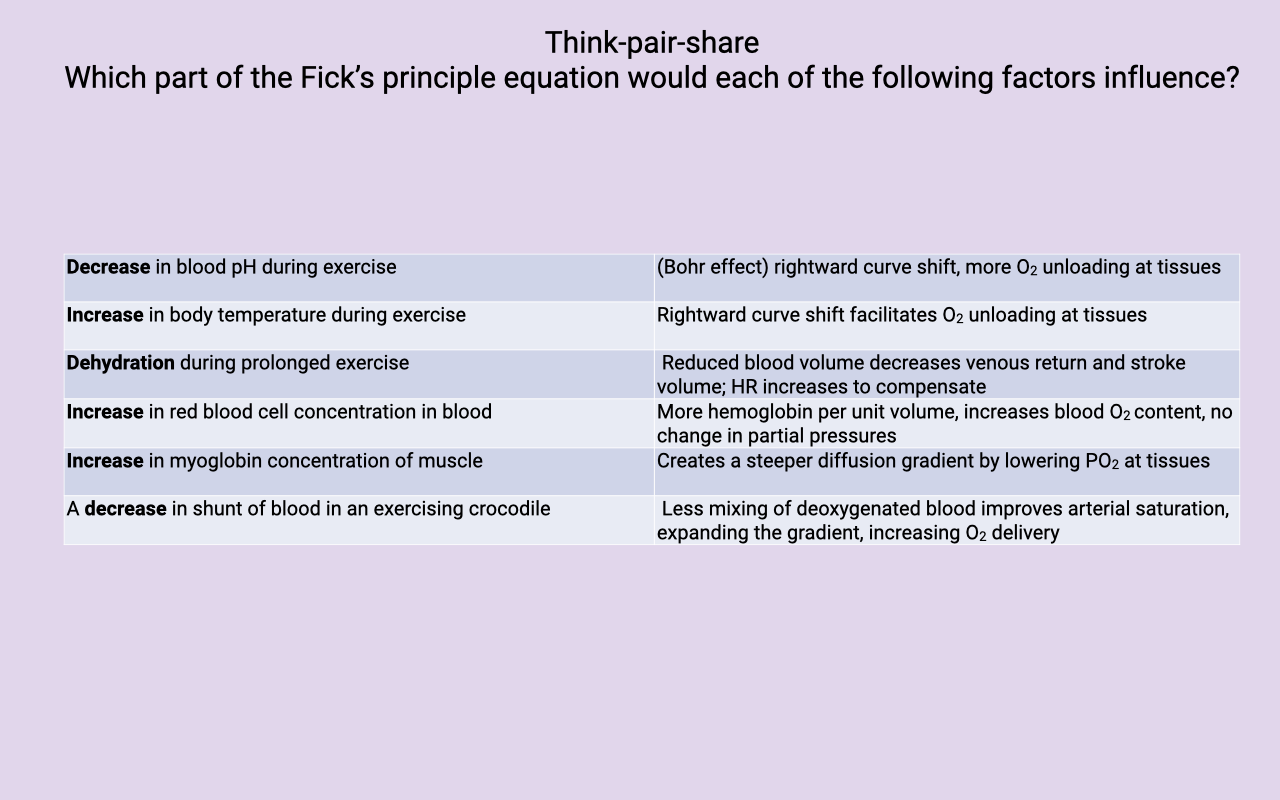
Think-Pair-Share Activity — Mapping Factors to the Fick Equation
| Factor |
Effect in Fick Principle |
| Decrease in blood pH during exercise |
Bohr effect — rightward curve shift, more O2 unloading at tissues (lowers $C_{\bar{v}}O_2$, widens a-v O2 diff) |
| Increase in body temperature during exercise |
Rightward curve shift facilitates O2 unloading at tissues |
| Dehydration during prolonged exercise |
Reduced blood volume decreases venous return and stroke volume; HR increases to maintain $\dot{Q}$ (cardiovascular drift) |
| Increase in red blood cell concentration |
More hemoglobin per unit volume → increases blood O2 content ($C_aO_2$) with no change in partial pressures |
| Increase in muscle myoglobin concentration |
Creates a steeper diffusion gradient by lowering intracellular PO₂ at the tissue; increases the capillary-to-mitochondrion driving force |
| Decrease in cardiac shunt in an exercising crocodile |
Less mixing of deoxygenated blood → improves arterial saturation, expands the a-v O2 gradient, increases O2 delivery |
- Each factor acts on a specific term of the Fick equation — some change $\dot{Q}$ (cardiac output), some change the a-v O2 content difference, and some change the diffusion gradient at the tissue.
Slide 16
![Slide titled "Using the equations...." showing the derivation of the blood-content form of the Fick principle. Top row: two forms of Fick's principle applied to circulation, VO2 = Q̇·Bblood·(PaO2 − PvO2) with "arterial-venous gradient ΔPO2 = PaO2 − PvO2," and VO2 = Q̇(CaO2 − CvO2) with "blood oxygen content ΔCO2 = CaO2 − CvO2." A purple arrow points down to an expanded expression: C_O2 = sO2·[Hb]·BO2 + 0.03·PO2, with coefficient definitions listed: sO2 is the fractional saturation of Hb at the given PO2 (range 0 to 1); [Hb] is hemoglobin concentration in grams per liter of blood (typical value 140 g/L); BO2 is the maximum Hb-bound O2 in mL O2 per gram of Hb (~1.39 mL O2/g). Worked examples: arterial CaO2 = 1.0·(140)·1.39 + 0.03·100 = 197.6 mL O2/L blood; venous CvO2 = 0.75·(140)·1.39 + 0.03·40 = 147.15 mL O2/L blood; ΔCO2 = (197.6 − 147.15) = 50.45 mL O2/L blood.](/E183_ExercisePhysiology/week03/images/friday-review/slide-016.png)
Deriving the Blood O2 Content Form of Fick’s Principle
- The two forms of the Fick principle are linked through the definition of blood O2 content:
\[C\_{O_2} = sO_2 \cdot [Hb] \cdot B\_{O_2} + 0.03 \cdot P\_{O_2}\]
- Where:
- $sO_2$ — fractional saturation of hemoglobin (0 to 1), read from the O2-Hb dissociation curve at the given PO₂
- $[Hb]$ — hemoglobin concentration in the blood (typical value ≈ 140 g/L)
- $B_{O_2}$ — maximum O2 bound per gram of Hb (≈ 1.39 mL O2/g)
- $0.03 \cdot P_{O_2}$ — directly dissolved O2 in plasma (small contribution)
- Worked calculation (typical resting values):
- $C_aO_2 = 1.0 \times 140 \times 1.39 + 0.03 \times 100 = 197.6$ mL O2/L blood (arterial, ~100% saturation at PO₂ = 100 mmHg)
- $C_{\bar{v}}O_2 = 0.75 \times 140 \times 1.39 + 0.03 \times 40 = 147.15$ mL O2/L blood (mixed venous, ~75% saturation at PO₂ = 40 mmHg)
- $\Delta C_{O_2} = 197.6 - 147.15 \approx 50.45$ mL O2/L blood
- This shows explicitly where the blood O2 content values used in the Fick equation come from — they are not arbitrary; they are built from hemoglobin saturation, hemoglobin concentration, and the binding coefficient.
Slide 17
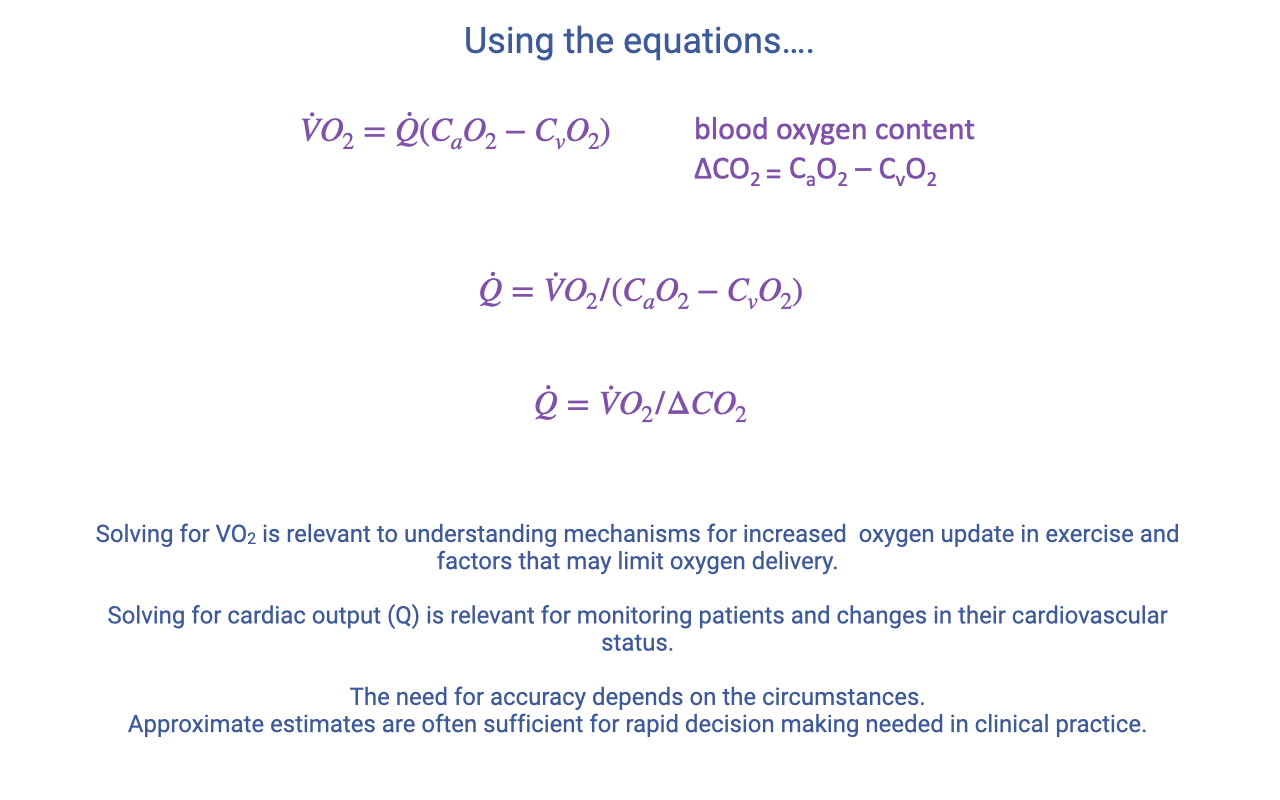
Rearranging the Fick Equation for Different Questions
- The same equation can be solved for different unknowns depending on what is being measured:
\[\dot{Q} = \frac{\dot{V}O\_2}{C\_aO\_2 - C\_{\bar{v}}O\_2} = \frac{\dot{V}O\_2}{\Delta C\_{O_2}}\]
- When to solve for $\dot{V}O_2$ — to understand the mechanisms that increase O2 uptake in exercise and to identify factors that may limit O2 delivery.
- When to solve for $\dot{Q}$ — to monitor patients clinically by tracking changes in cardiac output and cardiovascular status.
- The required accuracy depends on context: broad-trend estimates are often sufficient for rapid clinical decision-making, whereas research measurements of mechanisms may demand greater precision and more invasive measurement techniques.
Slide 18
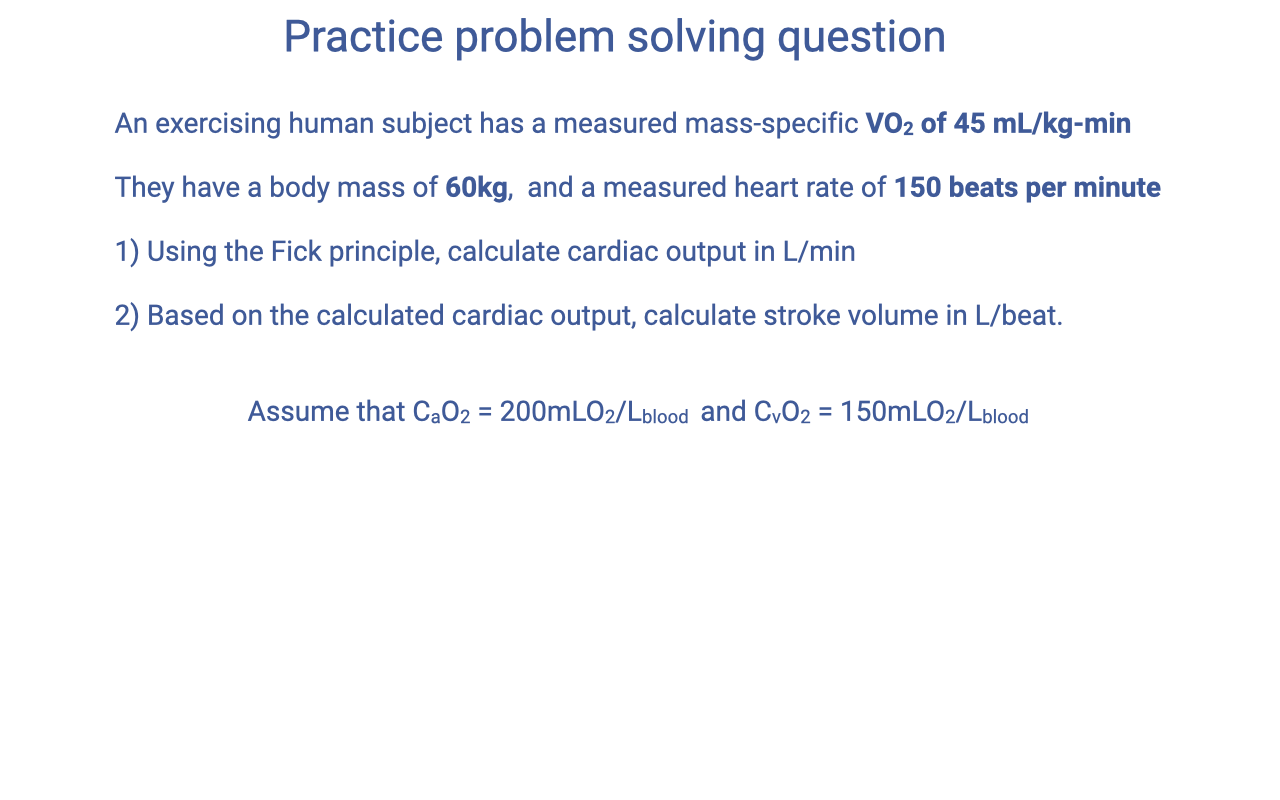
Practice Problem — Question
- Given:
- Mass-specific $\dot{V}O_2$ = 45 mL/kg·min
- Body mass = 60 kg
- Heart rate (HR) = 150 beats/min
- $C_aO_2$ = 200 mL O2/L blood
- $C_{\bar{v}}O_2$ = 150 mL O2/L blood
- Find:
- Cardiac output ($\dot{Q}$), in L/min
- Stroke volume (SV), in L/beat
- Strategy: apply the blood-content form of the Fick principle rearranged for $\dot{Q}$, then use $\dot{Q} = HR \times SV$ to solve for SV.
Slide 19
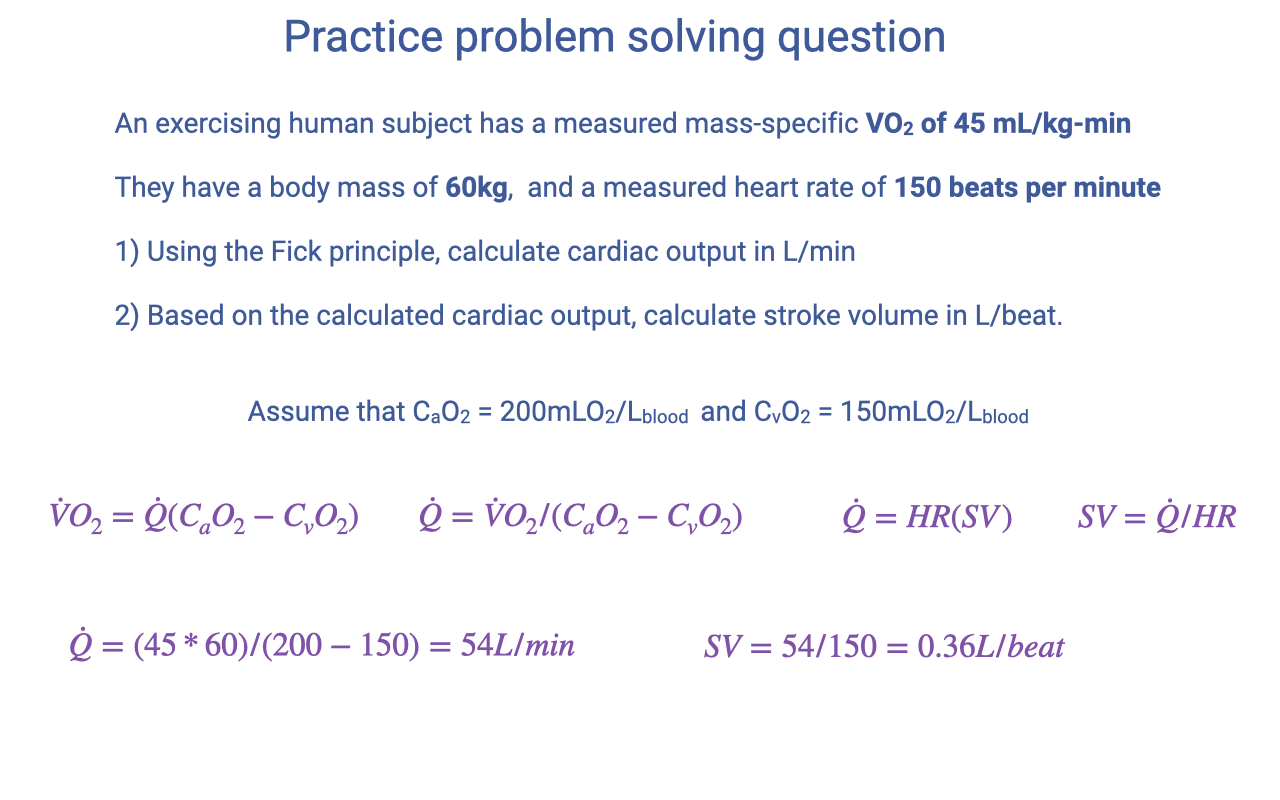
Practice Problem — Solution
- Step 1: Convert mass-specific VO2 to whole-body VO2:
\[\dot{V}O\_2 = 45 \text{ mL/kg·min} \times 60 \text{ kg} = 2700 \text{ mL/min} = 2.7 \text{ L/min}\]
- Step 2: Solve the Fick principle for cardiac output. Units: with $\dot{V}O_2$ in mL/min and $\Delta C_{O_2}$ in mL O2/L blood, $\dot{Q}$ comes out in L/min.
\[\dot{Q} = \frac{\dot{V}O\_2}{C\_aO\_2 - C\_{\bar{v}}O\_2} = \frac{45 \times 60}{200 - 150} = \frac{2700}{50} = 54 \text{ L/min}\]
- Step 3: Solve for stroke volume using $\dot{Q} = HR \times SV$:
\[SV = \frac{\dot{Q}}{HR} = \frac{54}{150} = 0.36 \text{ L/beat}\]
- Interpretation: a cardiac output of 54 L/min and a stroke volume of 360 mL/beat are at the very high end of the human range — consistent with a highly trained athlete near VO2max. This problem illustrates how the Fick principle, combined with HR and an assumed a-v O2 difference, lets cardiac output and stroke volume be inferred from readily measurable quantities.
Slide 20
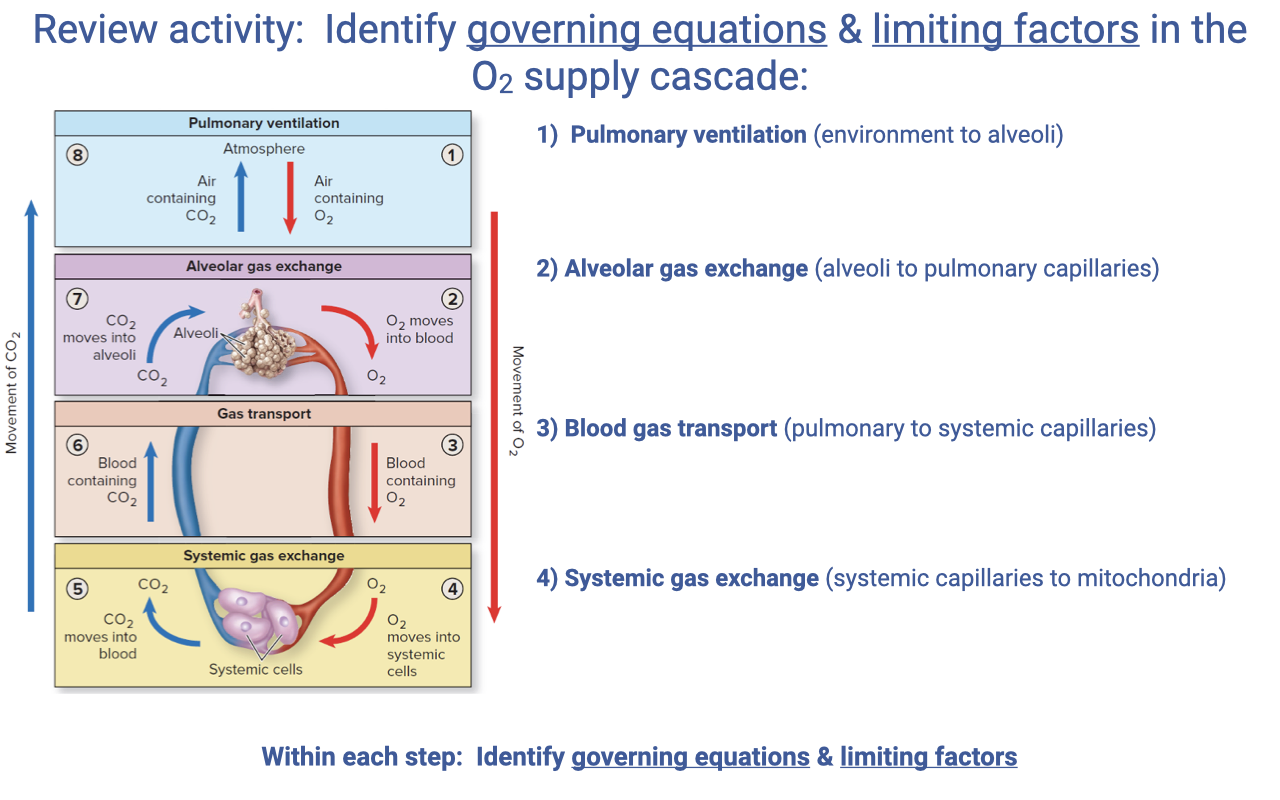
Review Activity — Governing Equations at Each Step of the O2 Supply Cascade
- For each step in the cascade, students should be able to identify the governing equation and the limiting factors:
| Step |
Governing Equation |
Key Limiting Factors |
| 1. Pulmonary ventilation (environment → alveoli) |
$\dot{V}O_2 = \dot{V}_A B_{gas}(P_IO_2 - P_EO_2)$; $\dot{V}_E = f_b \times V_T$; $\dot{V}_A = \dot{V}_E - \dot{V}_D$ |
Alveolar ventilation rate; breathing frequency; tidal volume; dead space |
| 2. Alveolar gas exchange (alveoli → pulmonary capillaries) |
Fick’s law of diffusion: $\dot{V}O_2 = D_L(P_{lung} - P_{blood})_{O_2}$ |
Diffusion conductance (surface area, membrane thickness); alveolar-capillary PO₂ gradient; V/Q matching; RBC transit time |
| 3. Blood gas transport (pulmonary → systemic capillaries) |
$\dot{V}O_2 = \dot{Q}(C_aO_2 - C_{\bar{v}}O_2)$; $\dot{Q} = HR \times SV$ |
Cardiac output; [Hb]; Hb saturation (arterial and venous); cardiac shunts |
| 4. Systemic gas exchange (systemic capillaries → mitochondria) |
Fick’s law of diffusion (at tissue): $\dot{V}O_2 = D_t(P_{blood} - P_{mito})_{O_2}$ |
Tissue diffusion conductance; capillary density; myoglobin content; mitochondrial PO₂ |
- The Fick principle and Fick’s law of diffusion recur at multiple steps — the same mathematical framework describes both bulk flow (ventilation, circulation) and passive diffusion (alveolar and systemic gas exchange).
Key Equations
| Equation |
Name |
Description |
| $\dot{V}O_2 = \dot{V}_A B_{gas}(P_IO_2 - P_EO_2)$ |
Fick principle (ventilation) |
O2 uptake from alveolar ventilation and the inspired–expired PO₂ gradient |
| $\dot{V}O_2 = \dot{Q} B_{blood}(P_aO_2 - P_vO_2)$ |
Fick principle (circulation, partial-pressure form) |
O2 uptake from cardiac output, blood O2-carrying coefficient, and the arterial-venous PO₂ gradient |
| $\dot{V}O_2 = \dot{Q}(C_aO_2 - C_{\bar{v}}O_2)$ |
Fick principle (circulation, blood-content form) |
O2 uptake from cardiac output and the a-v O2 content difference |
| $\dot{Q} = HR \times SV$ |
Cardiac output |
Cardiac output (L/min) equals heart rate (beats/min) times stroke volume (L/beat) |
| $\dot{Q} = \dot{V}O_2 / (C_aO_2 - C_{\bar{v}}O_2)$ |
Fick principle rearranged for cardiac output |
Used clinically to infer $\dot{Q}$ from measured $\dot{V}O_2$ and a-v O2 content difference |
| $SV = \dot{Q} / HR$ |
Stroke volume |
Stroke volume (L/beat) from cardiac output and heart rate |
| $C_{O_2} = sO_2 \cdot [Hb] \cdot B_{O_2} + 0.03 \cdot P_{O_2}$ |
Blood O2 content |
Total blood O2 content = Hb-bound O2 + dissolved O2; $sO_2$ = fractional Hb saturation, $[Hb]$ ≈ 140 g/L, $B_{O_2}$ ≈ 1.39 mL O2/g |
| $\Delta C_{O_2} = C_aO_2 - C_{\bar{v}}O_2$ |
a-v O2 difference |
Amount of O2 extracted per liter of blood passing through the tissues |
| $\dot{V}/\dot{Q} \approx 1.0$ |
Ideal V/Q ratio |
Ratio of alveolar ventilation to pulmonary blood flow; 1.0 indicates optimal matching for gas exchange |
| $\dot{V}O_2 = D_L(P_{lung} - P_{blood})_{O_2}$ |
Fick’s law of diffusion (lung) |
O2 diffusion across the alveolar-capillary membrane |
Glossary of Key Terms
| Term |
Definition |
| Fick principle |
Conservation-of-mass statement equating O2 uptake to the product of a flow rate (ventilation or cardiac output) and a concentration (or partial pressure) difference across that step. |
| Cardiac output ($\dot{Q}$) |
Volume of blood pumped per minute by one ventricle; equal to heart rate × stroke volume (L/min). |
| Stroke volume (SV) |
Volume of blood ejected per heartbeat (L/beat or mL/beat). |
| a-v O2 difference |
The difference in O2 content between arterial and mixed venous blood; reflects how much O2 is extracted by the tissues per liter of blood. |
| Mixed venous blood |
Blood sampled from the pulmonary artery, where blood from all regional venous drainages has mixed — represents the whole-body average venous O2 content. |
| Bohr effect |
Rightward shift of the O2-Hb dissociation curve caused by decreased pH (or increased CO2); promotes O2 unloading at active tissues. |
| T (tense) state |
Quaternary conformation of hemoglobin with lower O2 affinity; stabilized by H+, CO2, 2,3-BPG, and elevated temperature. |
| R (relaxed) state |
Quaternary conformation of hemoglobin with higher O2 affinity; favored in the lung where PO₂ is high. |
| Myoglobin |
Intracellular muscle protein with a hyperbolic, high-affinity O2-binding curve; shuttles O2 from capillary to mitochondrion and buffers muscle O2 demand at exercise onset. |
| Ventilation-perfusion ratio (V/Q) |
Ratio of alveolar ventilation to pulmonary blood flow; V/Q = 1.0 is ideal; V/Q < 1.0 = shunt; V/Q > 1.0 = dead space ventilation. |
| V/Q heterogeneity |
Variation in V/Q ratio across lung regions; greater heterogeneity reduces overall gas-exchange efficiency. |
| Right-to-left (R-L) cardiac shunt |
Flow of deoxygenated blood from the right side of the heart directly into the systemic circulation without passing through the lungs; present in amphibians and non-crocodilian reptiles with incompletely divided ventricles. |
| Cardiovascular drift |
During prolonged exercise with dehydration, a gradual decline in stroke volume with a compensatory rise in heart rate; cardiac output is maintained. |
| Exercise-induced arterial hypoxemia (EIAH) |
Decrease in arterial O2 saturation during high-intensity exercise, observed in 40–50% of elite athletes; contributed to in part by V/Q heterogeneity. |