Lecture 7: Control of Ventilation and Ventilation-Perfusion Matching
Slide 1
- This lecture covers the neural and chemical control of ventilation during exercise and the concept of ventilation-perfusion (V/Q) matching in the lung.
- Topics build on the oxygen supply cascade from previous lectures, extending from the ventilatory system to the circulatory system and examining how they are coordinated.
Slide 2
Overview and Learning Objectives (Review from Previous Lecture)
Overview:
- Fundamentals of gas exchange and the oxygen supply cascade
- Changes in VO2 and energy supply during exercise
- Ventilatory responses to exercise
Learning objectives:
- Describe how metabolic energy supply changes during exercise.
- Describe ventilatory responses to exercise.
- Discuss conditions that may lead to pulmonary limitations in gas exchange.
- Define ventilation-perfusion ratio (V/Q) and discuss how variation in V/Q may limit gas exchange.
Slide 3
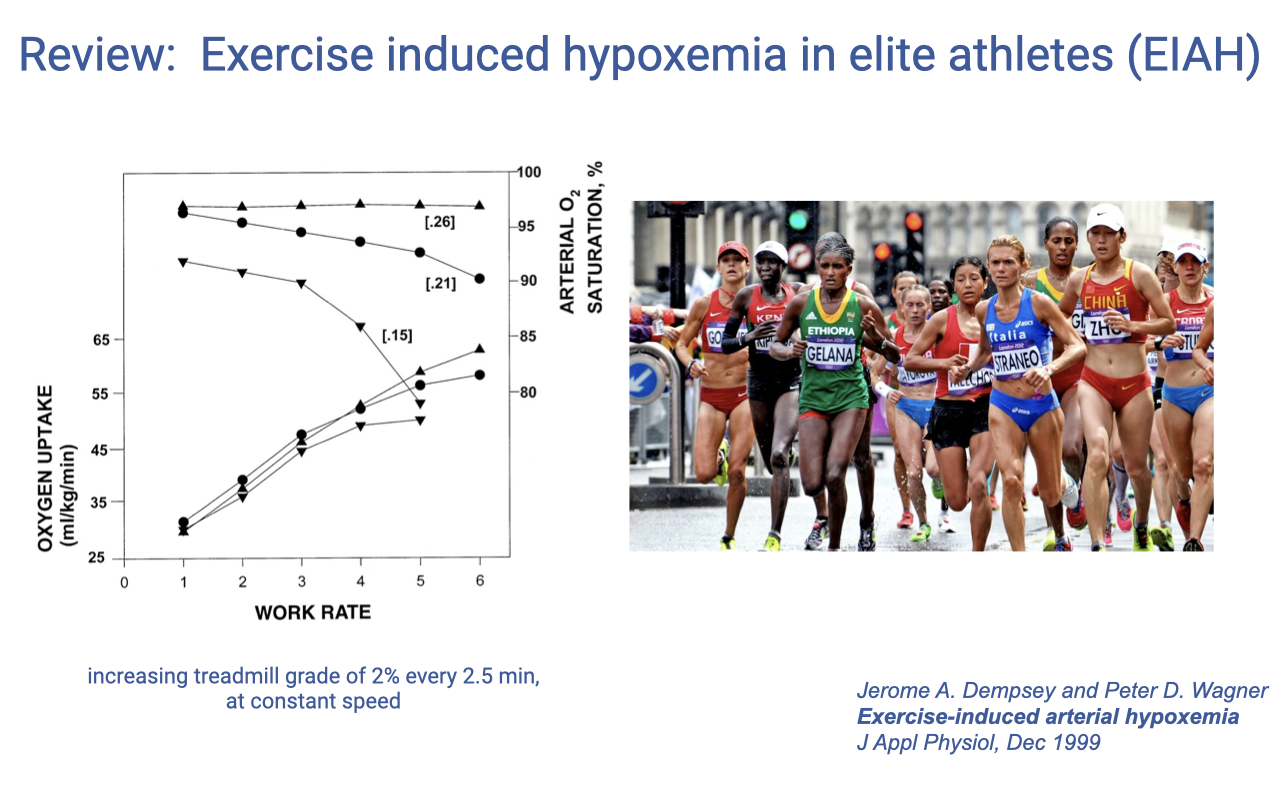
Review: Exercise-Induced Hypoxemia in Elite Athletes (EIAH)
- Exercise-induced arterial hypoxemia (EIAH) is observed in approximately 40–50% of elite endurance athletes.
Does Pulmonary Function Limit Performance?
-
For most healthy individuals at sea level, pulmonary function is NOT the limiting factor for exercise performance at most intensities, except following respiratory muscle fatigue with very high intensity exercise (90–100% VO2max).
-
However, pulmonary exchange does limit performance in some elite endurance athletes (40–50% elite human athletes experience EIAH, also present in thoroughbred racehorses). Mechanisms include:
- Inadequate hyperventilation — mechanical limits on lung airflow, feedback inhibition from mechanical constraints, or decreased chemoreceptor sensitivity
- Respiratory muscle fatigue
- Ventilation/perfusion mismatch and heterogeneity — uneven matching of airflow to blood flow across lung regions
- Short red blood cell transit time — very high cardiac output causes RBCs to pass through pulmonary capillaries too quickly for full O2 diffusion
- Pulmonary edema
Slide 4
Does Training Improve Pulmonary Function?
- Ventilation is actually lower during exercise following endurance training.
- This is thought to result from increased aerobic capacity of locomotor muscles, leading to lower H+ production, which shifts the feedback control mechanisms that stimulate breathing.
- Training has a limited effect on lung structure:
- Normal lung function exceeds demands for gas exchange in most individuals.
- Training-induced adaptation of the lungs is not typically necessary for performance.
- EIAH occurs only in the most elite athletes.
- The lung may have a low capacity for structural or developmental adaptation because it is composed mainly of passive elastic tissue, unlike highly adaptable skeletal and cardiac muscle.
Slide 5
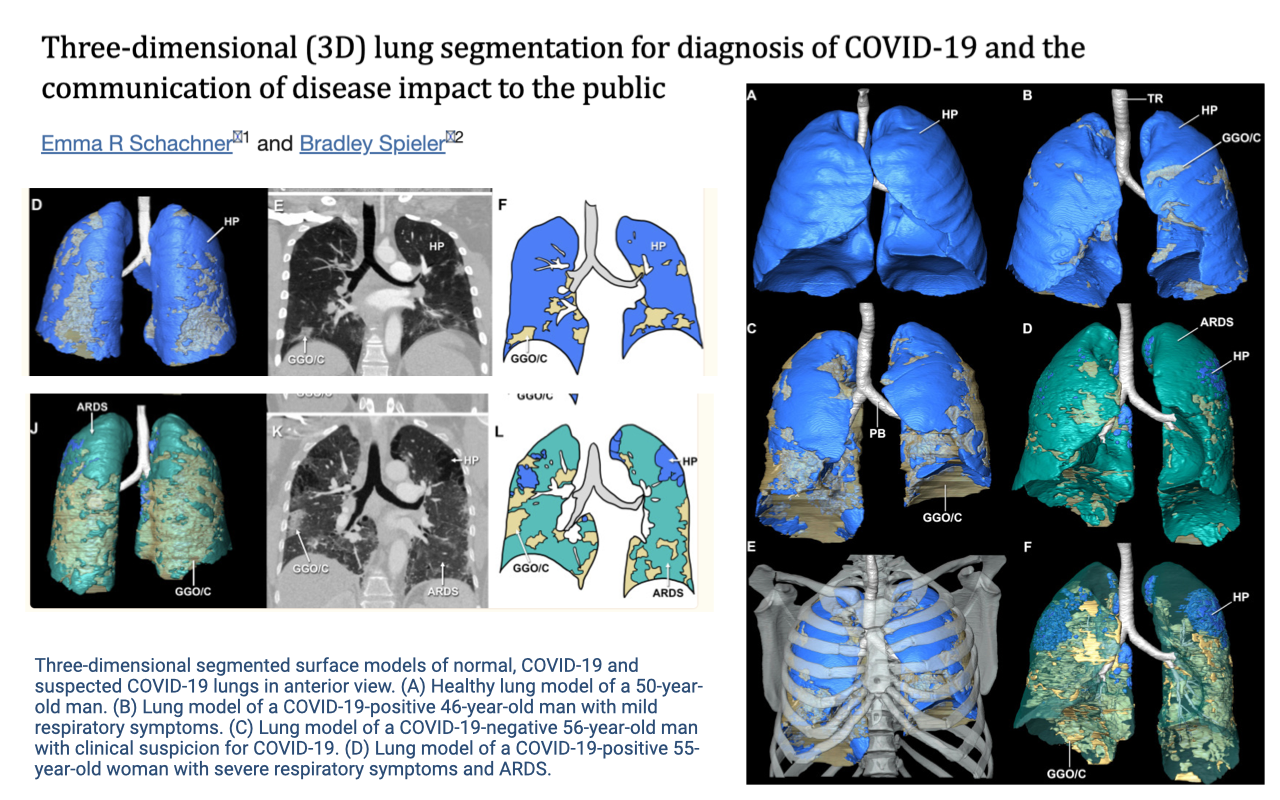
COVID-19 and Limited Lung Adaptation
- The limited capacity of the lung to adapt structurally has important clinical implications.
- 3D lung segmentation from CT scans illustrates the pronounced tissue damage caused by COVID-19 infection.
- Panel A shows a healthy lung model (blue), while panels B–D show COVID-19 positive patients with progressively more severe damage, including ground-glass opacity and ARDS (acute respiratory distress syndrome).
- The contrast between healthy (blue) and damaged (teal/orange/yellow) tissue visually demonstrates how infection can severely compromise gas-exchange surface area.
Slide 6
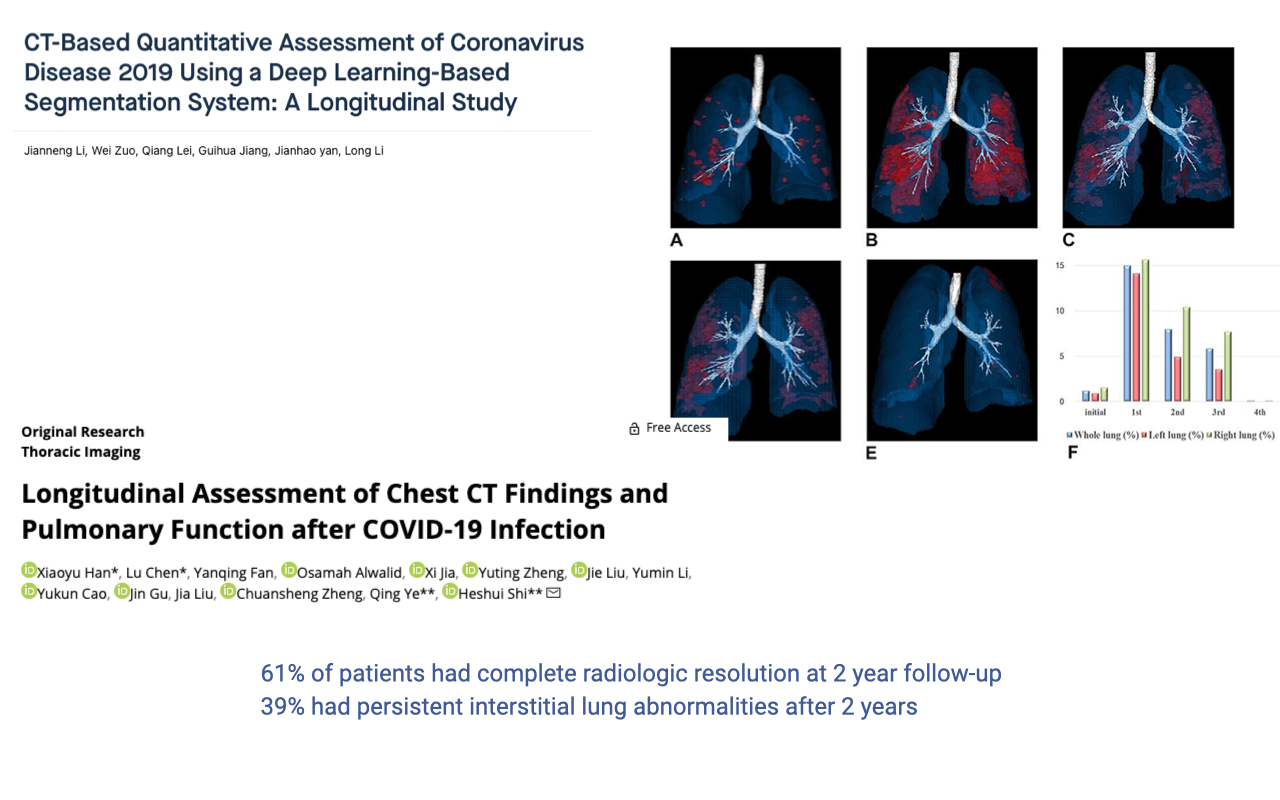
Long-Term Lung Damage Following COVID-19
- Longitudinal studies tracking patients for up to two years after COVID-19 infection show persistent lung damage.
- Only 61% of patients showed complete radiologic resolution by two years post-infection.
- 39% had persistent interstitial lung abnormalities even after two years — demonstrating the lung’s limited ability to regenerate and structurally adapt.
- This is partly because lung tissue is predominantly passive and elastic, unlike muscle tissue, which is highly vascularized and responsive to training stimuli.
Slide 7
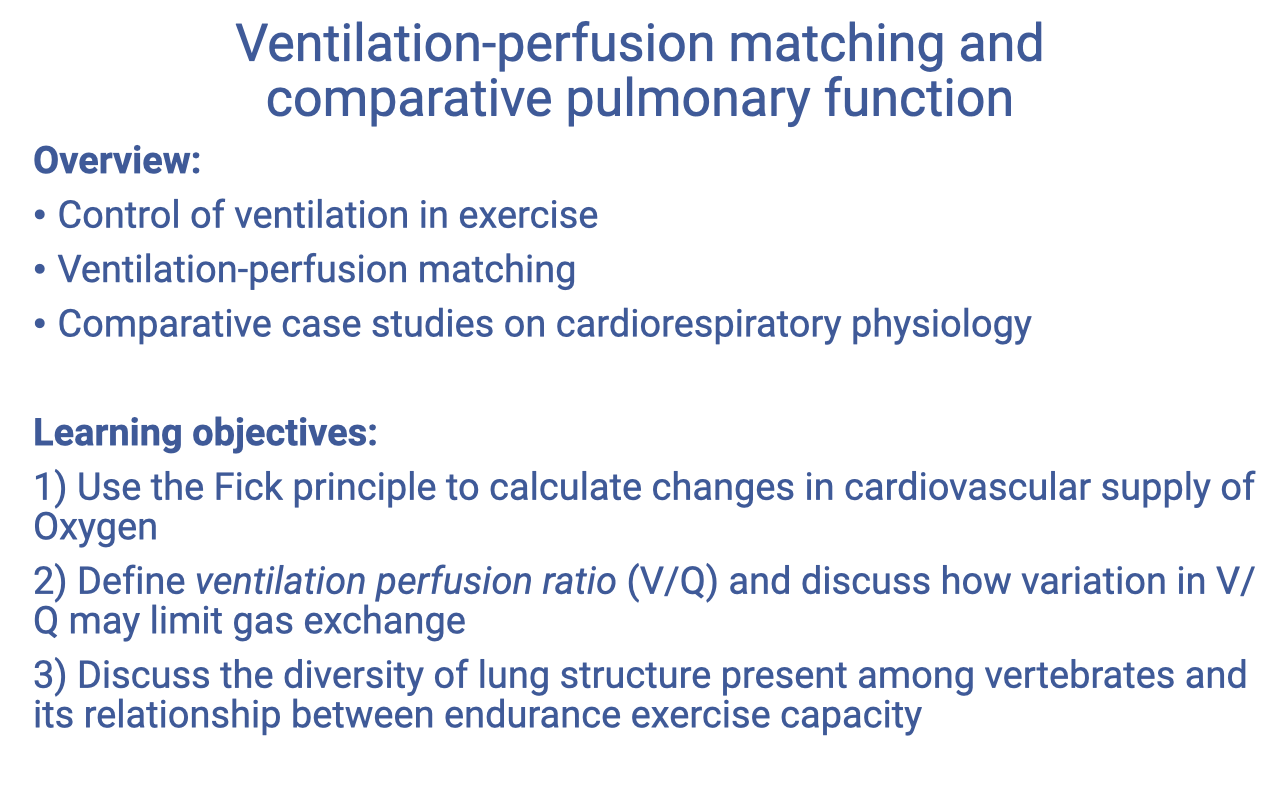
Lecture Overview and Learning Objectives
Overview:
- Control of ventilation in exercise
- Ventilation-perfusion matching
Learning objectives:
- Use the Fick principle to calculate changes in cardiovascular supply of oxygen.
- Define ventilation-perfusion ratio (V/Q) and discuss how variation in V/Q may limit gas exchange.
Note: The comparative pulmonary function content covering vertebrate lung diversity, the avian parabronchial lung, and the archosaur lineage has been moved to Week 2, Lecture 6: Comparative Pulmonary Function.
Slide 8
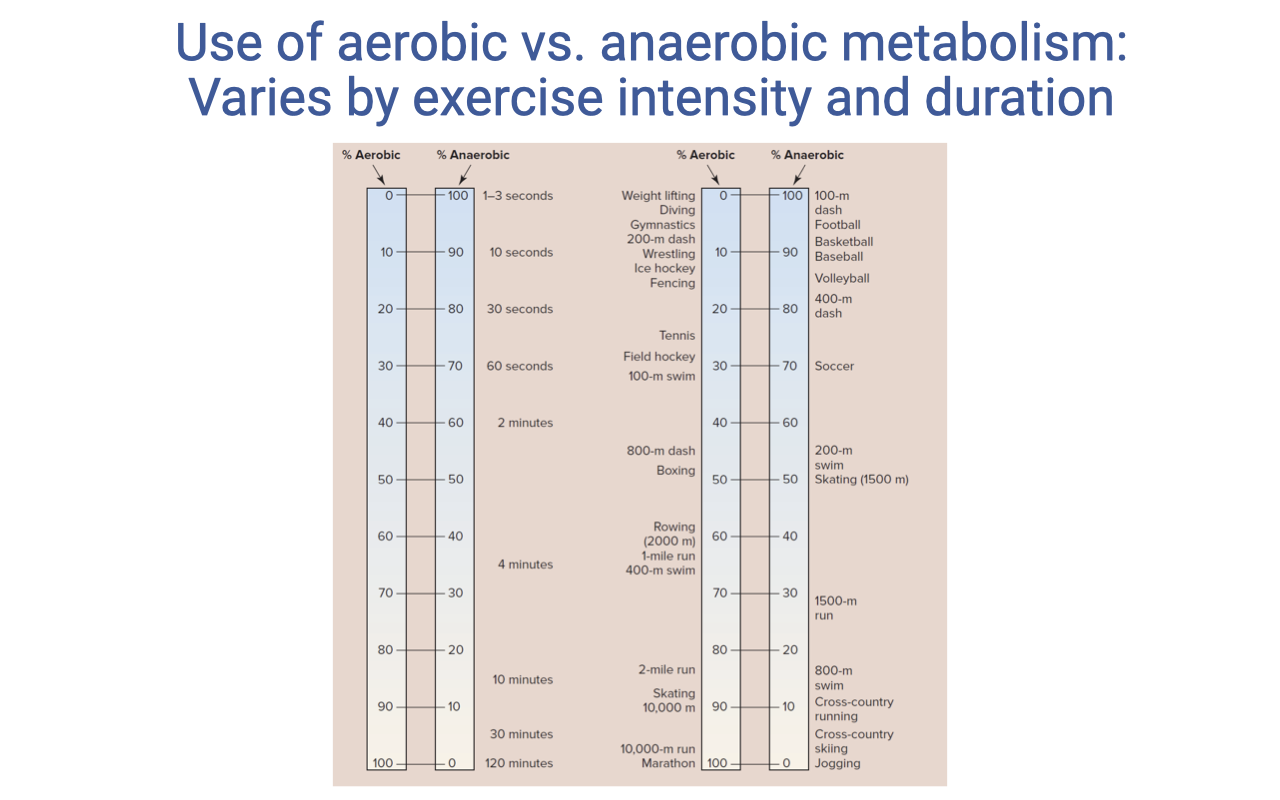
Aerobic vs. Anaerobic Metabolism During Exercise
- The relative contribution of aerobic versus anaerobic energy systems varies with exercise duration and intensity.
- Very short events (<10 seconds) rely almost entirely on anaerobic metabolism (phosphocreatine and anaerobic glycolysis).
- As event duration increases, the aerobic contribution progressively dominates.
- Events lasting approximately 2 minutes or longer are predominantly aerobic.
- Distances of two miles or longer rely on nearly 100% aerobic energy supply.
- This is partly because the aerobic metabolic machinery requires time to ramp up to meet demand — reaching a new steady state involves multiple timescales, including adjustments in ventilation control.
Slide 9
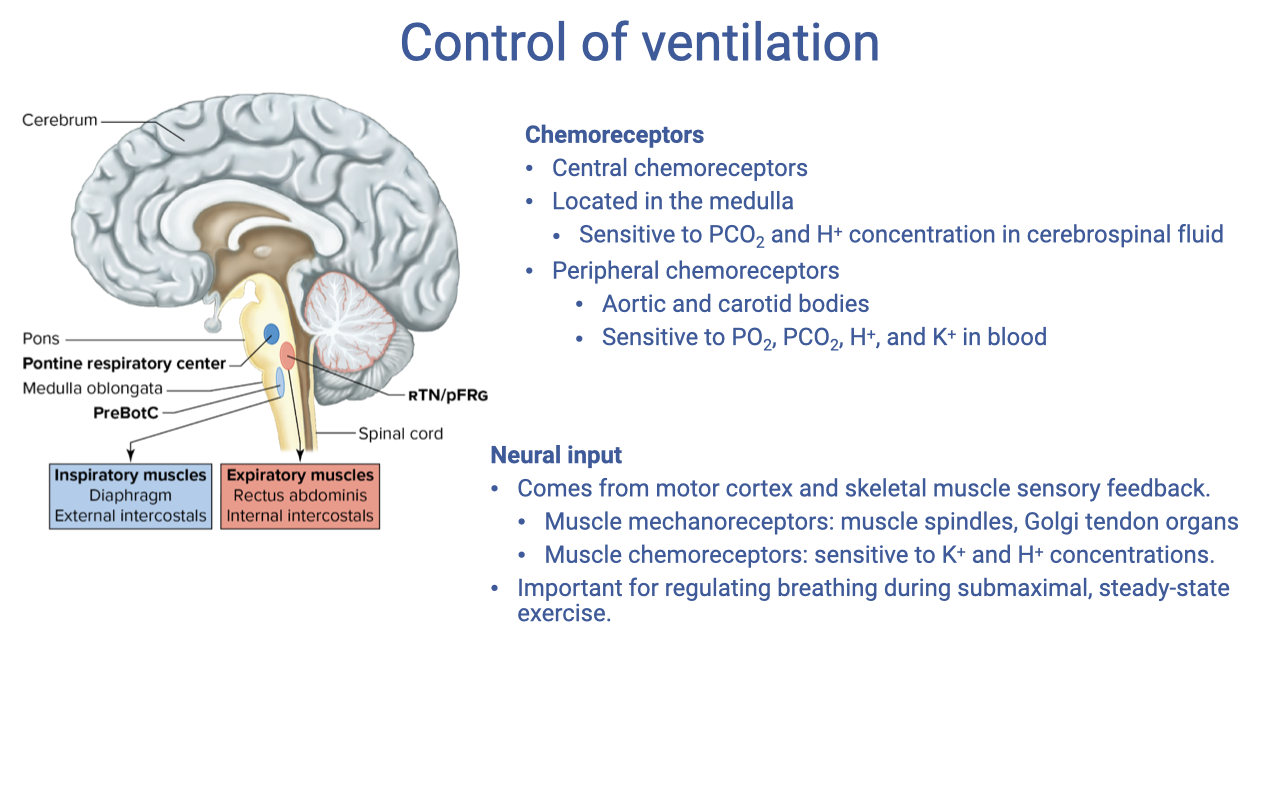
Control of Ventilation
- The brainstem contains rhythmic oscillators that generate the basic breathing pattern and can be modified by multiple inputs.
- Chemoreceptors provide chemical feedback:
- Central chemoreceptors — located in the medulla; sensitive to PCO₂ and H+ concentration in cerebrospinal fluid.
- Peripheral chemoreceptors — located in the aortic bodies and carotid bodies; sensitive to PO₂, H+, and K+ in the blood.
- Neural input contributes both feedforward and feedback signals:
- Motor cortex — descending commands provide an anticipatory (feed-forward) response at exercise onset, increasing breathing before metabolic signals arrive.
- Muscle mechanoreceptors (muscle spindles, Golgi tendon organs) — sense the level of mechanical exertion.
- Muscle chemoreceptors — sensitive to local K+ and H+ concentrations; important for regulating breathing during submaximal, steady-state exercise.
Slide 10
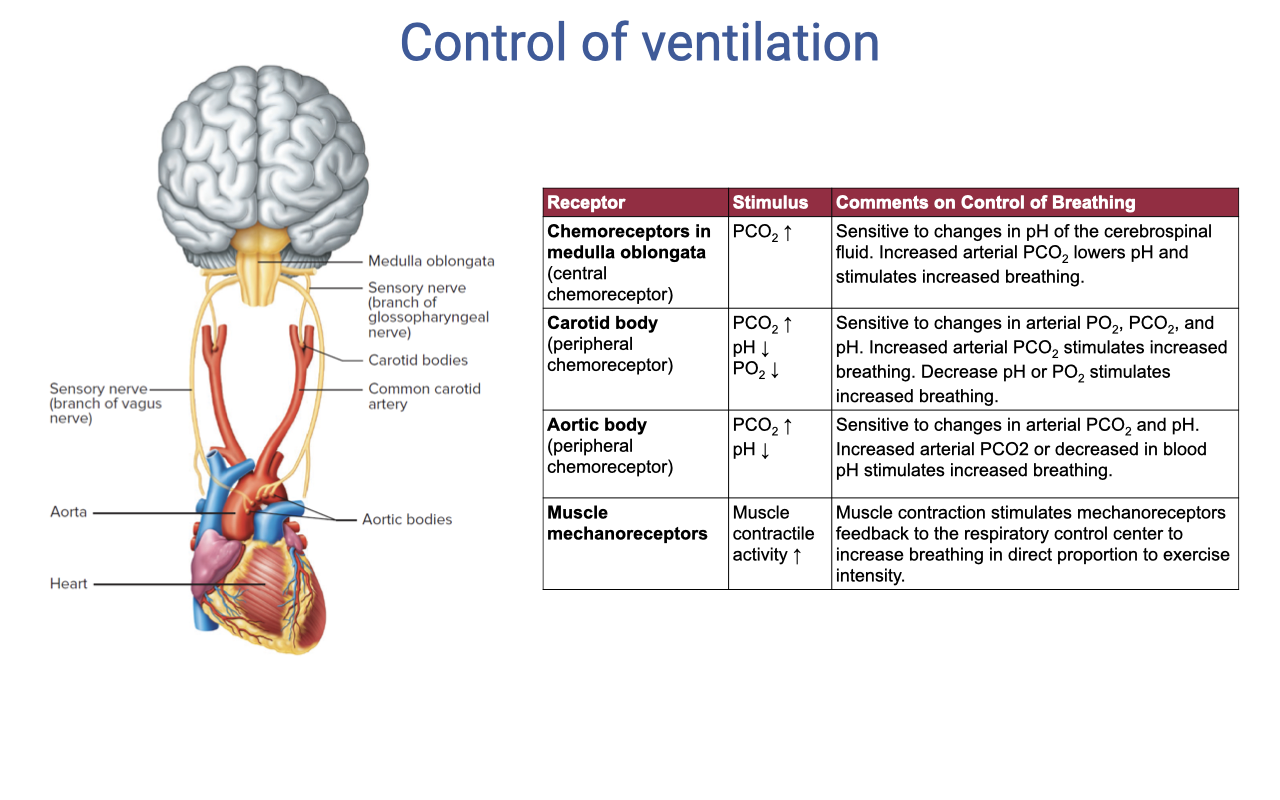
Receptor Types in Ventilatory Control
| Receptor | Stimulus | Effect on Breathing |
|---|---|---|
| Chemoreceptors in medulla oblongata | PCO₂, pH | Sensitive to changes in pH of CSF; increased arterial PCO₂ lowers pH and stimulates increased breathing |
| Carotid body (peripheral chemoreceptor) | PCO₂, pH, PO₂ | Sensitive to changes in arterial PO₂, PCO₂, and pH; increased PCO₂ or decreased PO₂ stimulates increased breathing |
| Aortic body (peripheral chemoreceptor) | PCO₂, pH | Sensitive to arterial PCO₂ and pH; increased arterial PCO₂ or decreased pH stimulates increased breathing |
| Muscle mechanoreceptors | Muscle contraction, activity | Muscle contraction stimulates mechanoreceptors; feedback to respiratory control center increases breathing in direct proportion to exercise intensity |
Slide 11
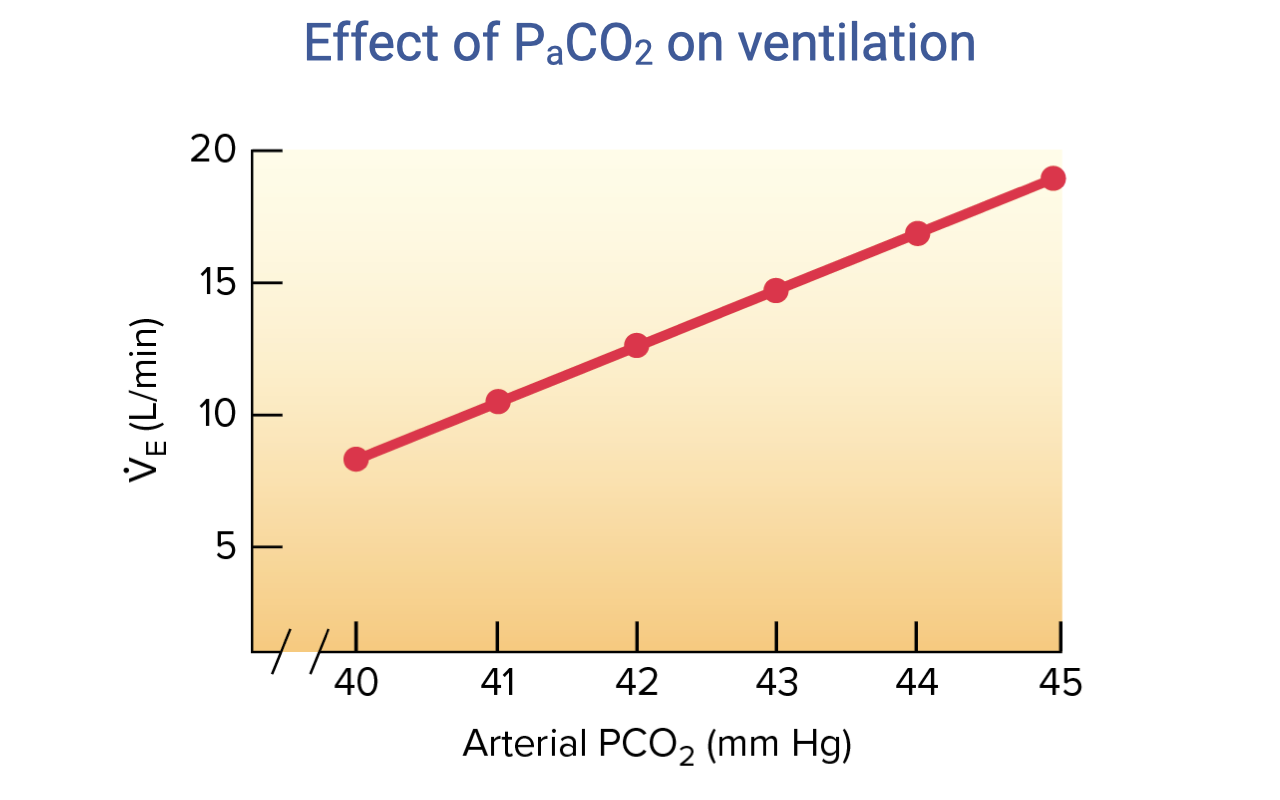
Effect of PaCO2 on Ventilation
- The relationship between arterial PCO₂ and minute ventilation is approximately linear under normal conditions.
- As PaCO2 increases from ~40 to ~45 mmHg, ventilation ($\dot{V}_E$) increases from approximately 8 to 19 L/min.
- This makes CO2 (and its effect on pH) the dominant moment-to-moment controller of ventilation at rest and during exercise.
- Central chemoreceptors in the medulla are primarily responsible for this response — CO2 diffuses across the blood-brain barrier, lowers CSF pH, and stimulates increased breathing.
Slide 12
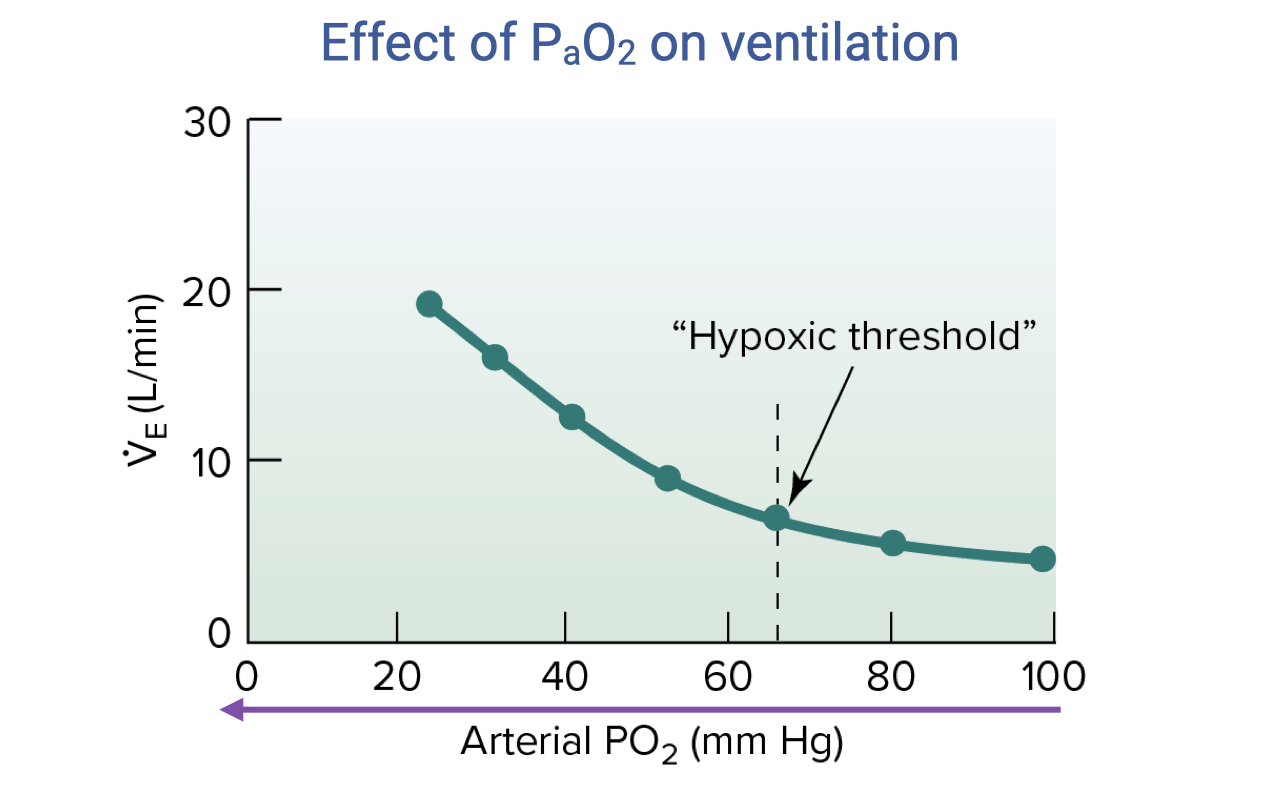
Effect of PaO2 on Ventilation
- The ventilatory response to falling PaO2 is markedly nonlinear.
- At normal arterial PO₂ (~100 mmHg), ventilation is relatively unchanged — O2 is not a significant ventilatory driver at sea level under normal conditions.
- Below a hypoxic threshold of approximately 60–65 mmHg, the response curve becomes exponentially steep, with ventilation rising sharply.
- This threshold is below the normal operating range at sea level, so hypoxia primarily drives ventilation at high altitude or during severe EIAH.
- The steep response below the threshold triggers pronounced hyperventilation at high altitudes where inspired PO₂ is low.
- Peripheral chemoreceptors in the carotid bodies are responsible for sensing arterial PO₂.
Slide 13
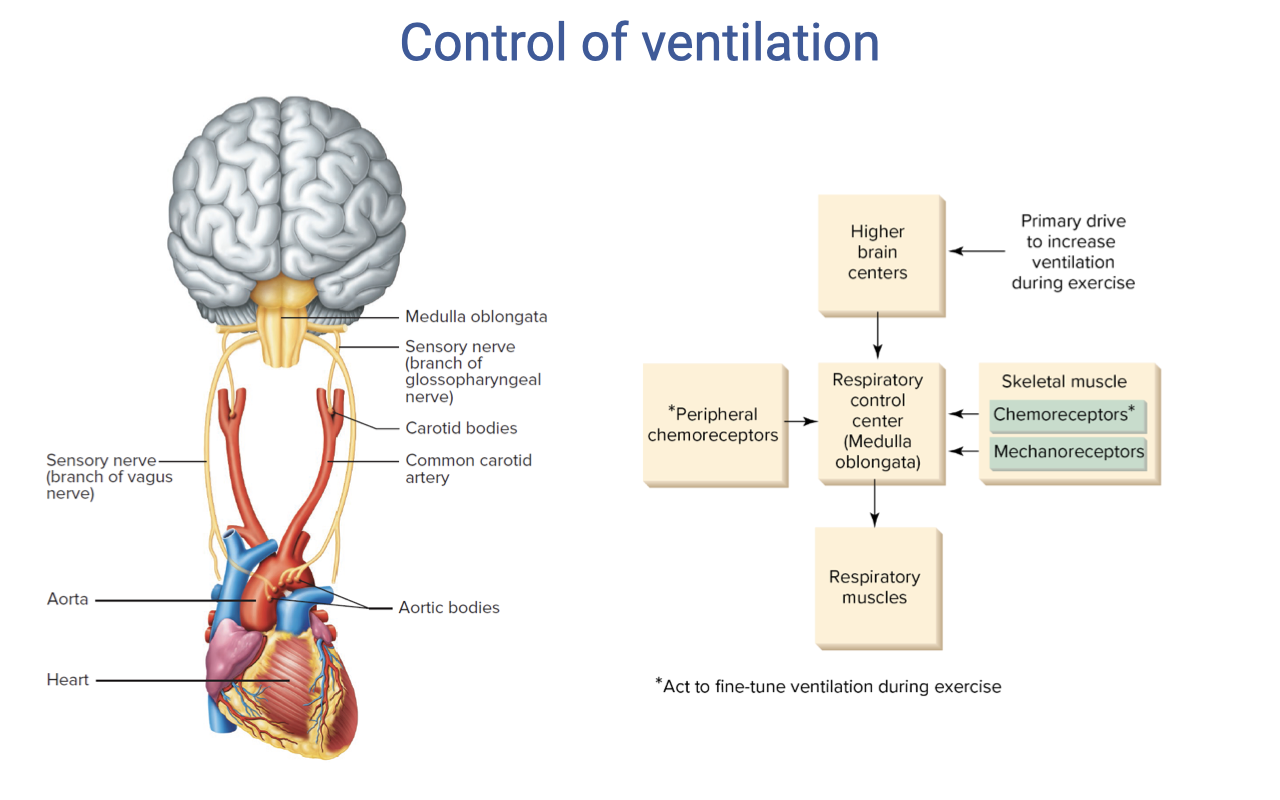
Control of Ventilation — Integrated Schematic
- Multiple inputs converge on the respiratory control center in the medulla and pons:
- Higher brain centers — provide the primary anticipatory drive to increase ventilation at exercise onset (feed-forward).
- Peripheral chemoreceptors (carotid and aortic bodies) — detect changes in arterial PO₂, PCO₂, and pH.
- Skeletal muscle chemoreceptors — sense local metabolic byproducts (H+, K+).
- Skeletal muscle mechanoreceptors — sense mechanical exertion and increase breathing in proportion to exercise intensity.
- The respiratory control center integrates these signals and drives the respiratory muscles (diaphragm, intercostals).
- Muscle afferents (chemoreceptors and mechanoreceptors) act to fine-tune ventilation during submaximal steady-state exercise, matching ventilation to metabolic demand.
Slide 14
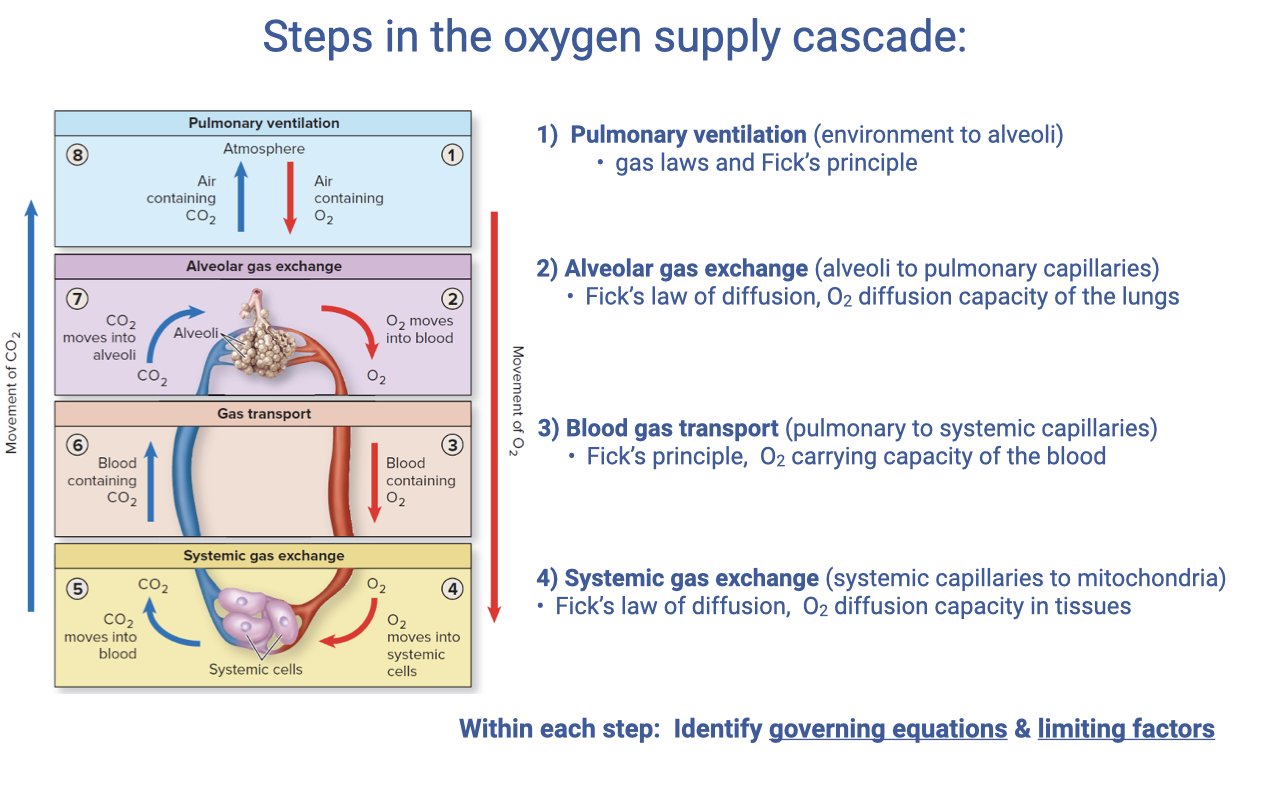
Steps in the Oxygen Supply Cascade
- The oxygen supply cascade consists of four sequential steps, each governed by specific equations and limiting factors:
- Pulmonary ventilation (environment → alveoli) — gas laws and the Fick principle
- Alveolar gas exchange (alveoli → pulmonary capillaries) — Fick’s law of diffusion, O2 diffusion capacity of the lungs
- Blood gas transport (pulmonary → systemic capillaries) — Fick’s principle for bulk flow, O2 carrying capacity of the blood
- Systemic gas exchange (systemic capillaries → mitochondria) — Fick’s law of diffusion, O2 diffusion capacity in tissues
- This lecture extends focus to Step 3 — blood gas transport — applying the Fick principle to the cardiovascular system rather than ventilation.
Slide 15
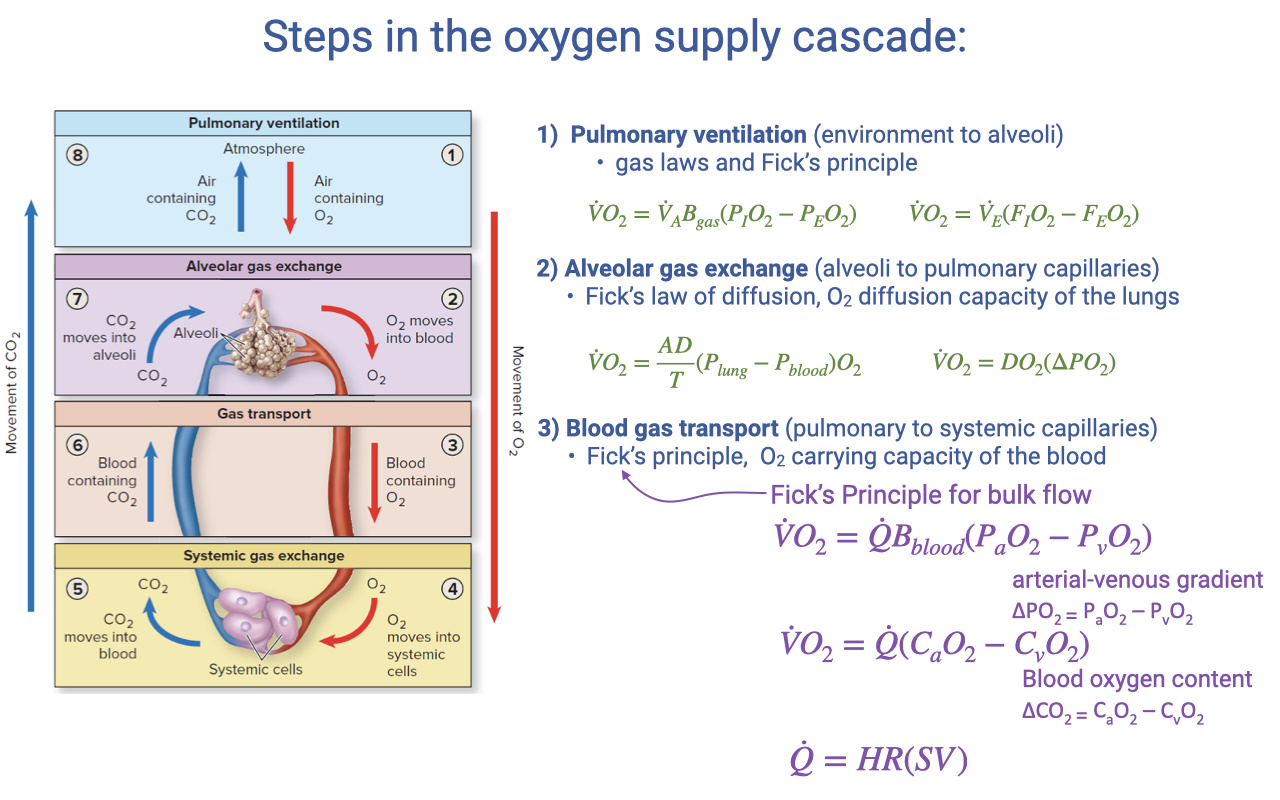
Fick Principle Applied to Blood Gas Transport
- The Fick principle for blood gas transport (Step 3) states:
- Where $\dot{Q}$ is cardiac output (L/min), $B_{blood}$ is the oxygen-carrying coefficient of the blood, and $(P_aO_2 - P_vO_2)$ is the arterial-venous partial pressure gradient.
- This can also be expressed in terms of blood oxygen content:
- Where $C_aO_2$ is arterial O2 content and $C_{\bar{v}}O_2$ is mixed venous O2 content. The difference is the a-v O2 difference.
- Cardiac output is the product of heart rate and stroke volume:
- This equation is directly parallel to the ventilatory Fick equation from Step 1, but with different variables — blood flow rate instead of ventilation rate, and blood O2 carrying capacity instead of air O2 fraction.
Slide 16
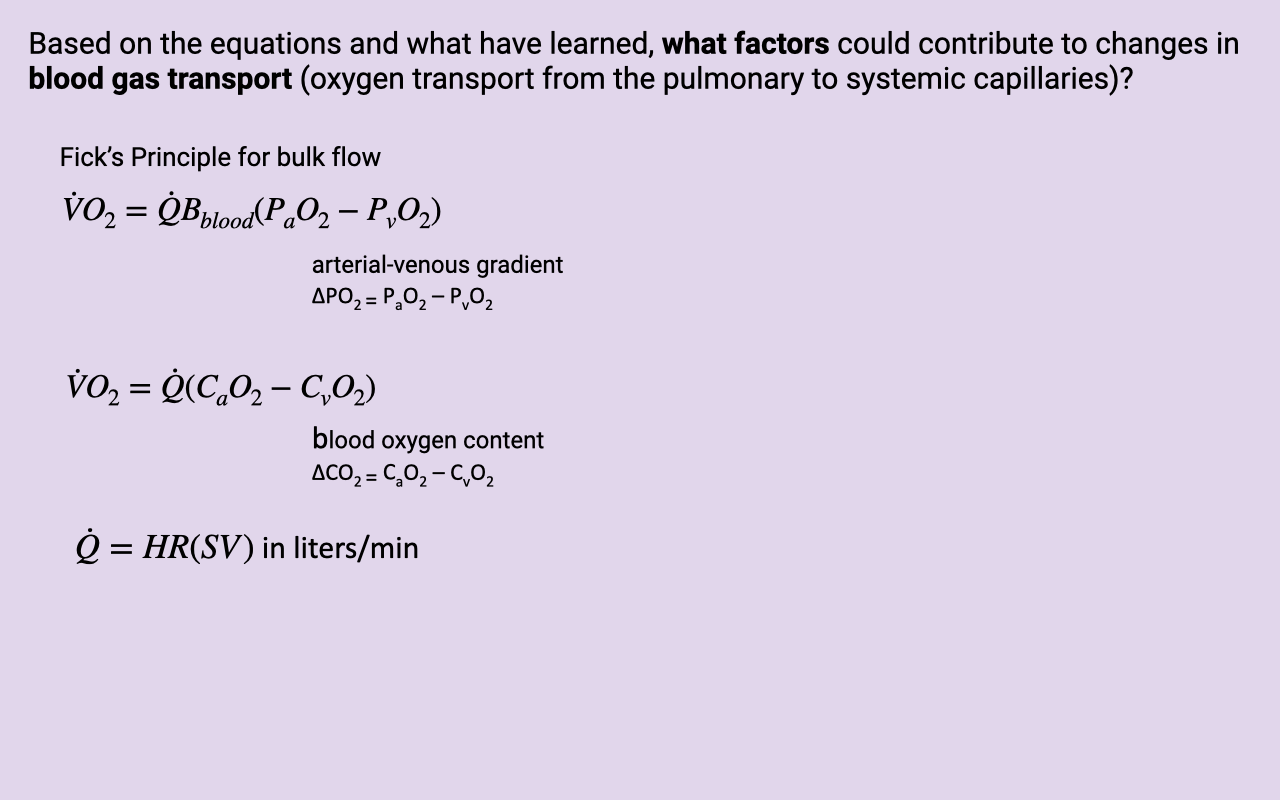
Class Activity: Factors in Blood Gas Transport
- Students are asked to consider which factors in the Fick equation could contribute to changes in blood gas transport.
- Key variables to consider:
- Cardiac output ($\dot{Q}$) — determined by heart rate (HR) and stroke volume (SV)
- O2-carrying coefficient ($B_{blood}$) — how much O2 the blood can carry per unit volume (related to hemoglobin concentration and properties)
- Arterial-venous partial pressure gradient ($\Delta P_{O_2} = P_aO_2 - P_vO_2$) — the driving force for O2 delivery
- Blood oxygen content difference ($\Delta CO_2 = C_aO_2 - C_{\bar{v}}O_2$)
- Each of these can be modulated by different physiological conditions and adaptations during exercise.
Slide 17
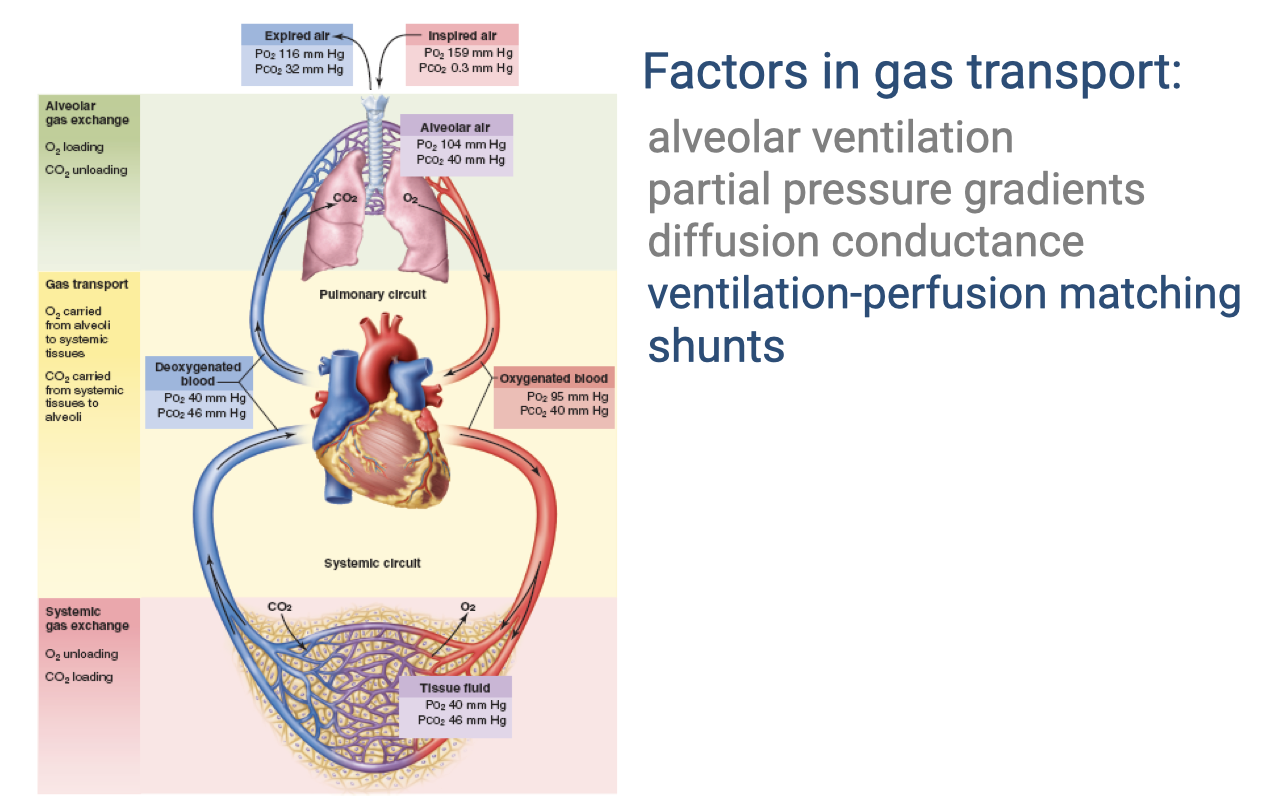
Factors in Gas Transport
- The efficiency of gas transport depends on multiple factors at each step of the cascade:
- Alveolar ventilation — rate of fresh air delivery to alveoli
- Partial pressure gradients — the driving force for diffusion at each step
- Diffusion conductance — determined by membrane thickness and surface area
- Ventilation-perfusion matching (highlighted) — how well airflow is matched to blood flow in the lungs
- Shunts (highlighted) — blood flow that bypasses the gas-exchange surface
- The lecture now focuses on ventilation-perfusion matching and shunts as key factors linking the ventilatory and circulatory systems.
Slide 18
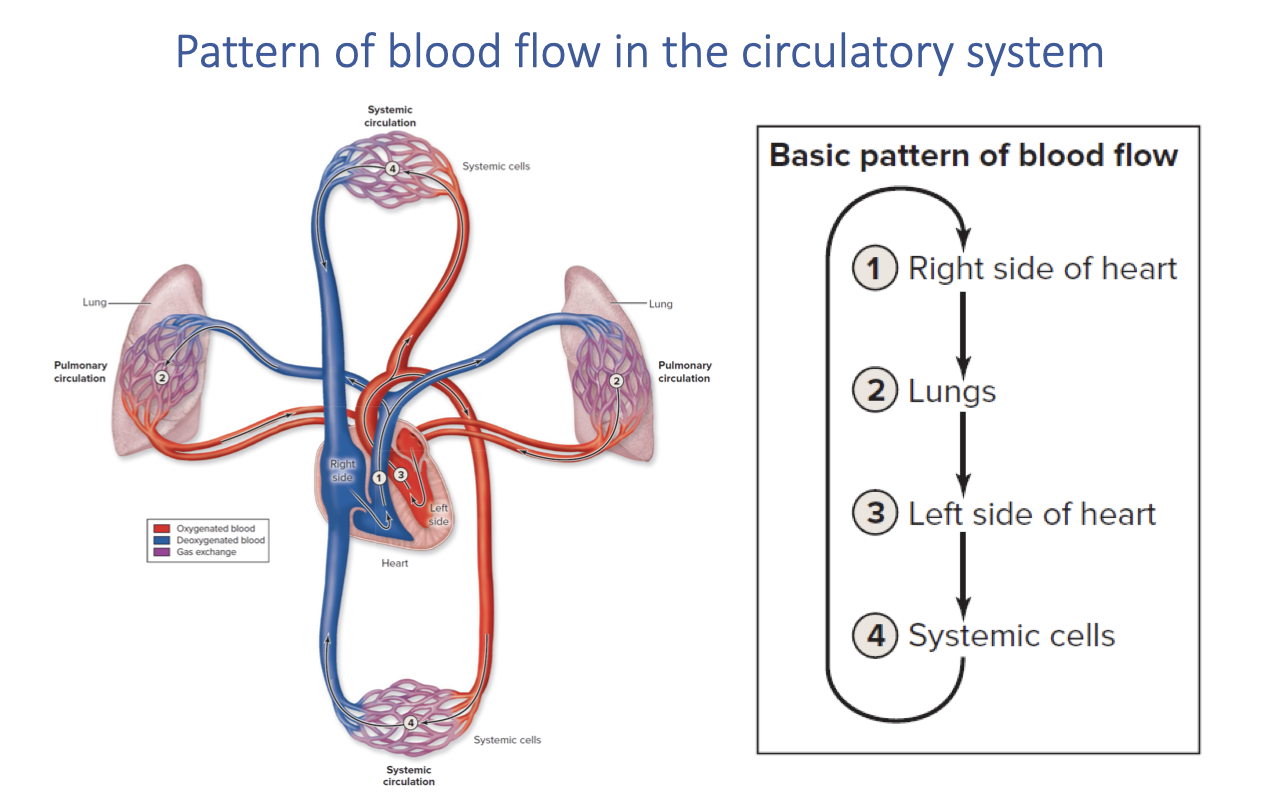
Pattern of Blood Flow in the Circulatory System
- In mammals, the heart is fully divided into four chambers, creating two completely separate circuits:
- Right side of heart → pumps deoxygenated blood to the lungs
- Lungs → gas exchange occurs; blood becomes oxygenated
- Left side of heart → receives oxygenated blood and pumps it to the body
- Systemic cells → O2 is delivered and CO2 is picked up; blood returns deoxygenated to the right heart
- The complete separation of pulmonary and systemic circuits in mammals and birds allows different pressures to be maintained on each side.
- The effectiveness of O2 uptake depends critically on how well the lungs are perfused with deoxygenated blood at the right rate to match ventilation.
Slide 19
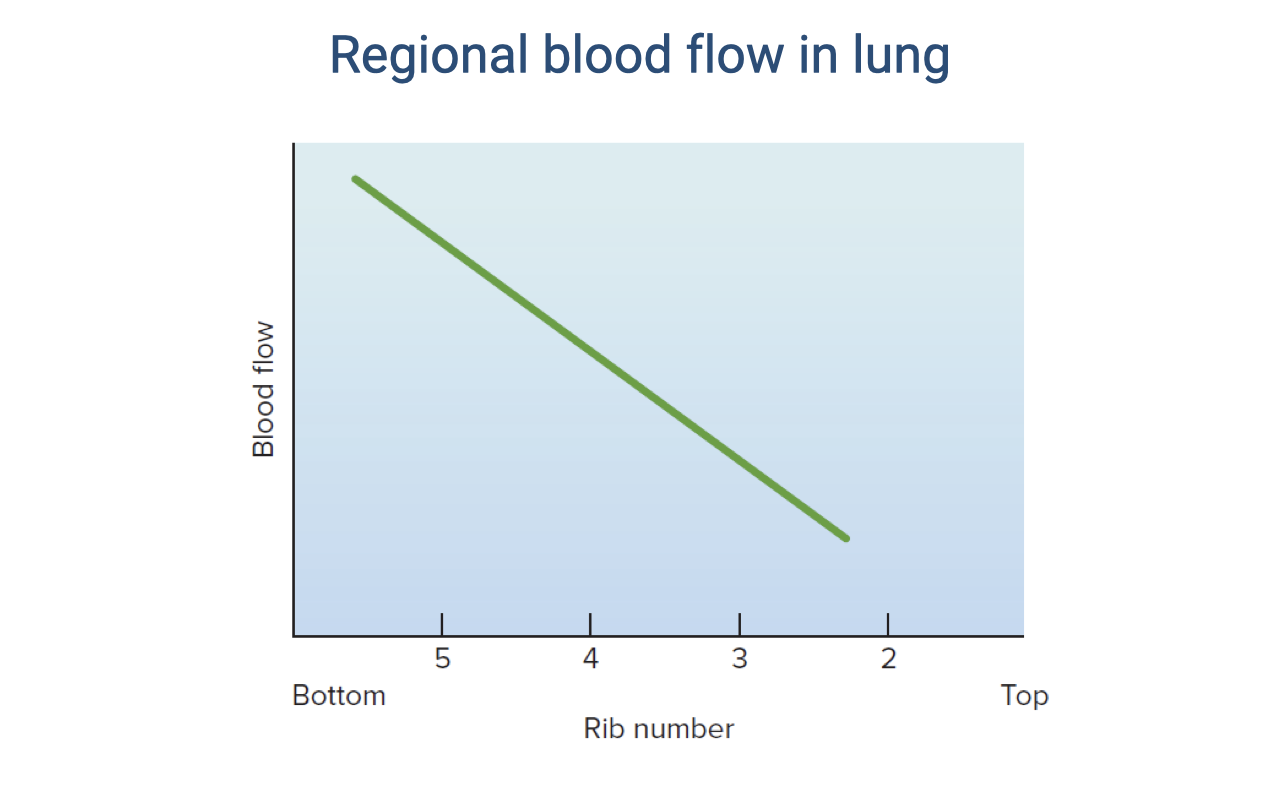
Regional Blood Flow in the Lung
- Blood flow within the lung is not uniform — it varies by region due to the effect of gravity.
- At rest in an upright position, blood flow is highest at the base of the lung (near rib 5) and lowest at the apex (near rib 2).
- The green line shows a roughly linear decline in blood flow from base to apex.
- This uneven distribution of perfusion has important consequences for ventilation-perfusion matching — regions with high blood flow but relatively lower ventilation will have reduced gas-exchange efficiency.
- During exercise, this distribution can change as increased cardiac output recruits more pulmonary capillaries, including those at the apex.
Slide 20
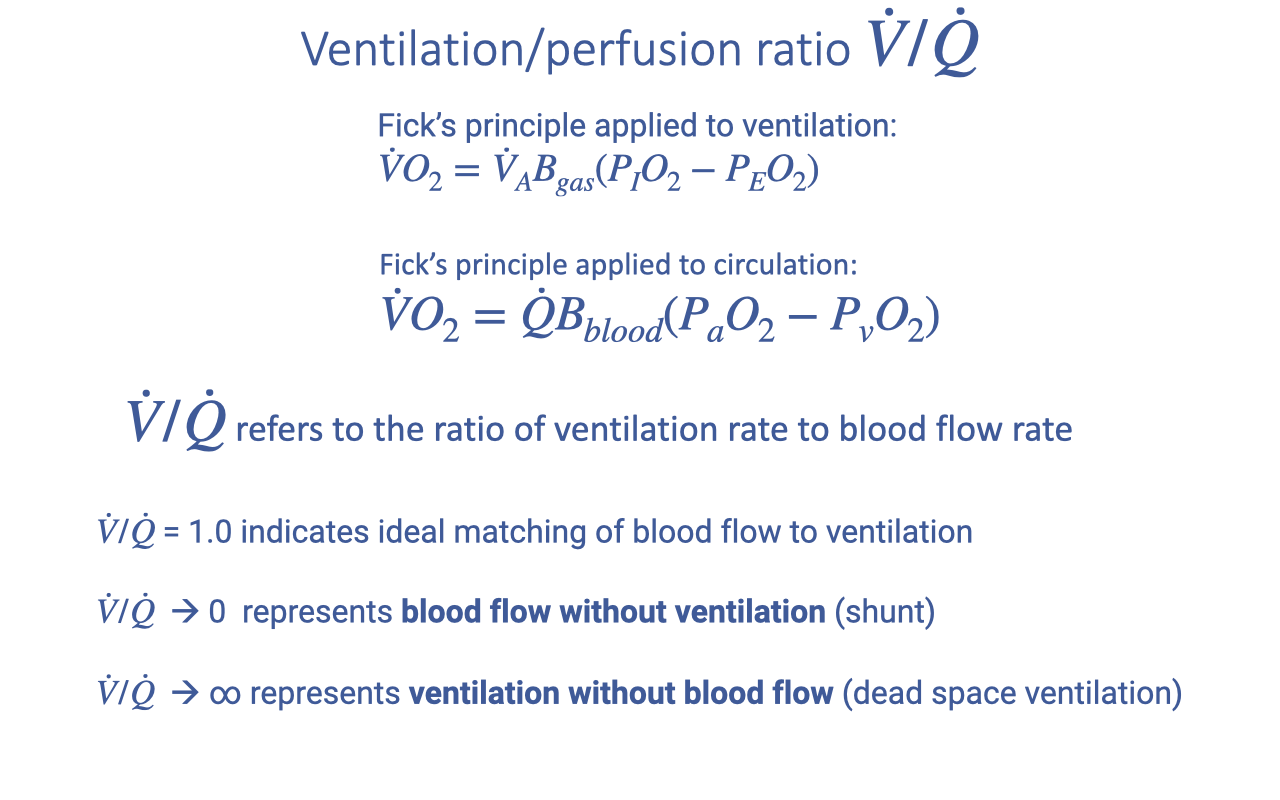
Ventilation-Perfusion Ratio (V/Q)
- The ventilation-perfusion ratio ($\dot{V}/\dot{Q}$) is the ratio of alveolar ventilation rate to blood flow rate in the lungs.
- It connects the two Fick equations:
- Fick’s principle applied to ventilation: $\dot{V}O_2 = \dot{V}_A B_{gas}(P_IO_2 - P_EO_2)$
- Fick’s principle applied to circulation: $\dot{V}O_2 = \dot{Q} B_{blood}(P_aO_2 - P_vO_2)$
- Key interpretations of the ratio:
- $\dot{V}/\dot{Q} \approx 1.0$ — ideal matching of blood flow to ventilation for optimal gas exchange
- $\dot{V}/\dot{Q} \to 0$ — blood flow without ventilation = shunt (blood bypasses gas exchange)
- $\dot{V}/\dot{Q} \to \infty$ — ventilation without blood flow = dead space ventilation
- Either extreme decreases the efficiency of O2 uptake.
Slide 21
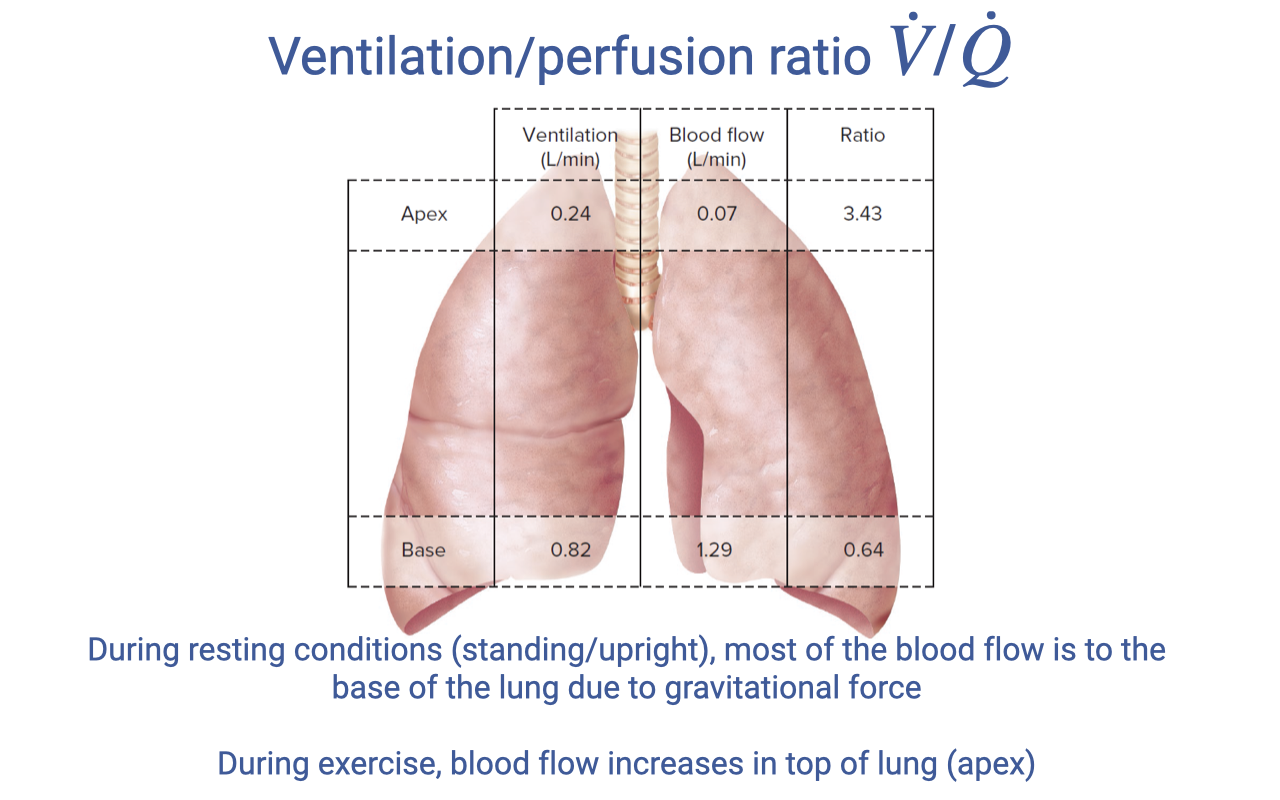
Regional V/Q Variation in the Lung
| Region | Ventilation (L/min) | Blood Flow (L/min) | V/Q Ratio |
|---|---|---|---|
| Apex (top) | 0.24 | 0.07 | 3.43 |
| Base (bottom) | 0.82 | 1.29 | 0.64 |
- At rest in an upright position, most blood flows to the base of the lung due to gravity.
- The base has a V/Q ratio of 0.64 (below 1.0) — it is overperfused relative to ventilation, representing some functional shunt.
- The apex has a V/Q ratio of 3.43 (well above 1.0) — it is underperfused relative to ventilation, representing dead space ventilation.
- During exercise, increased cardiac output recruits more capillaries at the apex, improving blood flow distribution and potentially bringing the V/Q ratio closer to the ideal of 1.0.
Slide 22
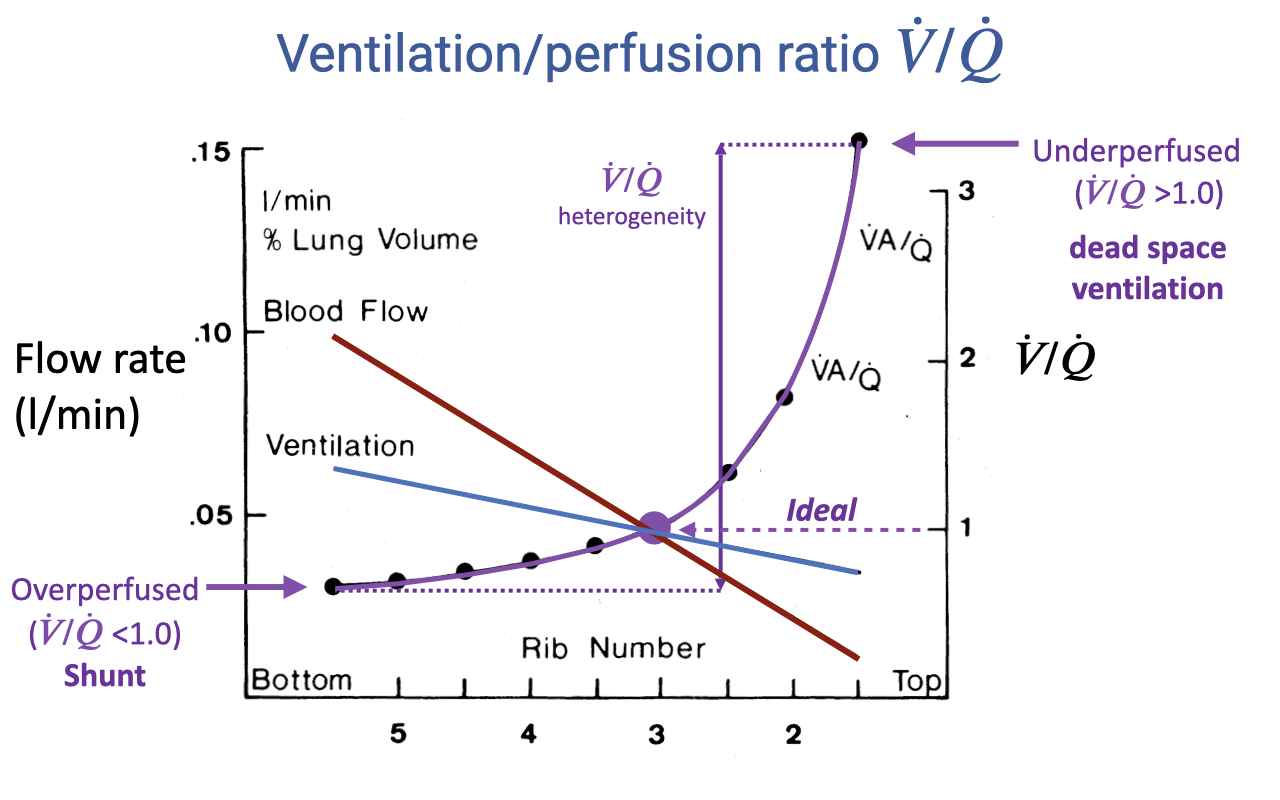
V/Q Heterogeneity Across the Lung
- This graph illustrates how both ventilation and blood flow vary across lung regions, and how their ratio determines V/Q matching.
- Blood flow (red line) declines steeply from base to apex — the base receives much more blood flow than the apex.
- Ventilation (blue line) also declines from base to apex, but the slope is shallower — ventilation is more evenly distributed than blood flow.
- The V/Q ratio (purple line) is the ratio of these two curves:
- At the base: V/Q < 1.0 — overperfused, representing functional shunt
- At the apex: V/Q > 1.0 — underperfused, representing dead space ventilation
- The V/Q heterogeneity — the spread between the highest and lowest V/Q values — determines gas-exchange efficiency. An ideal lung would have V/Q = 1.0 across all regions.
- Greater heterogeneity means less efficient O2 uptake overall.
Slide 23
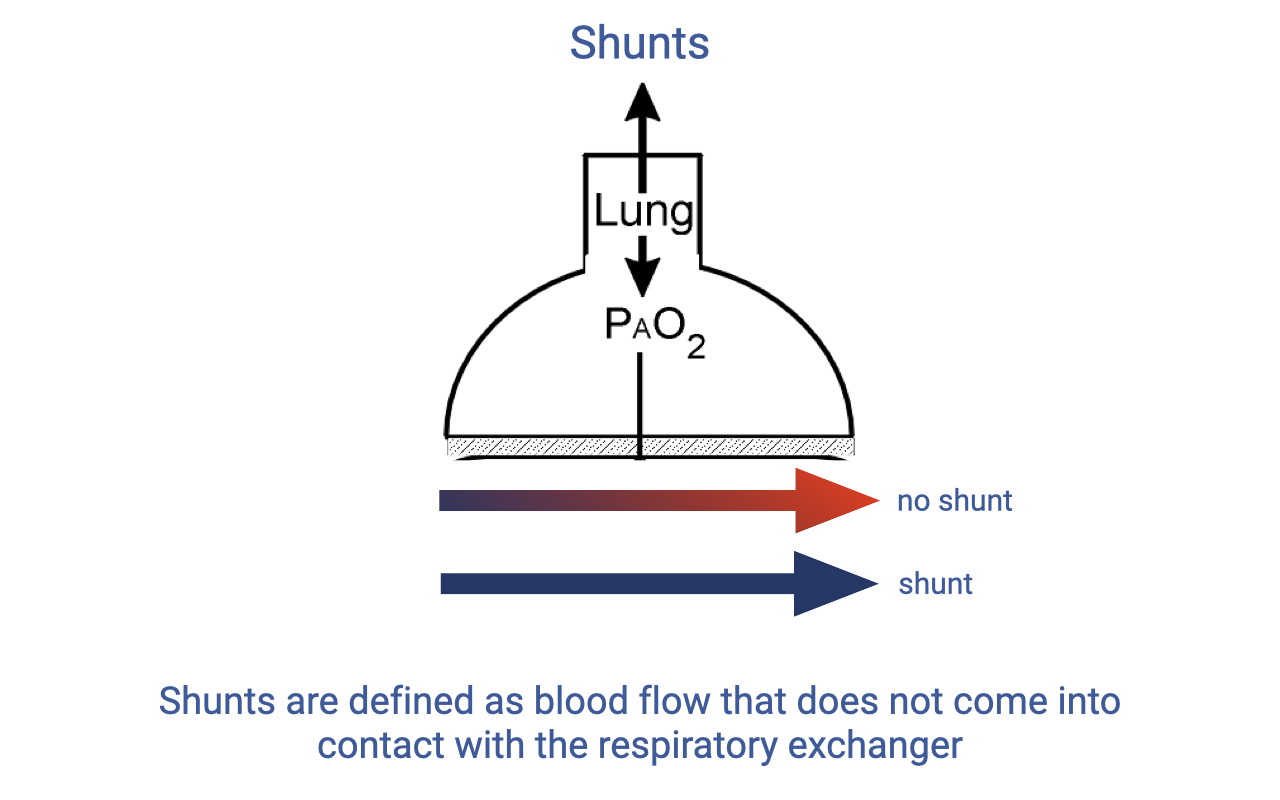
Shunts
- A shunt is defined as blood flow that does not come into contact with the respiratory gas exchanger.
- In normal function, blood flows through pulmonary capillaries adjacent to alveoli, picks up O2, and exits oxygenated (red arrow, “no shunt”).
- In a shunt, blood bypasses the gas-exchange surface entirely and exits the pulmonary circuit still deoxygenated (blue arrow).
- Shunts reduce the overall efficiency of O2 uptake because the shunted blood mixes with oxygenated blood in the left heart, lowering arterial O2 content.
- Some degree of shunt occurs normally in the human lung at rest, particularly in the base regions where V/Q < 1.0.
- Shunts are more pronounced in some non-mammalian vertebrates due to incomplete ventricular division.
Slide 24
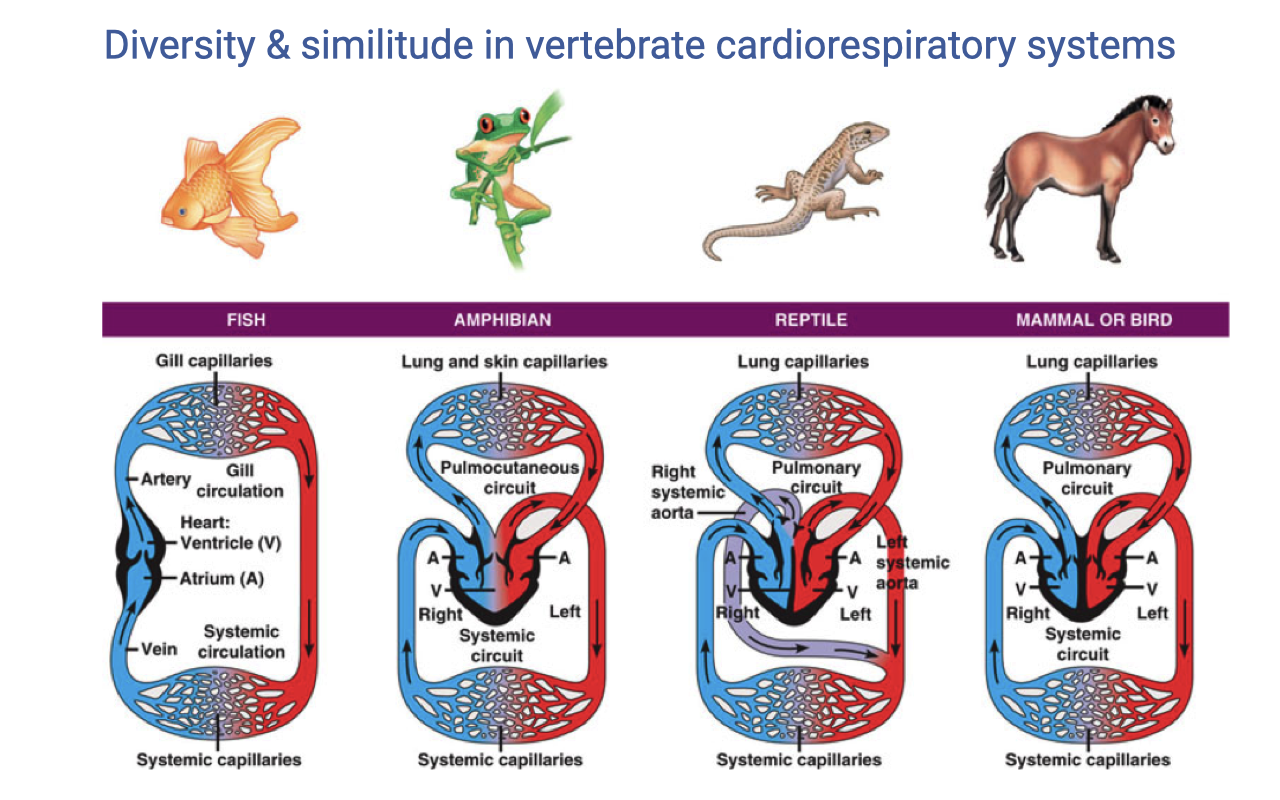
Diversity in Vertebrate Cardiorespiratory Systems
- Vertebrate groups show fundamentally different cardiovascular architectures:
- Fish — single-loop circulation with a two-chambered heart (one atrium, one ventricle); blood passes through gill capillaries then directly to systemic capillaries.
- Amphibians — three-chambered heart with a shared ventricle; a pulmocutaneous circuit (lungs and skin) and a systemic circuit exist, but oxygenated and deoxygenated blood mix in the ventricle.
- Reptiles — partially divided ventricle with incomplete septum; mixing of oxygenated and deoxygenated blood creates a cardiac shunt at rest.
- Mammals and birds — fully divided four-chambered heart with completely separate pulmonary and systemic circuits, allowing different pressures on each side.
- Mammals and birds independently evolved complete ventricular division — a case of convergent evolution associated with high aerobic capacity.
Slide 25
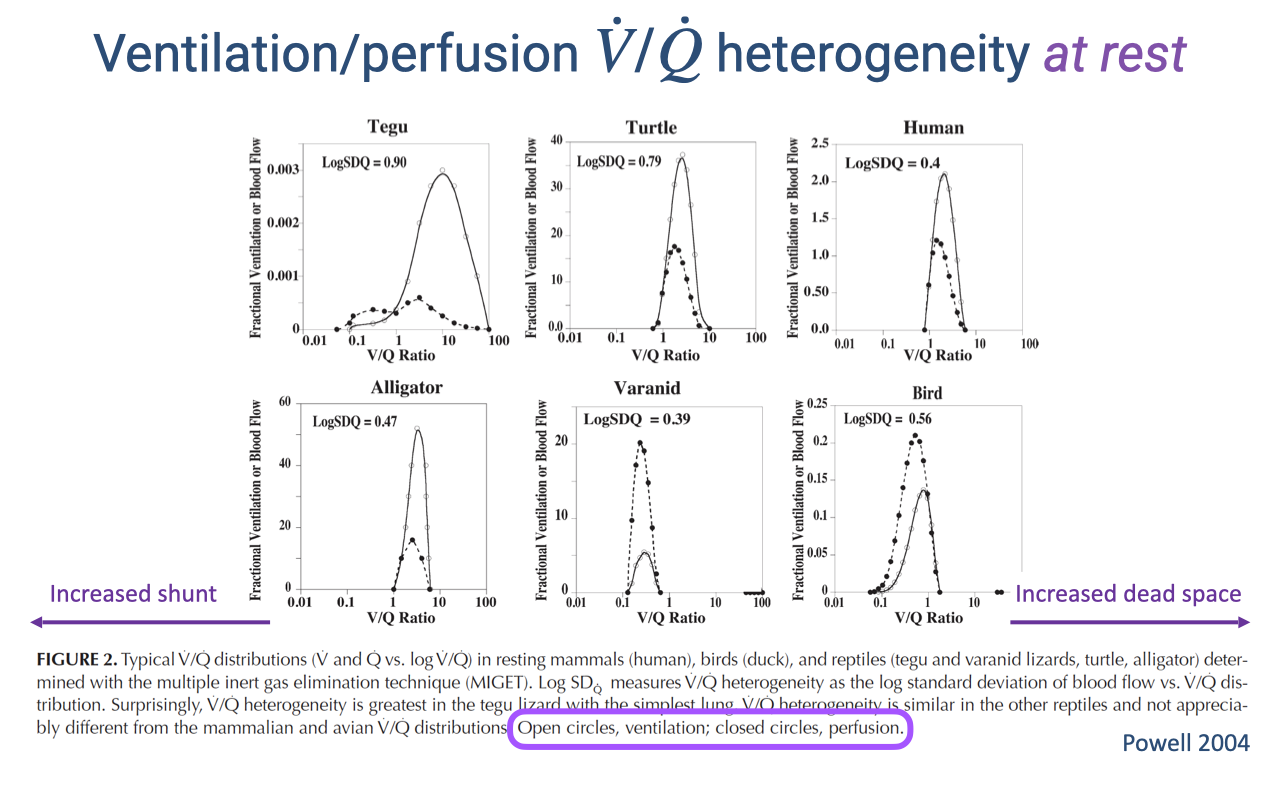
V/Q Heterogeneity at Rest Across Species
- V/Q distributions vary substantially across vertebrate species at rest.
- The tegu (lizard) and turtle show high V/Q heterogeneity (log SDQ ≈ 1.0), with distributions skewed to the left of 1.0 — indicating significant shunt at rest.
- The human shows lower heterogeneity (log SDQ ≈ 0.5), with the distribution centered closer to the ideal ratio of 1.0.
- Open circles represent ventilation distribution; closed circles represent perfusion distribution.
- The higher heterogeneity in reptiles reflects their incompletely divided hearts, which allow mixing of oxygenated and deoxygenated blood — a functional cardiac shunt.
- Surprisingly, V/Q heterogeneity is greater in some reptile species than in mammals, reaching nearly twice the human value.
Slide 26
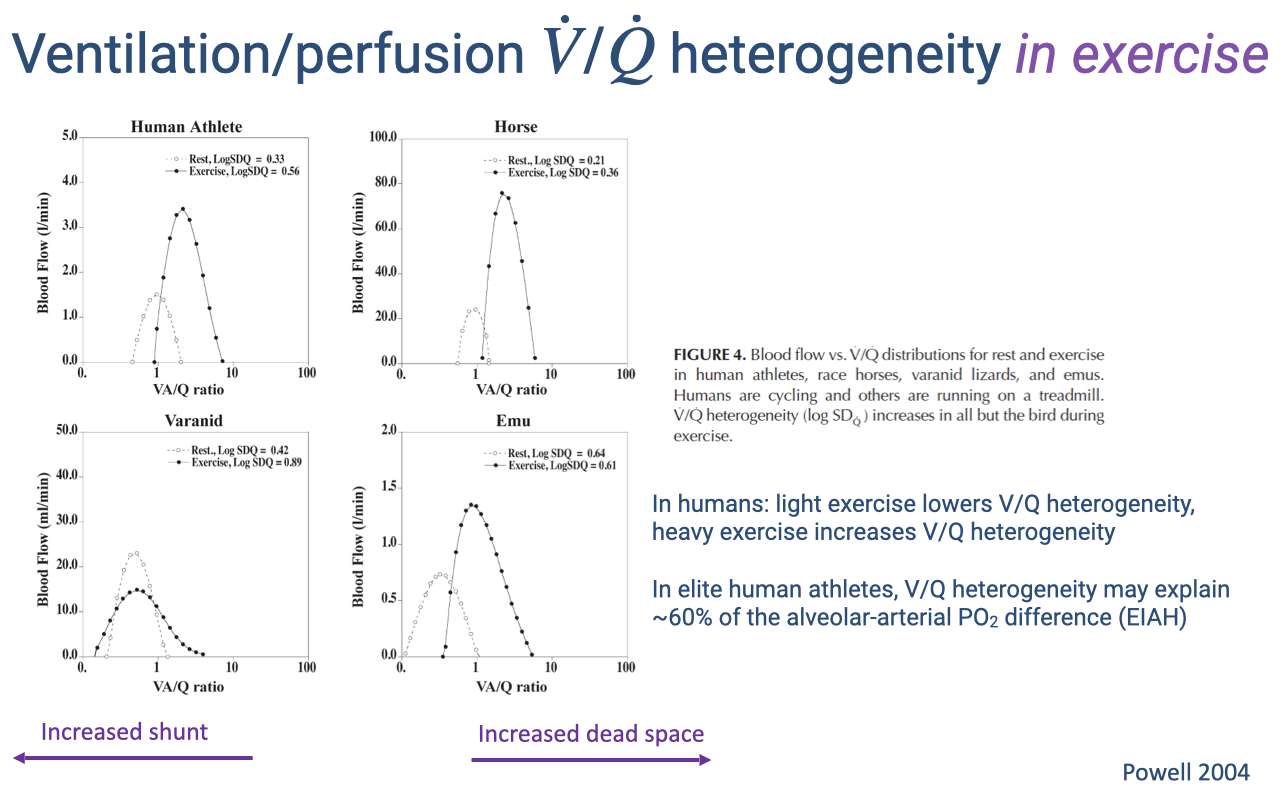
V/Q Heterogeneity Changes During Exercise
- V/Q distributions shift between rest and exercise differently across species:
- Human athletes — light exercise improves V/Q matching (lowers heterogeneity), but heavy exercise increases heterogeneity, contributing to EIAH.
- Horses — V/Q heterogeneity increases during exercise, consistent with EIAH observed in thoroughbred racehorses.
- Varanid lizards — the resting shunt decreases during exercise, shifting the V/Q distribution rightward toward 1.0, improving gas-exchange efficiency.
- Emus (birds) — the distribution becomes centered near 1.0 during exercise, maintaining low heterogeneity. V/Q heterogeneity does not increase during exercise in birds.
- In elite human athletes, V/Q heterogeneity may explain approximately 60% of the alveolar-arterial PO₂ difference associated with EIAH.
- Birds’ superior V/Q matching during exercise is linked to the structural separation of ventilation and gas exchange in the parabronchial lung — a topic explored in detail in Week 2 Lecture 6: Comparative Pulmonary Function.
Slide 27
Lecture 7 — Key Takeaways
- Pulmonary function is not typically the limiting factor for exercise performance in most individuals, but it does limit 40–50% of elite athletes who experience exercise-induced arterial hypoxemia (EIAH). Training has limited effect on lung structure due to the lung’s passive tissue composition.
- Ventilation is controlled by brainstem respiratory centers receiving input from central chemoreceptors (CO2/pH in CSF), peripheral chemoreceptors (PO₂, PCO₂, pH, K+), motor cortex (anticipatory drive), and muscle mechanoreceptors/chemoreceptors (fine-tuning during exercise).
- The Fick principle applied to blood gas transport ($\dot{V}O_2 = \dot{Q}(C_aO_2 - C_{\bar{v}}O_2)$) parallels the ventilatory Fick equation, with cardiac output ($\dot{Q} = HR \times SV$) and the arteriovenous O2 difference as key variables.
- The ventilation-perfusion ratio (V/Q) must be near 1.0 for optimal gas exchange; V/Q < 1.0 represents shunt and V/Q > 1.0 represents dead space ventilation. V/Q heterogeneity across lung regions reduces gas-exchange efficiency, and is greater in elite human athletes during heavy exercise (contributing to EIAH) but lower in birds, whose parabronchial lungs maintain efficient matching even during exercise.
Key Equations
| Equation | Name | Description |
|---|---|---|
| $\dot{V}O_2 = \dot{Q} \cdot B_{blood}(P_aO_2 - P_vO_2)$ | Fick principle (blood gas transport) | O2 consumption from cardiac output, blood O2-carrying coefficient, and arterial-venous partial pressure gradient |
| $\dot{V}O_2 = \dot{Q}(C_aO_2 - C_{\bar{v}}O_2)$ | Fick principle (blood O2 content form) | O2 consumption from cardiac output and the arteriovenous O2 content difference (a-v O2 diff) |
| $\dot{Q} = HR \times SV$ | Cardiac output | Cardiac output (L/min) equals heart rate (beats/min) times stroke volume (mL/beat) |
| $\dot{V}/\dot{Q} \approx 1.0$ | Ideal ventilation-perfusion ratio | Ratio of alveolar ventilation to pulmonary blood flow; 1.0 indicates optimal matching for gas exchange |
Glossary of Key Terms
| Term | Definition |
|---|---|
| Exercise-induced arterial hypoxemia (EIAH) | A decrease in arterial O2 saturation during high-intensity exercise, observed in 40–50% of elite athletes; indicates a pulmonary limitation on O2 uptake. |
| Central chemoreceptors | Neurons on the ventral medullary surface that detect changes in cerebrospinal fluid pH caused by CO2 diffusing across the blood-brain barrier; the primary driver of resting ventilation. |
| Peripheral chemoreceptors | Carotid bodies and aortic bodies that detect arterial PO₂, PCO₂, pH, and K+; the carotid bodies are the primary peripheral O2 sensors. |
| Muscle mechanoreceptors | Sensory receptors in skeletal muscle (muscle spindles, Golgi tendon organs) that sense mechanical exertion and increase breathing in proportion to exercise intensity. |
| Muscle chemoreceptors | Sensory receptors in skeletal muscle that detect local metabolic byproducts (H+, K+); fine-tune ventilation during submaximal steady-state exercise. |
| Hypoxic threshold | The arterial PO₂ (~60 mmHg) below which the ventilatory response to hypoxia becomes steeply exponential; important at high altitude. |
| Ventilation-perfusion ratio (V/Q) | The ratio of alveolar ventilation to pulmonary blood flow; V/Q = 1.0 is ideal; V/Q < 1.0 indicates shunt; V/Q > 1.0 indicates dead space ventilation. |
| V/Q heterogeneity | The variation in V/Q ratio across different lung regions; greater heterogeneity reduces overall gas-exchange efficiency. |
| Shunt | Blood flow that bypasses the gas-exchange surface without becoming oxygenated; results from V/Q < 1.0 or, in non-mammalian tetrapods, from incomplete ventricular division. |
| Dead space ventilation | Ventilation of lung regions with no blood flow (V/Q → ∞); air enters but no gas exchange occurs, wasting ventilatory effort. |
| Cardiac output ($\dot{Q}$) | Volume of blood pumped per minute by one ventricle; product of heart rate and stroke volume (L/min). |
| a-v O2 difference | The difference in O2 content between arterial and mixed venous blood; reflects the amount of O2 extracted by the tissues per unit of blood. |