Week 5 Friday Review and Discussion
Slide 1

- Friday review and discussion session for Week 5: Introduction to Muscle Structure and Function.
- Builds on the cellular- and tissue-scale material (Lectures 11–12) by examining plasticity (training-induced changes), aging (sarcopenia and hybrid fibers), and applications (high heels and the power–velocity practice problem).
- Closes with two practice activities that revisit the F–V/power–velocity relationship and the cellular zero-sum game from a problem-solving angle.
Slide 2
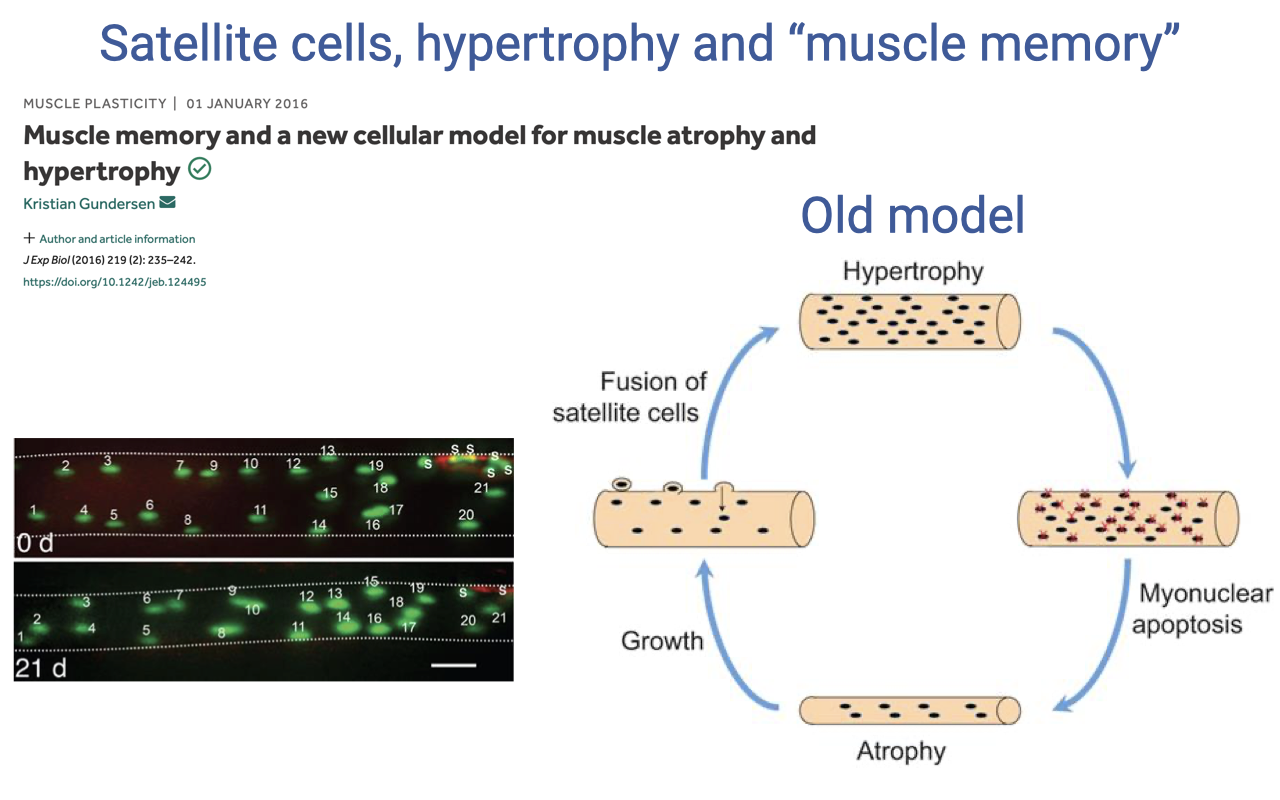
Satellite Cells and the OLD Model of Hypertrophy/Atrophy
- Satellite cells are muscle stem cells lying just beneath the sarcolemma. When activated by training, injury, or other stimuli, they proliferate, fuse with existing fibers, and donate new myonuclei — supporting the larger volume of cytoplasm that hypertrophied fibers require.
- The old model of muscle plasticity (Gundersen 2016) treated the myonuclear pool as transient:
- Hypertrophy → satellite cells fuse, adding myonuclei in proportion to volume.
- Atrophy (detraining) → myonuclear apoptosis removes myonuclei back to the original count.
- Re-growth required another round of satellite-cell fusion to rebuild the myonuclear pool.
- In this view, every detraining-retraining cycle started from cellular “scratch” — there was no cellular memory of prior training.
Slide 3
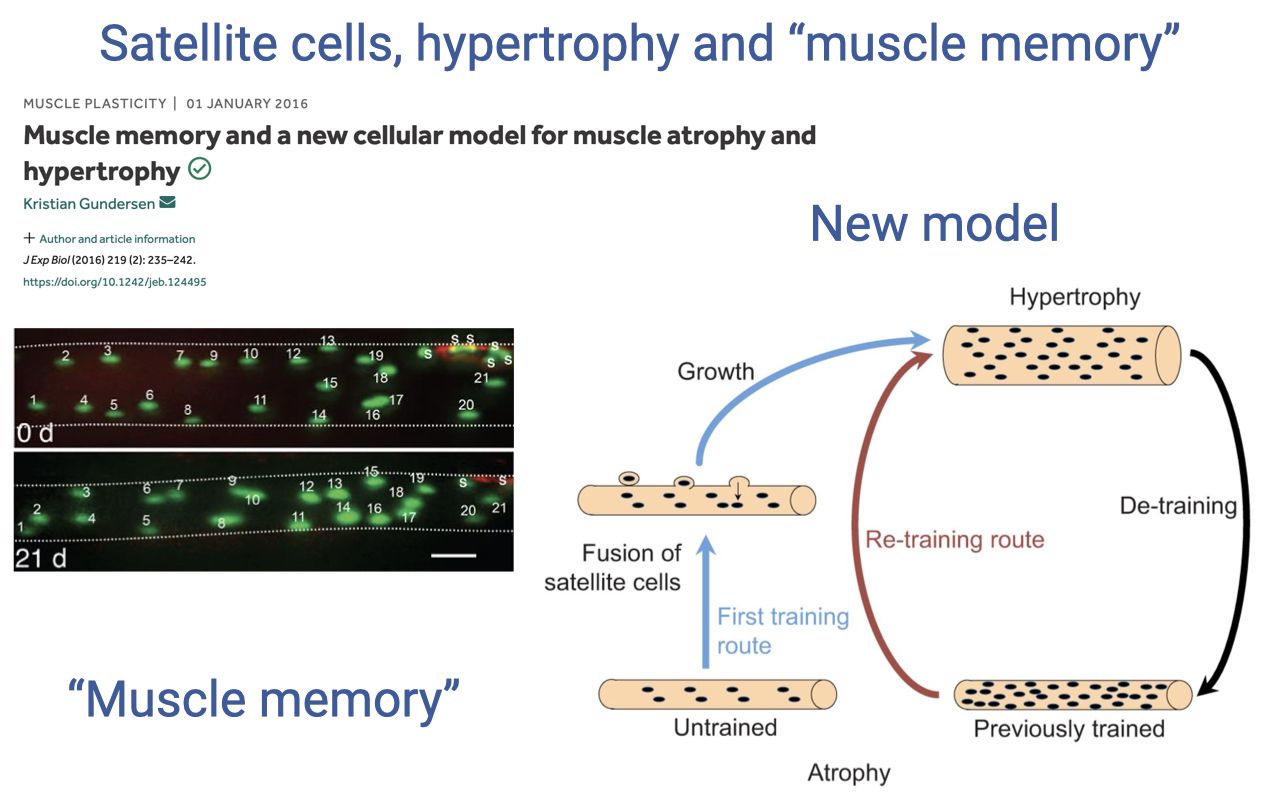
The NEW Model — Myonuclear Retention and “Muscle Memory”
- More recent evidence (Gundersen 2016 and later work) supports a new model:
- When previously trained muscle undergoes detraining, the myonuclei are retained rather than apoptosing — even as the cytoplasm and contractile machinery shrink.
- On re-training, the existing myonuclei can rapidly resume protein synthesis, allowing faster regrowth without requiring a second wave of satellite-cell fusion.
- This is the cellular basis for “muscle memory” — why people who have previously trained a muscle group often regain strength much faster on returning to training than they did the first time.
- Practical implications:
- Early training establishes a lasting myonuclear pool that lowers the cellular cost of subsequent re-training.
- Suggests age-related strength loss may be partially reversible even after long sedentary periods, provided the myonuclear pool is preserved.
- Has implications for doping and detection — performance-enhancing effects on the myonuclear pool may persist long after measurable hormones clear.
Slide 4
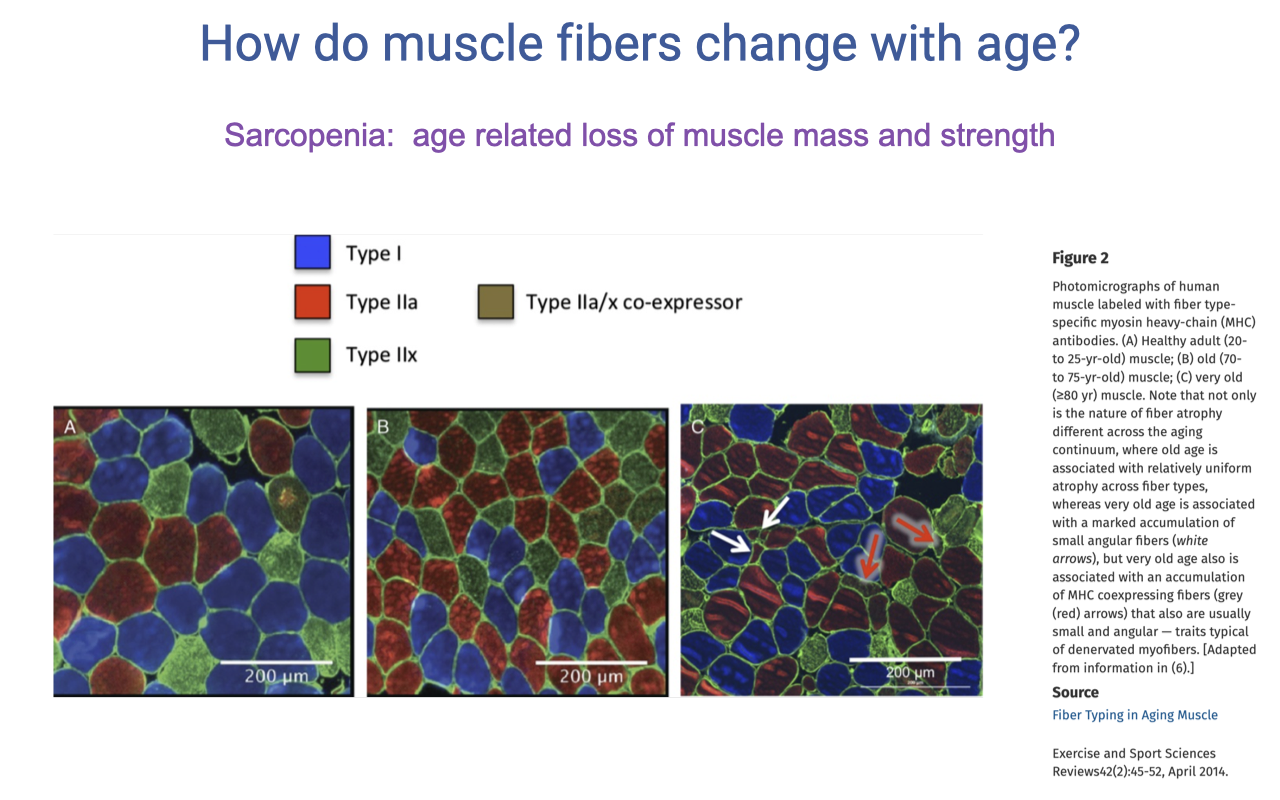
Sarcopenia and the Rise of Hybrid (Co-Expressing) Fibers With Age
- Sarcopenia = age-related loss of muscle mass and strength. Generally well-documented across studies, although confounded by activity level (older adults tend to be less active).
- For decades, the textbook story was that aging caused a shift from type II → type I fibers (fast → slow). Recent immunohistochemistry suggests this picture is incomplete:
- With age, there is a rise in fibers that co-express multiple myosin heavy-chain isoforms — most commonly type IIa/IIx co-expressors (hybrid fibers).
- These hybrid fibers are hard to categorize with older histochemical methods, which likely mis-classified many of them as pure type I or pure type IIa.
- A likely mechanism: muscle injury can cause partial denervation (motor neurons separate from fibers); on regeneration, the same motor unit may not re-innervate the same fibers, causing a shift in expressed isoforms.
- This means the literature on age-related fiber-type shifts must be interpreted carefully — newer work distinguishing pure vs. hybrid fibers paints a more nuanced picture than “type II loss.”
Slide 5
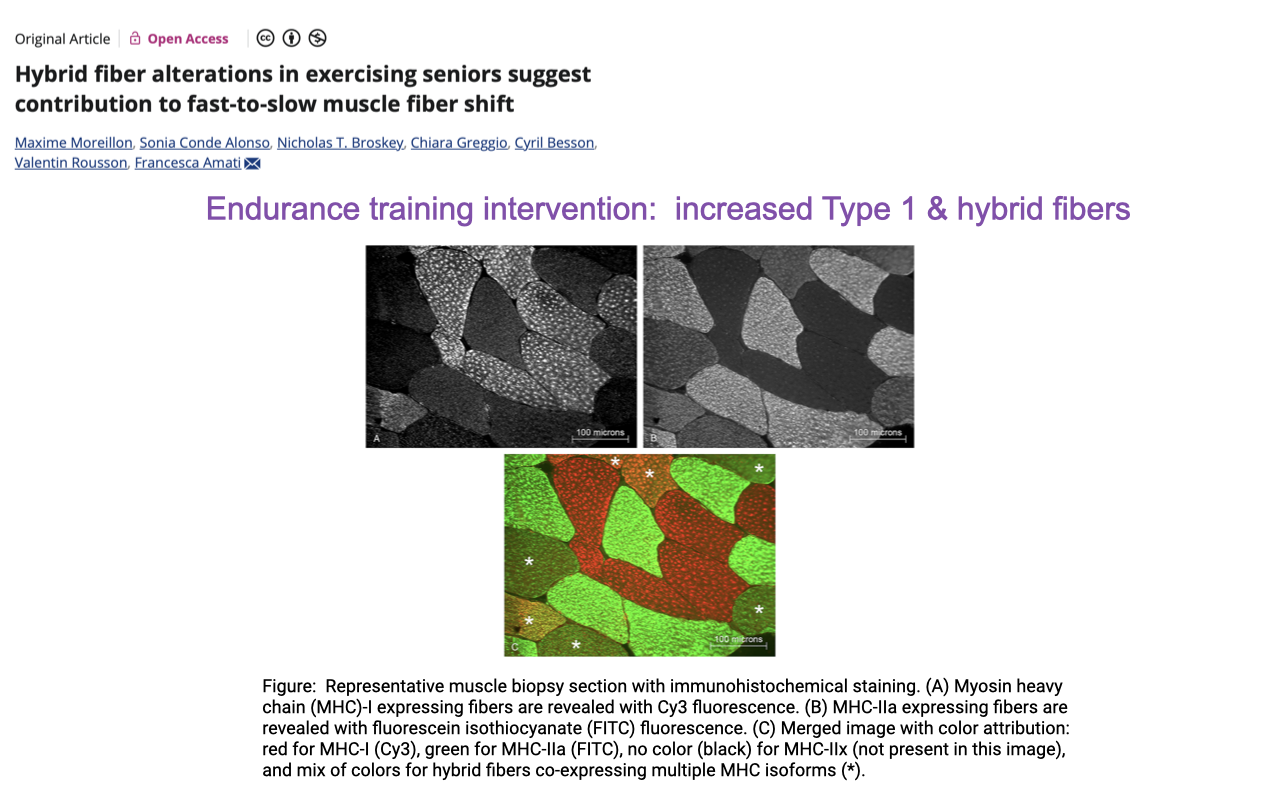
Endurance Training in Seniors → More Type I and Hybrid Fibers
- Quantifying fiber-type shifts in seniors requires high-resolution immunohistochemistry that can resolve co-expressing fibers, not just histochemical ATPase staining.
- Mounier et al. used MHC-I (red, Cy3), MHC-IIa (green, FITC), and MHC-IIx (unstained) co-staining to map every fiber as pure or hybrid.
- Endurance training intervention in older adults:
- Increased proportion of pure type I fibers (slow, oxidative).
- Increased proportion of hybrid (co-expressing) fibers — particularly type I + IIa co-expressors.
- Consistent with a fast-to-slow shift in the myosin profile, but with hybrids — not just pure fiber types — making up much of the change.
- Standard endurance training in seniors changes fiber composition, not just mitochondrial content within fibers, and these changes are detectable only with co-expression-aware staining.
Slide 6
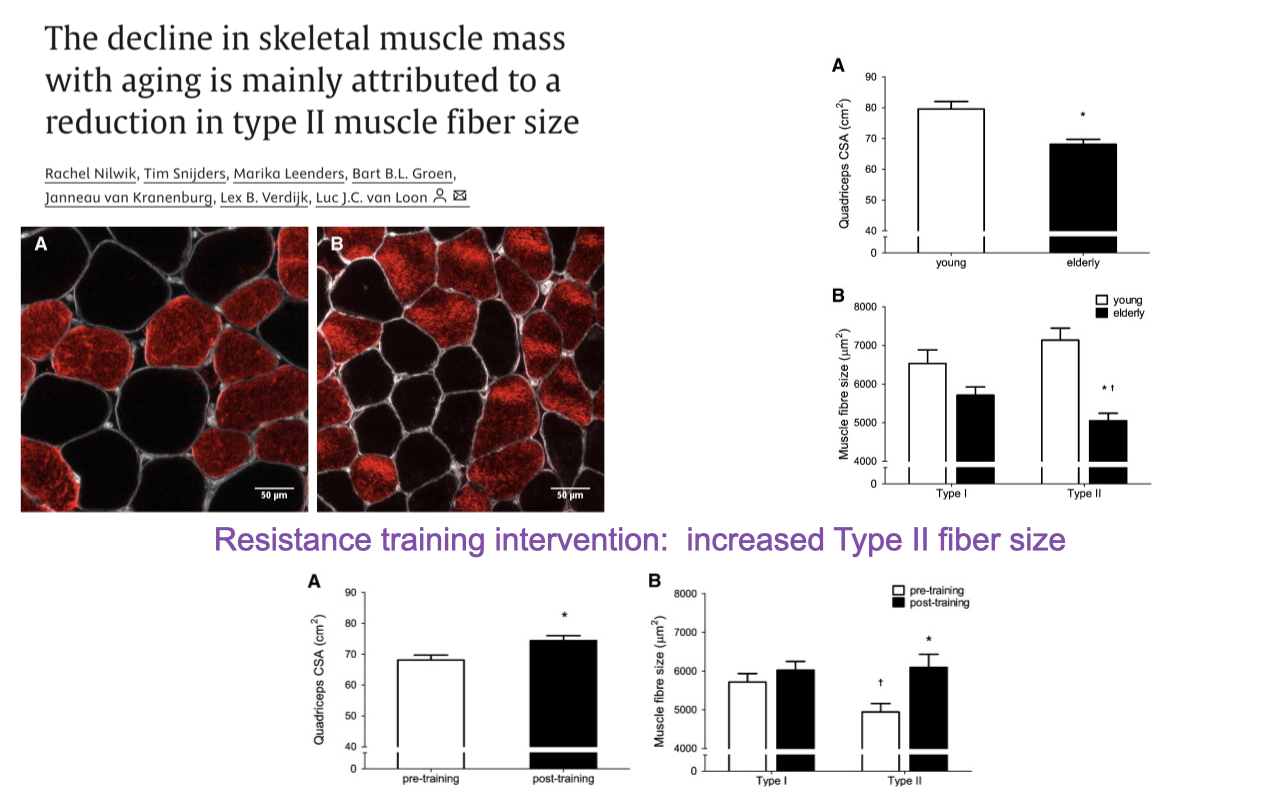
Sarcopenia Is Mainly Type II Atrophy — and Resistance Training Reverses It
- Nilwik et al. Nilwik T. Snijders et al.: in elderly humans, the loss of quadriceps CSA is primarily a reduction in type II fiber size, not a reduction in fiber number.
- Type I fiber CSA is largely preserved with age.
- Type II fiber CSA falls substantially — driving most of the whole-muscle CSA loss.
- Resistance training intervention in elderly subjects:
- Increased type II fiber size specifically.
- Recovers a substantial fraction of the lost mean fiber area, even after years of inactivity.
- The decline in muscle mass with age is not inevitable. It primarily reflects type II fiber atrophy, which is reversible with resistance training — even in older adults. Combined with the “muscle memory” mechanism (Slide 3), this suggests training adaptations remain accessible across the lifespan.
Slide 7
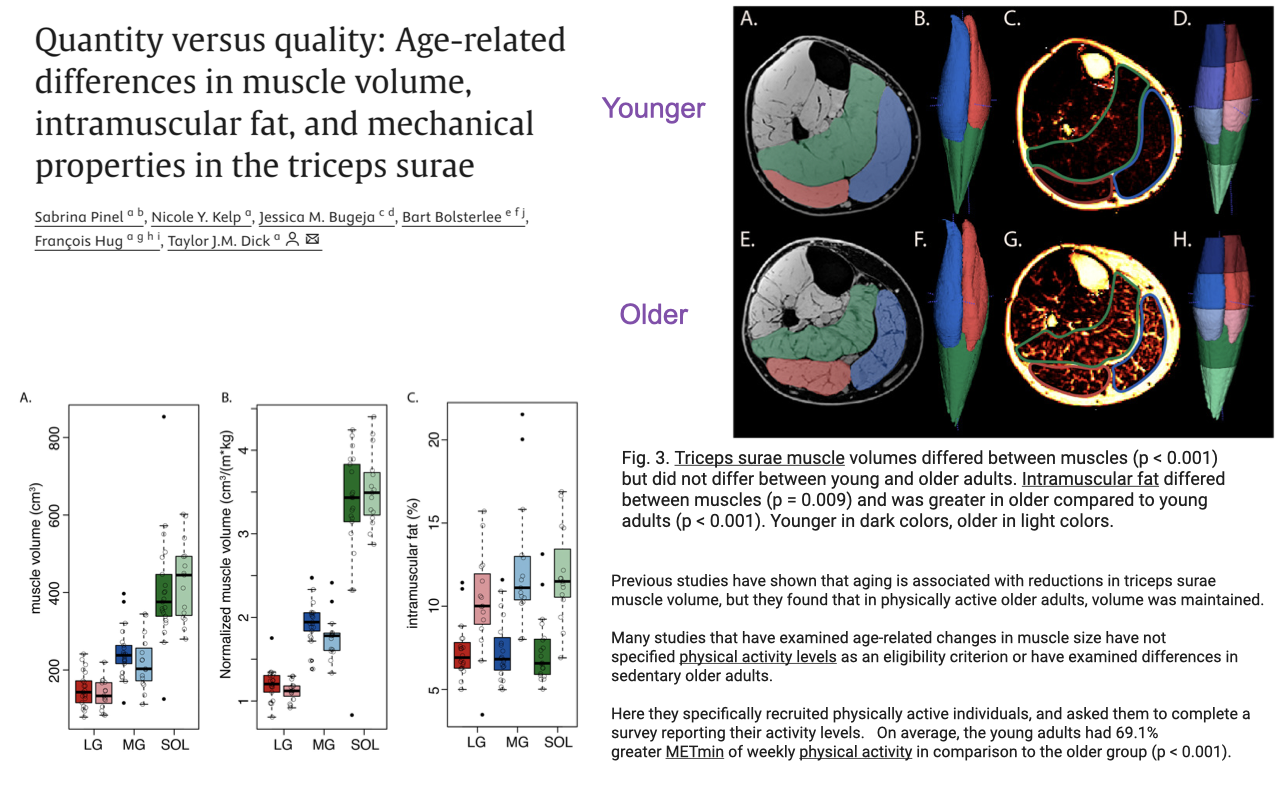
Quantity vs. Quality — Volume Is Preserved, but Fat Infiltration Rises With Age
- Studies of muscle aging usually report muscle quantity (volume), but muscle quality matters as much: a muscle full of intramuscular fat produces less force per unit volume.
- Pinel et al. examined the triceps surae (lateral gastrocnemius, medial gastrocnemius, soleus) in physically active younger and older adults using MRI:
- Muscle volume per body mass did not differ between young and active older adults — physical activity preserved muscle quantity.
- Intramuscular fat infiltration was significantly higher in the older group (p = 0.001).
- This means even physically active older adults experience a decline in muscle quality, despite preserving volume — and this fat infiltration reduces force per unit volume independent of CSA.
- Caveat raised by the authors: even though they specifically recruited physically active older adults, the young group still had 69% more weekly MET·hrs of physical activity. So the age effect remains partially confounded by activity level — a recurring problem in aging-muscle research.
- Studies that measure only muscle volume miss a major axis of age-related decline; intramuscular fat infiltration is part of the sarcopenia phenotype and partially independent of physical activity.
Slide 8
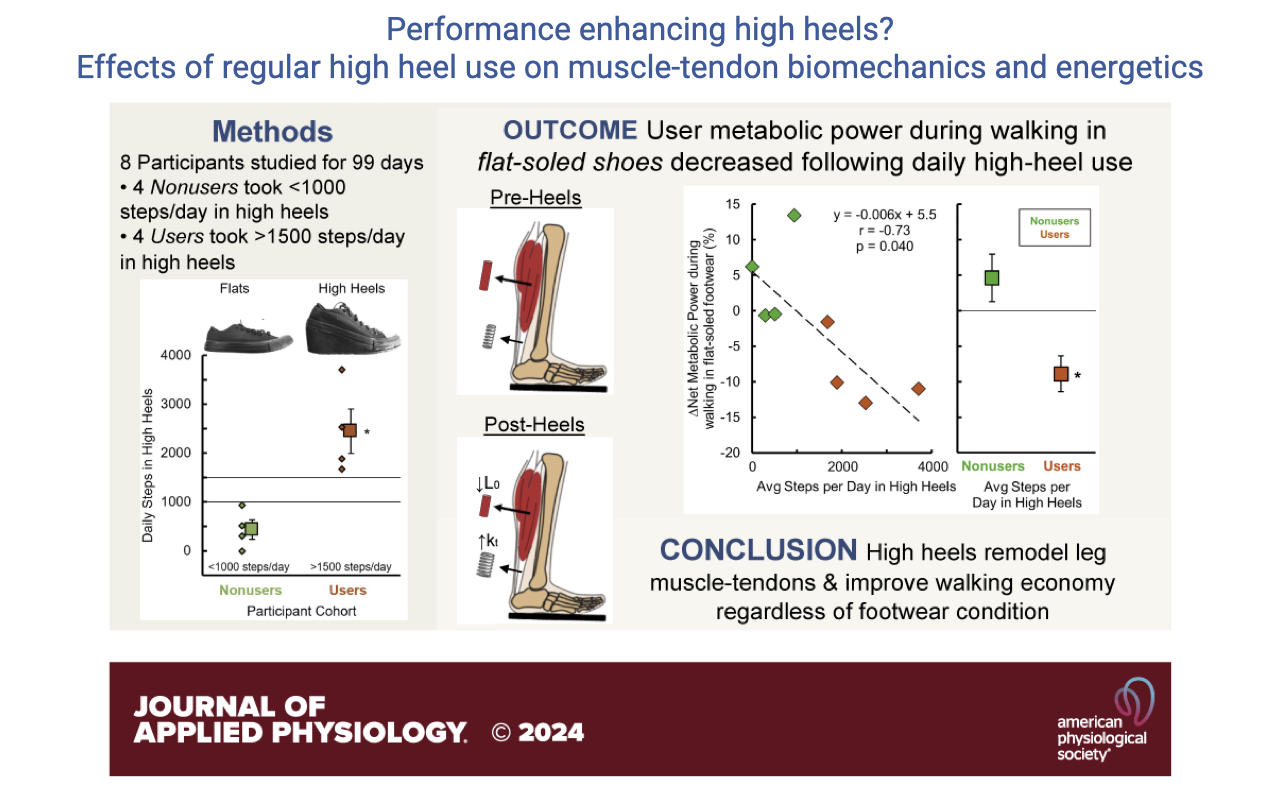
A Counterintuitive Result — Habitual High Heels Improve Walking Economy
- Designed experiment (Journal of Applied Physiology 2024): recruited naïve subjects (mostly men, who had never worn high heels) and gave them custom wedge-style high heels with stable bases, weight-matched to flat shoes. Subjects wore them daily for 99 days.
- Compliance issue: only 4 of 8 participants (the “Users”) actually averaged >1500 steps/day in the heels; the other 4 (“Avoiders”) never adopted them.
- Outcome: participants who did wear the heels regularly showed a significant reduction in net metabolic power during walking — in both flats and high heels — and the metabolic improvement scaled with daily heel use (r = 0.852, p = 0.007).
- The result is counterintuitive but reproducible — and the authors offer a mechanistic explanation on the next slide.
Slide 9
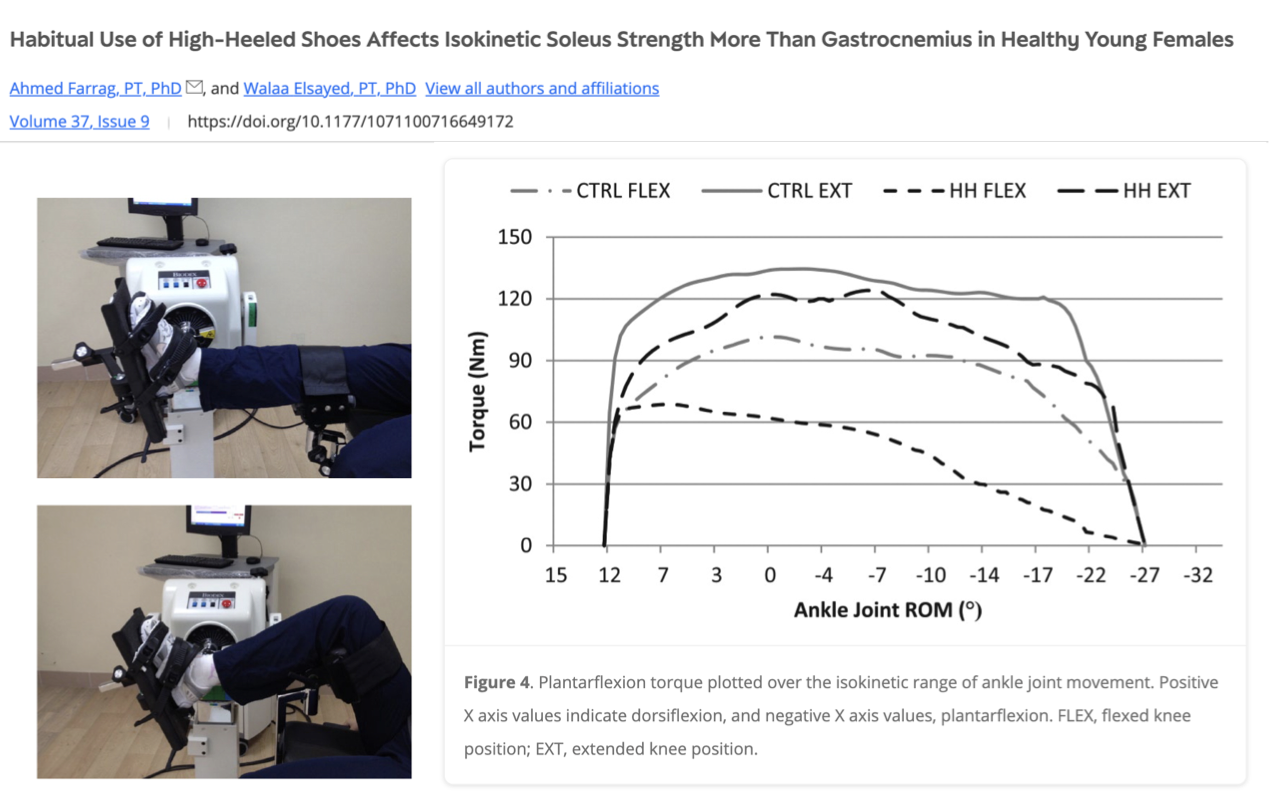
Mechanism — High Heels Remodel the Triceps Surae
- A second study (Farrag et al., Frontiers in Physiology) measured isokinetic plantarflexion torque across the full ankle range in habitual high-heel users vs. controls:
- High-heel users produced peak torque at a more plantarflexed ankle position than controls — i.e., their operating point on the F–L curve has shifted.
- The effect was larger in soleus than gastrocnemius — consistent with the soleus’s higher pennation and shorter fascicles (more sensitive to chronic length change).
- Mechanistic interpretation:
- Chronically wearing high heels keeps the ankle in plantarflexion, which reduces the operating range of the triceps surae during everyday walking.
- Over time, the muscle adapts by losing sarcomeres in series (reducing fiber length); the tendon becomes proportionally longer and stiffer.
- These adaptations shift the F–L curve so peak force occurs at a more plantarflexed ankle, and they also lower the volume of active muscle required for a given walking task — explaining the metabolic-economy improvement in Slide 8.
- Caveats: shorter muscles produce lower peak force, so this is a clear example of plasticity producing a trade-off: gain in walking economy, loss in absolute soleus strength. Not a recommendation to wear high heels — just a striking demonstration of muscle’s plasticity over weeks-to-months timescales.
Slide 10
Practice Activity — Build a Power-Velocity Curve
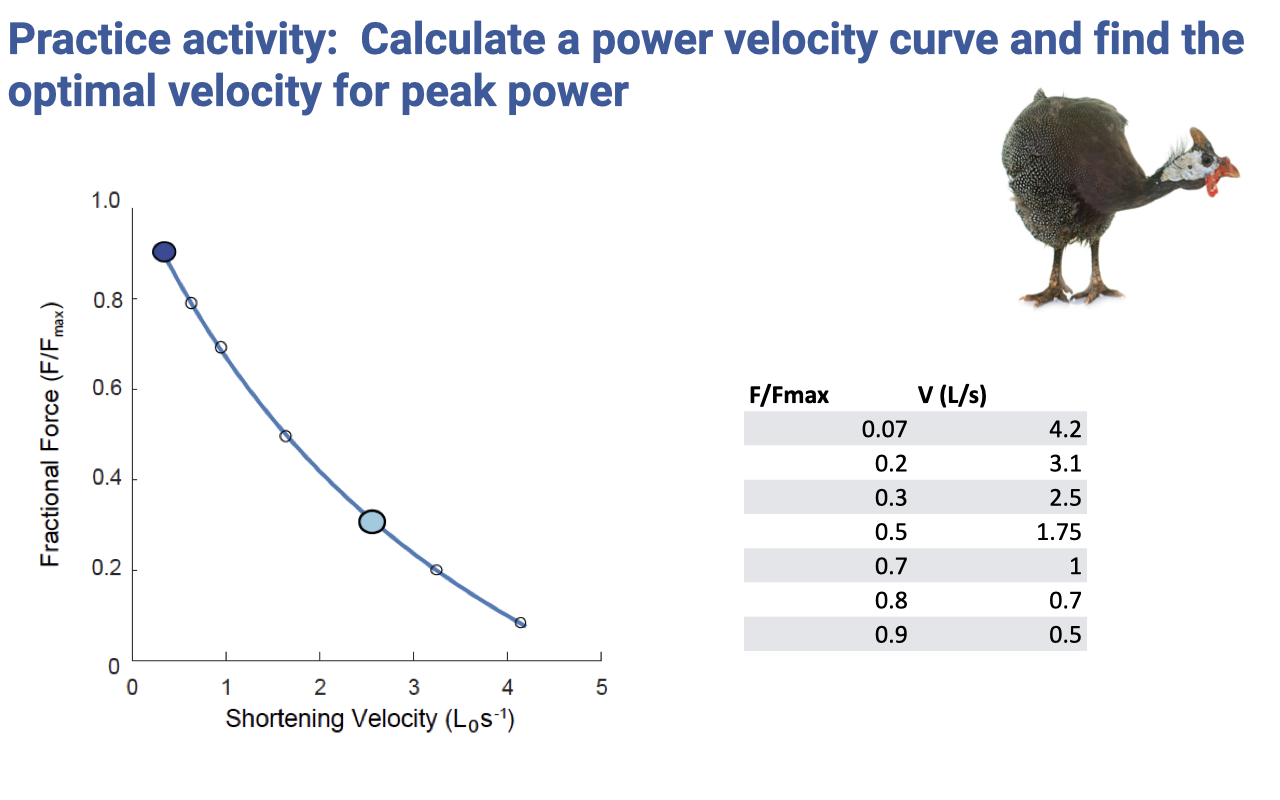
- Activity: from the tabulated F–V data (a real example from guinea fowl lateral gastrocnemius), compute Power = F × V at each row and find the velocity at which power is maximum.
- Provided table:
| F/Fmax | V (L/s) |
|---|---|
| 0.07 | 4.2 |
| 0.2 | 3.1 |
| 0.3 | 2.5 |
| 0.5 | 1.75 |
| 0.7 | 1.0 |
| 0.8 | 0.7 |
| 0.9 | 0.5 |
- Reasoning shortcut for the endpoints:
- At F/Fmax ≈ 0 (zero force), Power → 0 regardless of velocity.
- At V → 0 (zero velocity), Power → 0 regardless of force.
- The power curve must start at zero, rise to a single peak, and return toward zero — peak power must occur at an intermediate F and V.
Slide 11
Practice Activity — Solution and Interpretation
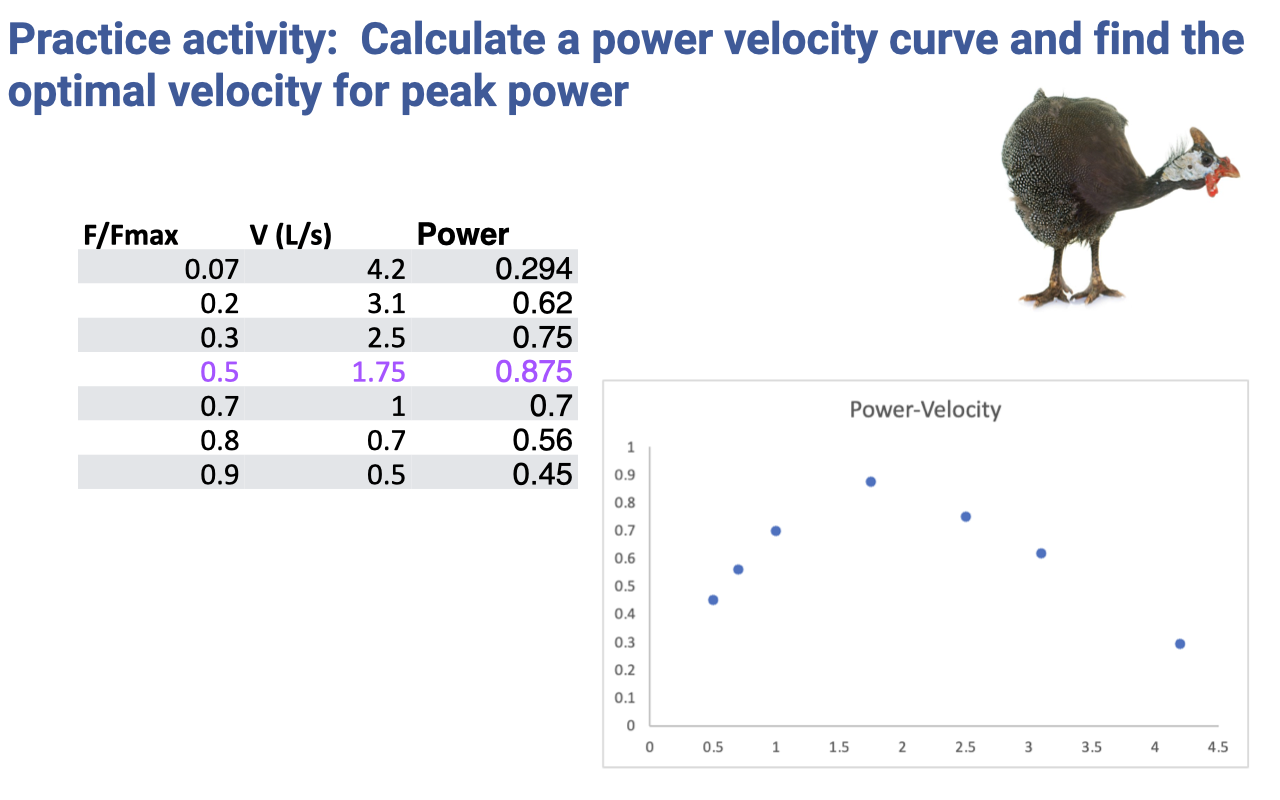
- Compute Power = F × V at each tabulated point:
| F/Fmax | V (L/s) | Power |
|---|---|---|
| 0.07 | 4.2 | 0.294 |
| 0.2 | 3.1 | 0.62 |
| 0.3 | 2.5 | 0.75 |
| 0.5 | 1.75 | 0.875 ← peak |
| 0.7 | 1.0 | 0.70 |
| 0.8 | 0.7 | 0.56 |
| 0.9 | 0.5 | 0.45 |
- Peak power occurs at F/Fmax ≈ 0.5 and V ≈ 1.75 L/s — i.e., at intermediate force and velocity.
- For this guinea fowl muscle (Vmax ≈ 4.2 L/s based on the lowest-force point), peak power is at V/Vmax ≈ 0.4 — slightly faster than the textbook ~0.2–0.3 Vmax rule, illustrating that the precise optimal velocity varies by fiber type and species.
- Practical consequences:
- To maximize muscle power, contract at intermediate velocity, not maximum velocity.
- Bicycles need gears so the cyclist can keep their muscles near peak power at any road speed.
- Sport-specific training should target the velocity at which peak power matters for that sport — sprint cyclists train near their muscles’ peak-power velocity, while endurance athletes train closer to their peak-efficiency velocity.
Slide 12

Practice Activity — Inferring Muscle Function From a Volume-Fraction Pie Chart
- Apply the zero-sum game framework from Lecture 11 to a new muscle specimen with the following volume fractions:
- Myofibrils ~70% → moderate-to-high force capacity per unit volume.
- Mitochondria ~5% → low aerobic ATP supply → muscle is primarily anaerobic and prone to rapid fatigue.
- Sarcoplasmic reticulum ~25% → very high SR fraction → very rapid Ca2+ release/reuptake → very fast activation and relaxation.
- Likely functional characteristics:
- Fast twitch kinetics (high SR → quick activation/relaxation cycles).
- Moderately high specific tension (myofibril fraction is high enough to support significant force).
- Low fatigue resistance (very low mitochondrial content → relies on anaerobic glycolysis).
- Possibly a superfast specialist — the high SR fraction is reminiscent of toadfish swim bladder or rattlesnake tail-shaker muscle, which trade myofibril volume for SR to support extremely high contraction frequencies.
- A single pie chart of cellular composition predicts fiber type, force capacity, fatigue resistance, and contraction speed — a clean illustration that the zero-sum game is not just a metaphor but a quantitative tool for inferring function from cellular structure.
Key Equations
| Equation | Name | Description |
|---|---|---|
| $\text{Power} = F \times V$ | Mechanical power | Computed point-by-point from the F–V curve to construct the power–velocity curve. Peak power occurs at intermediate F and V. |
| Volume fractions: $V_{myofibril} + V_{SR} + V_{Mt} \approx 1$ | Zero-sum game (cellular) | The sum of myofibrillar, SR, and mitochondrial volume fractions is constrained to ~100% within a fixed muscle-cell volume; high specialization in one component comes at the expense of the others. Hypertrophy can break the strict version by increasing absolute amounts. |
Glossary of Key Terms
| Term | Definition |
|---|---|
| Satellite cell | Muscle stem cell lying just beneath the sarcolemma. Activated by training, injury, or growth signals; proliferates and fuses with existing fibers, donating new myonuclei to support hypertrophy. |
| Myonucleus | A nucleus within a multinucleated muscle fiber. Each myonucleus regulates a fixed “domain” of cytoplasm, so hypertrophy beyond a threshold requires recruiting additional myonuclei via satellite-cell fusion. |
| Muscle memory (cellular) | The phenomenon whereby previously trained muscle re-grows faster than it grew the first time, attributed to retention of myonuclei acquired during prior training even after the cytoplasm shrinks during detraining. |
| Hypertrophy | Increase in muscle cell volume in response to training; in trained-naïve fibers requires satellite-cell fusion to expand the myonuclear pool. |
| Atrophy | Decrease in muscle cell volume in response to detraining, immobilization, or denervation. In the new model, myonuclei are retained even as the cytoplasm shrinks. |
| Sarcopenia | Age-related loss of muscle mass and strength; primarily reflects type II fiber atrophy with preserved type I fiber size, partially confounded with declining physical activity. |
| Hybrid (co-expressing) fiber | A muscle fiber that simultaneously expresses more than one myosin heavy-chain isoform (most commonly type IIa/IIx). Becomes more prevalent with age and may have been mis-classified as pure type I or IIa by older histochemical methods. |
| Myosin heavy chain (MHC) isoforms | The myosin protein variants that define fiber type in skeletal muscle (MHC-I, MHC-IIa, MHC-IIx). Modern immunohistochemistry can resolve co-expression. |
| Endurance training | Low-to-moderate intensity, high-repetition training; in seniors, increases proportions of type I and hybrid fibers and mitochondrial volume density across all fiber types. |
| Resistance training | High-intensity, low-rep training; in seniors, increases type II fiber size specifically, partially reversing sarcopenia. |
| Muscle quantity | Muscle volume (or cross-sectional area); preserved in physically active older adults. |
| Muscle quality | Force-producing capacity per unit muscle volume; reflects the proportion of cross-sectional area that is contractile tissue vs. intramuscular fat. Declines with age even when volume is preserved. |
| Intramuscular fat infiltration | Adipose tissue accumulation within the muscle belly (not subcutaneous fat); increases with age and reduces force per unit muscle volume. |
| Triceps surae | The compound muscle group of the calf — lateral gastrocnemius (LG), medial gastrocnemius (MG), and soleus (SOL); insertion via the Achilles tendon. |
| Isokinetic dynamometer | Laboratory device that holds a joint at constant angular velocity while measuring torque across the joint’s range of motion; used to quantify F–V characteristics in living humans. |
| Power–velocity curve | Power = F × V plotted across the F–V curve; rises from zero, peaks at an intermediate velocity, returns to zero at Vmax. The peak velocity varies by fiber type and species. |
| Zero-sum game (volume fractions) | The principle that a fixed muscle-cell volume must be partitioned among myofibrils, SR, and mitochondria, so increases in one come at the expense of the others (Rome and Lindstedt 1998). Quantitatively predicts force capacity, contraction speed, and fatigue resistance from a cellular composition pie chart. |
| Superfast muscle | A specialized muscle (e.g., toadfish swim bladder, rattlesnake tail-shaker) with very high SR volume fraction (~30%) supporting contraction frequencies >100 Hz; trades myofibril volume (and thus force) for SR. |