Lecture 21: Exercise as Medicine
Slide 1

- This lecture provides a broad overview of the evidence for exercise as a preventive and therapeutic intervention, connecting the physiological principles covered throughout the course to clinical and public health applications.
Slide 2
Learning Objectives
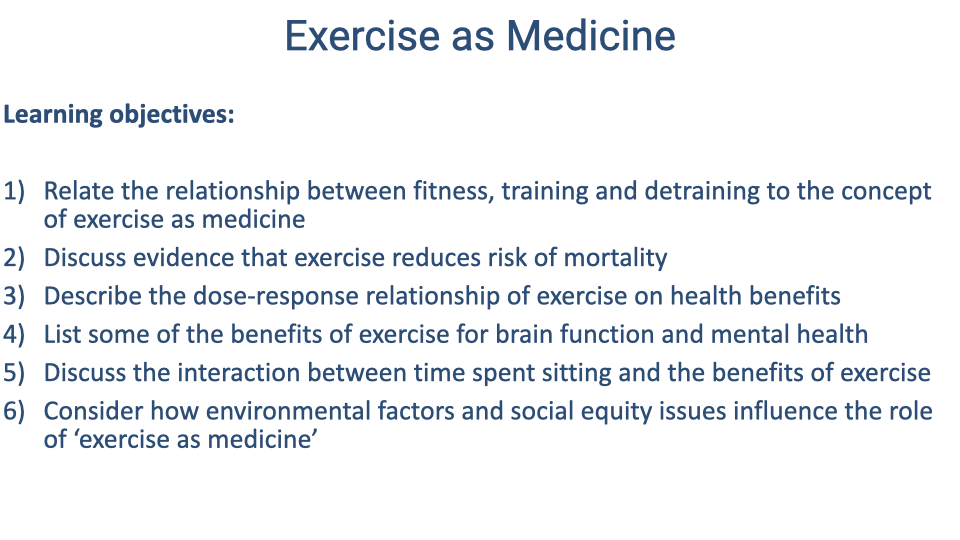
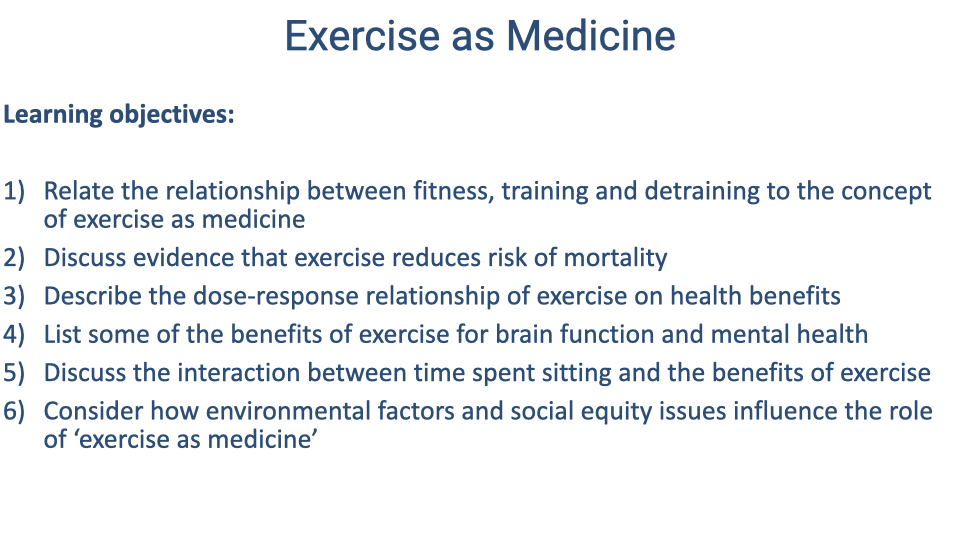
- Learning objectives span the relationship between fitness and health, evidence for mortality reduction, dose-response effects, brain and mental health benefits, the independent risks of sedentary behavior, and the environmental and social equity factors that influence access to physical activity.
Slide 3
Components of Physical Fitness
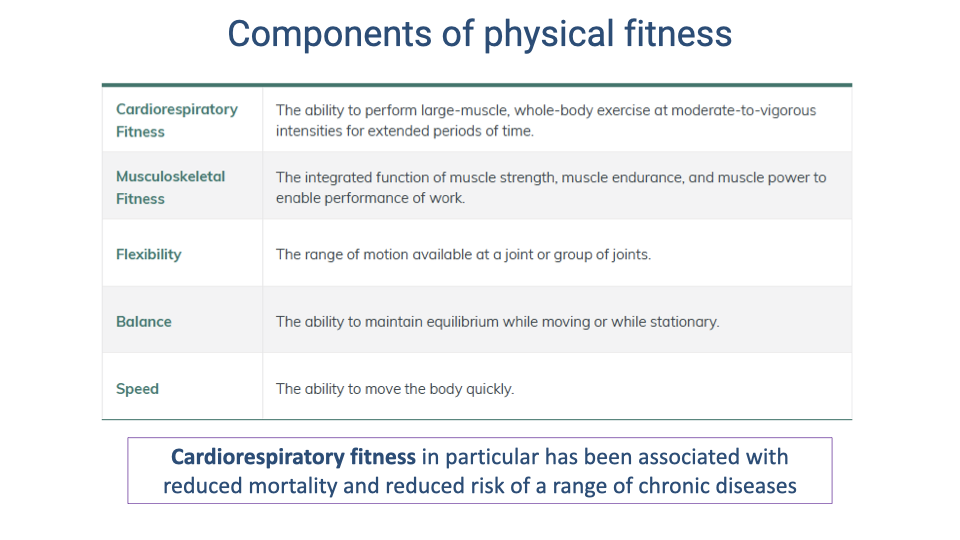
- Physical fitness encompasses multiple components: cardiorespiratory fitness, musculoskeletal fitness, flexibility, balance, and speed.
- Cardiorespiratory fitness — the ability to sustain large-muscle, whole-body exercise at moderate-to-vigorous intensities — has been most strongly associated with reduced mortality and lower risk of chronic diseases.
- Preferred walking speed has been proposed as a functional vital sign: declines in walking speed with aging can predict future fall risk and declining health.
Slide 4
Decline of Physiological Function with Age
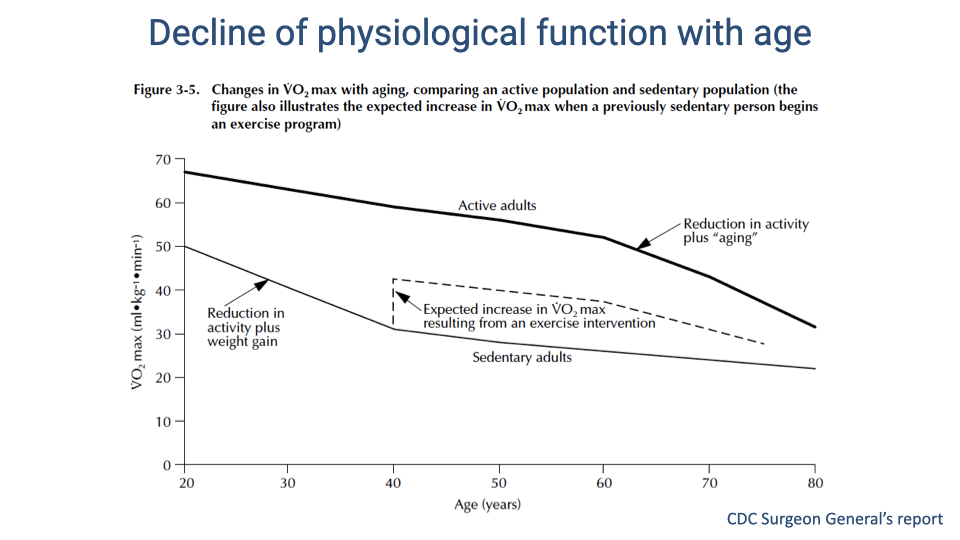
- VO2 max declines with age in all adults, but the rate of decline differs substantially between active and sedentary populations.
- Active adults maintain a relatively constant rate of decline until approximately age 60, when the slope steepens. Sedentary adults show a steeper decline throughout adulthood, compounded by reduced activity and weight gain.
- A sedentary adult who begins an exercise program can achieve a meaningful immediate increase in VO2 max, shifting closer to the active-adult trajectory.
- Maintaining physical activity extends the “health span” — the age range over which an individual can sustain independent, healthy mobility.
Slide 5
Cardiorespiratory Fitness and Mortality: Study Design
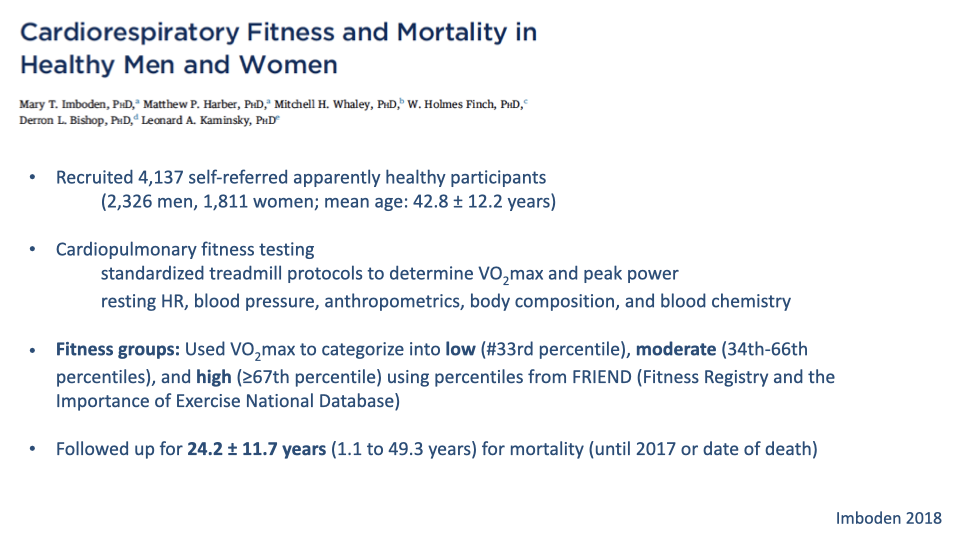
- This landmark study followed over 4,000 healthy adults for an average of 24 years, categorized by cardiorespiratory fitness level (low, moderate, or high) based on VO2 max percentiles.
- Standardized cardiopulmonary exercise testing, anthropometric measurements, and blood chemistry were collected at baseline.
- The long follow-up period and large sample size provide strong statistical power for evaluating the relationship between fitness and mortality.
Slide 6
Cardiorespiratory Fitness and Mortality: Results
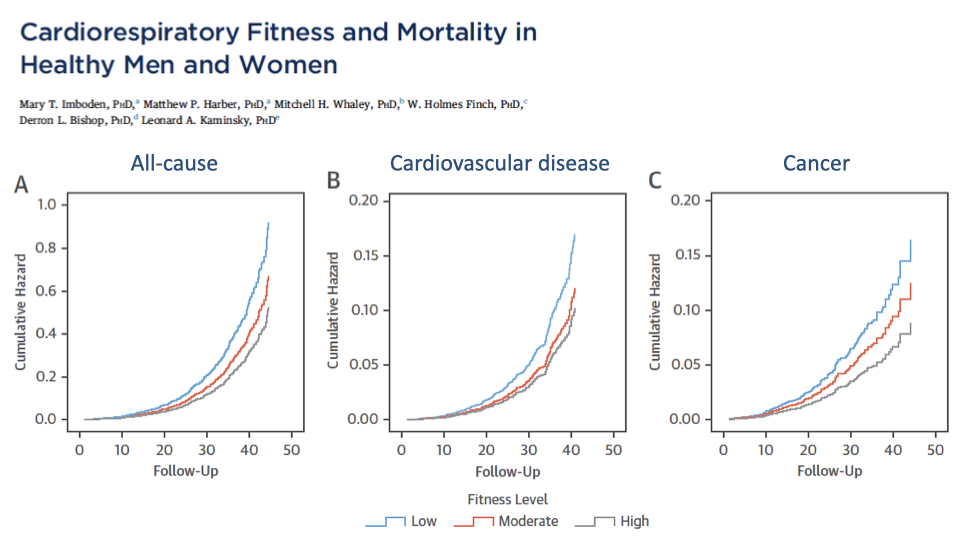
- Across all three mortality categories — all-cause, cardiovascular disease, and cancer — the low-fitness group had the highest cumulative mortality, while the high-fitness group had the lowest.
- The separation between fitness groups widens over time, indicating that the protective effect of fitness is cumulative and long-lasting.
- The association with cancer mortality is notable because exercise is not traditionally considered a cancer treatment, yet the data show a clear dose-response relationship.
Slide 7
Endurance Exercise Protects Against Cardiac Injury
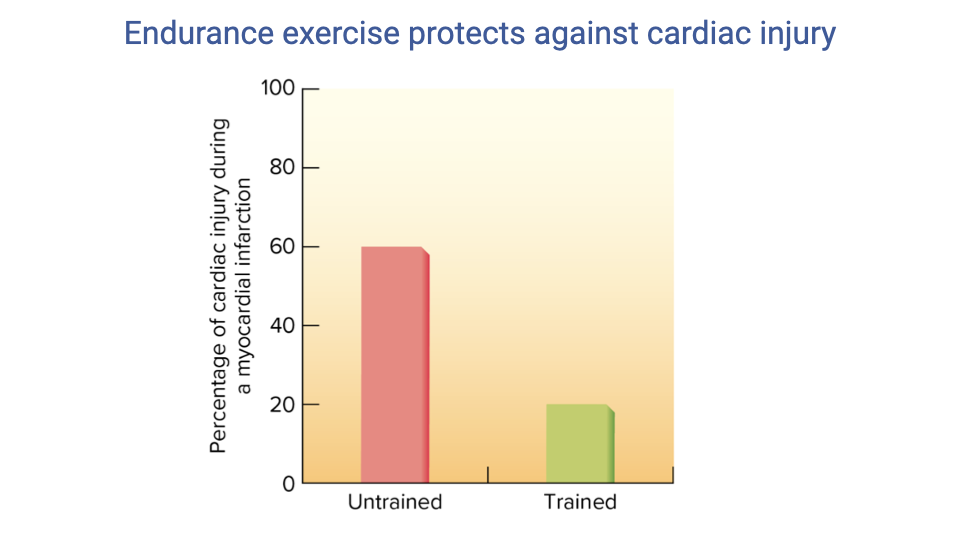
- Endurance-trained individuals experience approximately one-third the cardiac tissue injury during a myocardial infarction compared to untrained individuals (approximately 20% vs. 60%).
- Regular endurance exercise provides cardioprotection through multiple mechanisms, including improved coronary collateral circulation, enhanced antioxidant defenses, and increased cardiac mitochondrial function.
Slide 8
Mortality Risk Declines with Fitness Level
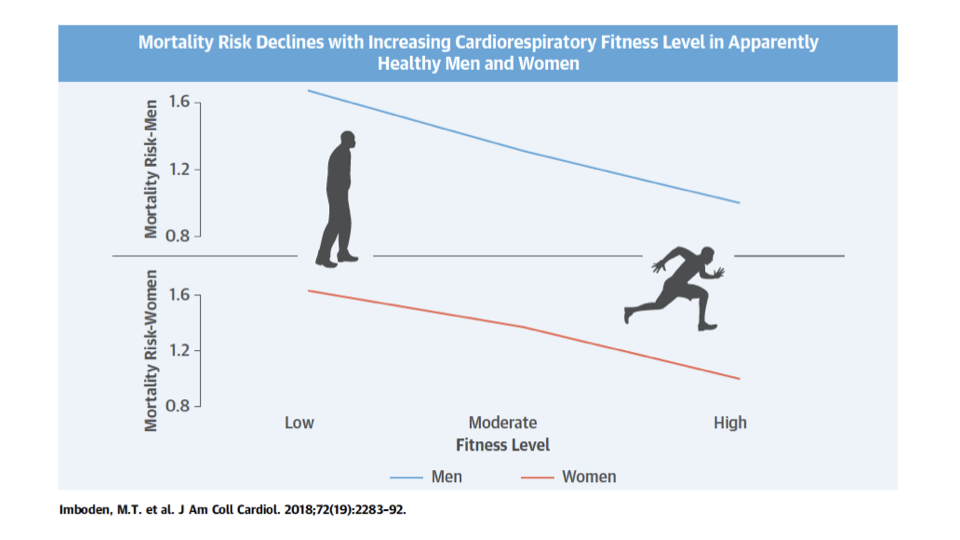
- Mortality risk declines progressively from low to moderate to high fitness in both men and women.
- The trend is consistent across sexes: increasing cardiorespiratory fitness from low to high reduces mortality risk by approximately 40–50%.
Slide 9
Dose-Response Relationship: Physical Activity and Mortality
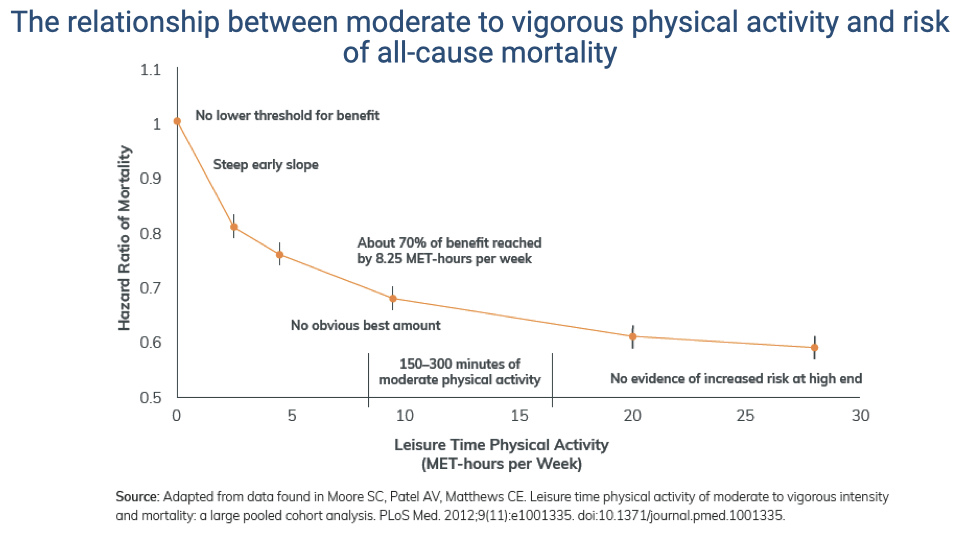
- The dose-response curve shows several key features:
- There is no lower threshold — any amount of physical activity reduces mortality risk relative to a sedentary baseline.
- The curve is steepest at low activity levels, meaning the greatest marginal benefit comes from transitioning from sedentary to even modest activity.
- Approximately 70% of the maximum mortality reduction is achieved by 8.25 MET-hours per week.
- The curve continues to decline at higher activity levels, with no evidence of a U-shaped increase in risk at very high levels.
- The CDC-recommended range of 150–300 minutes of moderate physical activity per week falls in the zone of greatest benefit-to-effort ratio.
Slide 10
Health Benefits of Physical Activity: Comprehensive Summary
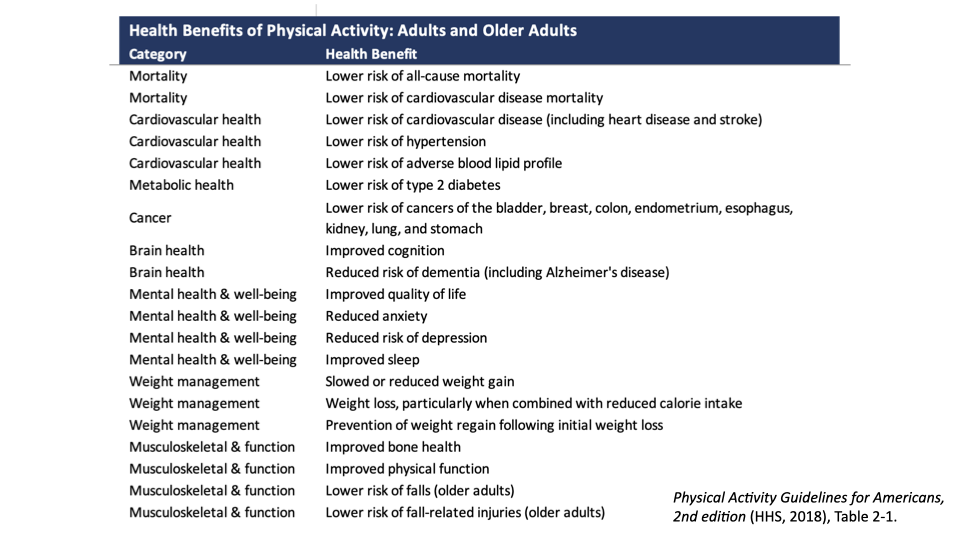
- Physical activity provides benefits across virtually every organ system and health category:
- Lower risk of all-cause and cardiovascular mortality
- Reduced risk of cardiovascular disease, hypertension, and adverse blood lipid profile
- Lower risk of type 2 diabetes
- Reduced risk of at least eight types of cancer
- Improved cognition and reduced risk of dementia
- Reduced depression, anxiety, and improved sleep
- Weight management and prevention of weight regain
- Improved bone health, physical function, and reduced fall risk in older adults
Slide 11
Benefits of Physical Activity for Cancer Survivors
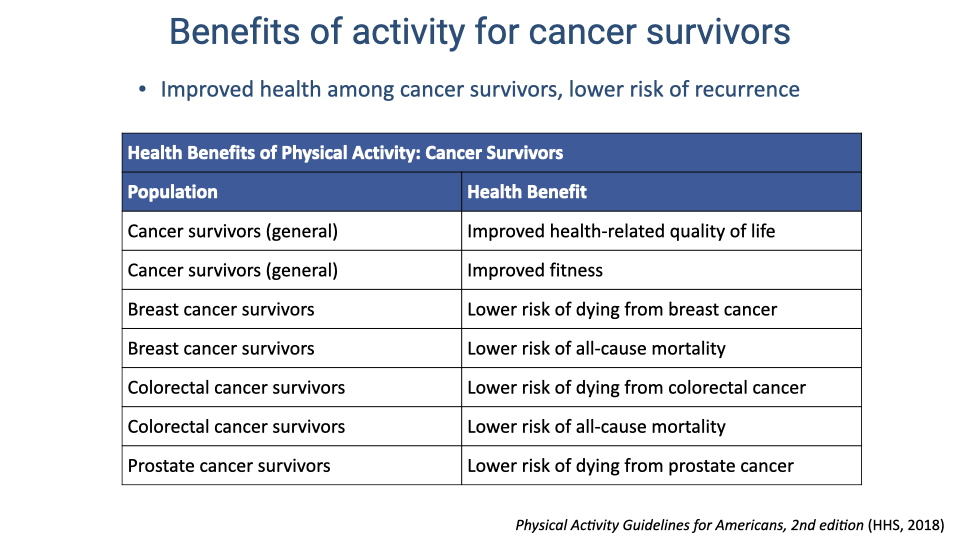
- Physical activity benefits cancer survivors both during and after treatment: improved quality of life, improved fitness, and lower risk of cancer recurrence.
- For breast, colorectal, and prostate cancer survivors, physical activity is associated with reduced cancer-specific and all-cause mortality.
- Despite this evidence, exercise is rarely prescribed as part of oncology treatment plans — an area where clinical practice could better incorporate the evidence.
Slide 12
Physical Activity and Cancer Risk Reduction
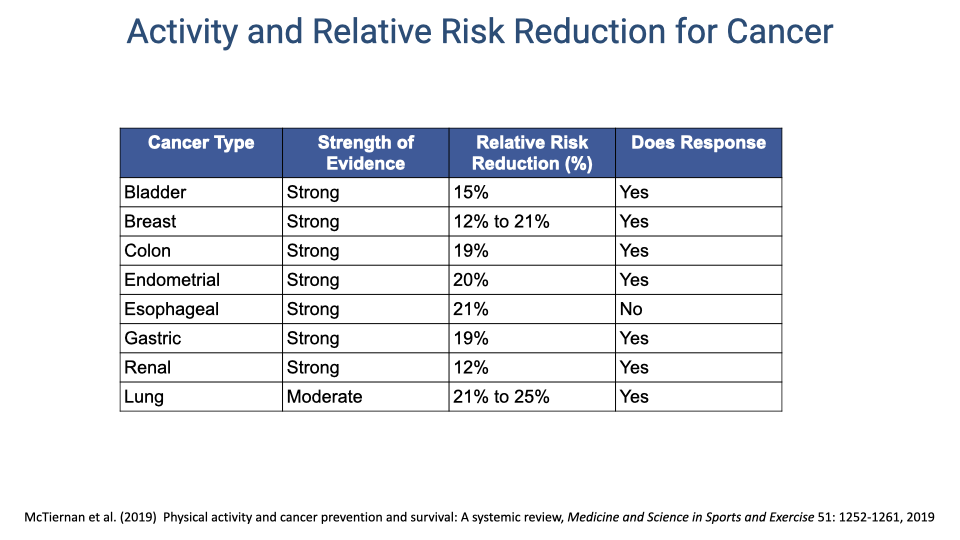
- A systematic review found strong evidence for a 12–21% reduction in cancer risk associated with physical activity across eight cancer types.
- The evidence is strongest for colon, endometrial, esophageal, and gastric cancers (19–21% risk reduction).
- For most cancer types, there is a dose-response relationship — more physical activity provides greater risk reduction.
Slide 13
Benefits for People with Chronic Conditions and Disabilities
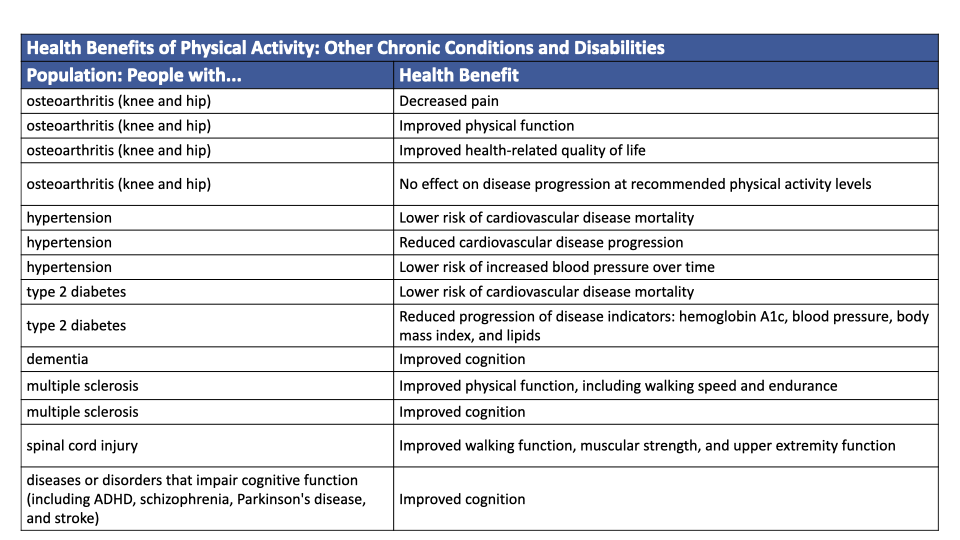
- Physical activity provides measurable benefits for people with a wide range of chronic conditions and disabilities, including osteoarthritis, hypertension, type 2 diabetes, dementia, multiple sclerosis, spinal cord injury, and cognitive impairment disorders.
- Benefits span reduced pain, improved physical function, decreased cardiovascular disease progression, and improved cognition.
- Importantly, physical activity at recommended levels does not worsen disease progression in osteoarthritis — a common concern that discourages patients from exercising.
Slide 14
Benefits for Brain and Mental Health
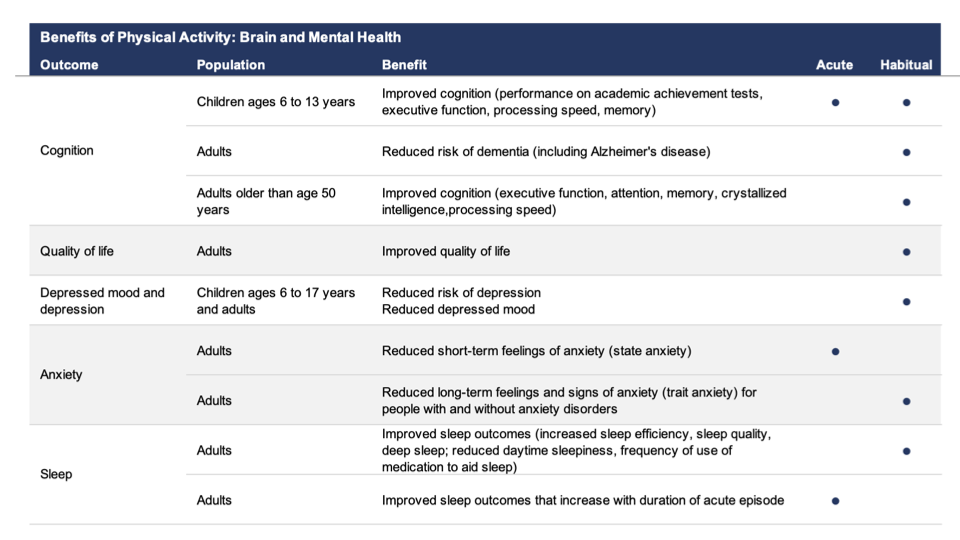
- Exercise benefits brain function and mental health through both acute (single-bout) and habitual (regular) mechanisms:
- Cognition — a single bout of exercise immediately improves executive function and attention; habitual exercise reduces dementia risk and improves memory.
- Depression — habitual exercise reduces risk and severity of depression across age groups.
- Anxiety — acute exercise reduces short-term (state) anxiety; habitual exercise reduces long-term (trait) anxiety even in people with anxiety disorders.
- Sleep — exercise improves sleep quality, efficiency, and deep sleep duration, with benefits increasing with exercise bout duration.
Slide 15
Exercise and Brain Health: Aerobic Dance Study
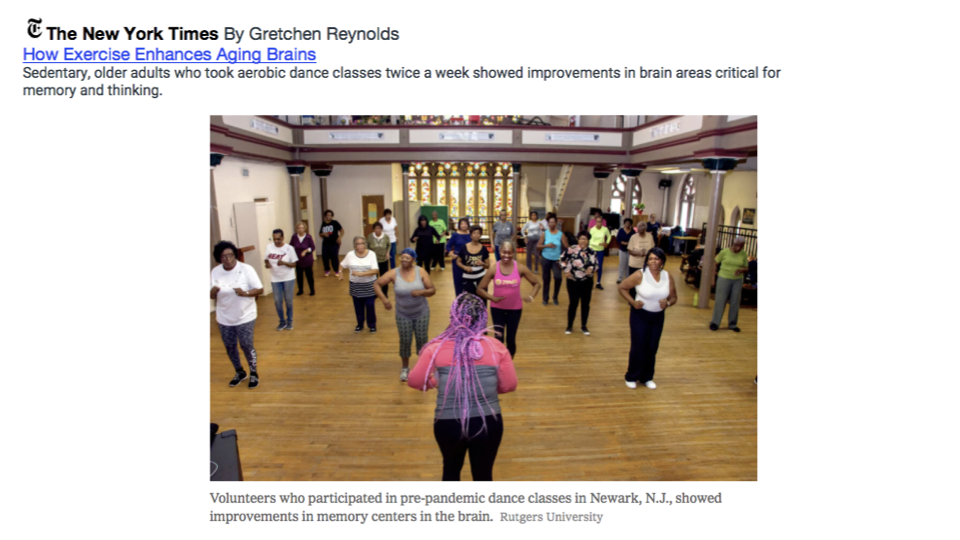
- A study of sedentary older adults who participated in an aerobic dance class twice per week for 20 weeks showed measurable improvements in brain function.
- This type of social, aerobic activity provides both the physiological benefits of exercise and the cognitive stimulation of learning new movement patterns.
Slide 16
Exercise Increases Brain Network Flexibility
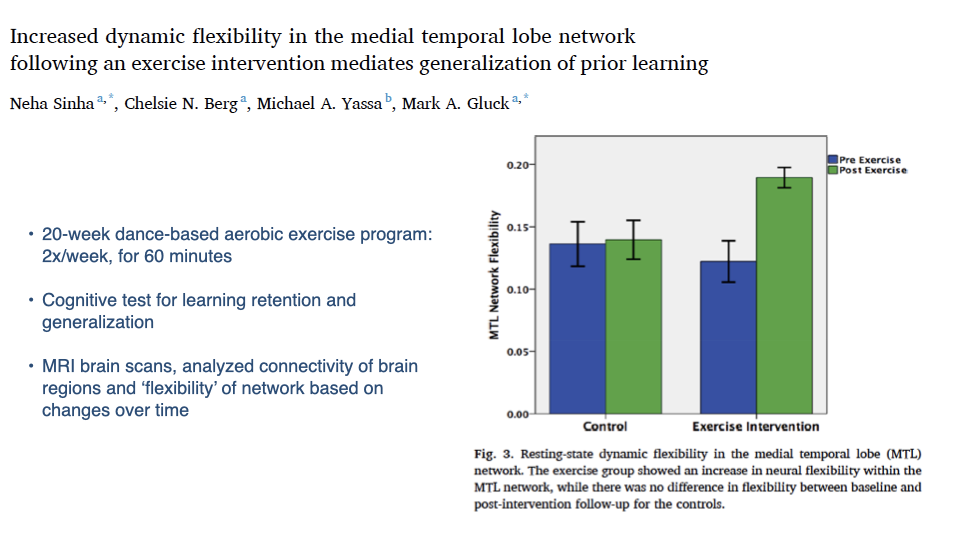
- After the 20-week dance-based aerobic exercise program, participants showed increased dynamic flexibility in the medial temporal lobe (MTL) network — a brain region critical for memory and learning.
- The control group showed no change in network flexibility over the same period.
- Increased network flexibility is associated with better cognitive function, particularly the ability to generalize learning to new contexts.
- These findings suggest that even a relatively modest exercise intervention (two sessions per week for 20 weeks) can produce structural changes in brain connectivity.
Slide 17
Positive Effects of Acute Exercise: Study Standards
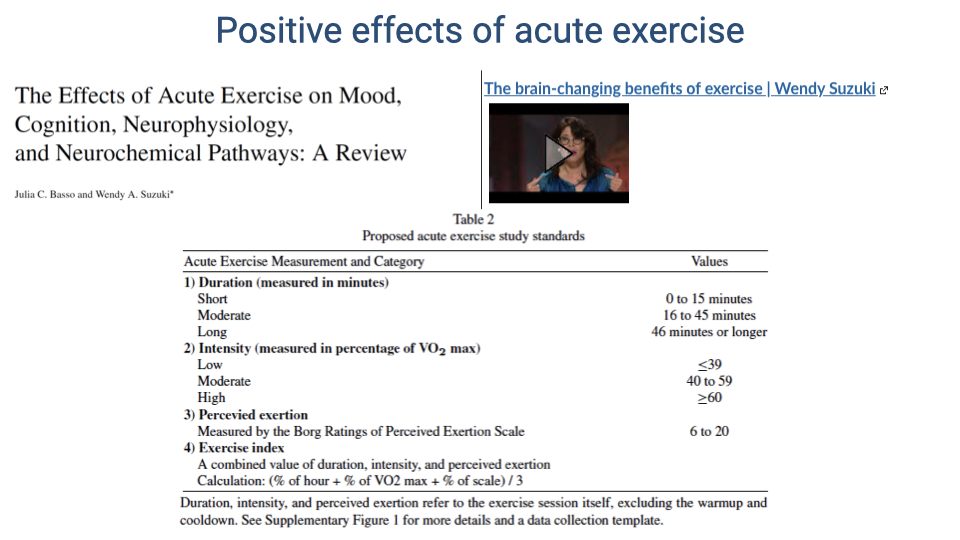
- Basso and Suzuki proposed standardized categories for studying acute exercise effects: duration (short, moderate, long), intensity (low, moderate, high as a percentage of VO2 max), perceived exertion (Borg scale), and a combined exercise index.
- These standards help compare findings across different exercise studies, which often use inconsistent methodologies.
Slide 18
Summary of Acute Exercise Effects on the Brain
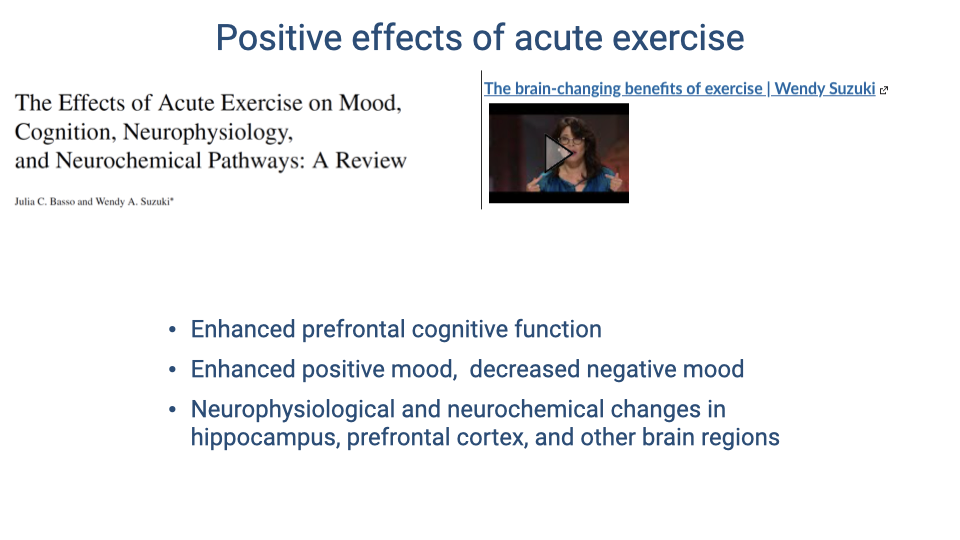
- Across many studies, acute exercise consistently enhances prefrontal cognitive function (executive function, attention, working memory).
- Exercise enhances positive mood states and decreases negative mood states.
- These effects are associated with neurophysiological and neurochemical changes in the hippocampus, prefrontal cortex, and other brain regions — including increased neurotrophins (such as BDNF), dopamine, serotonin, and norepinephrine.
Slide 19
Self-Reflection: Do You Get Enough Exercise?
- A pause for personal reflection on whether current physical activity levels meet the evidence-based recommendations for health benefits.
Slide 20
CDC Activity Guidelines for Adults
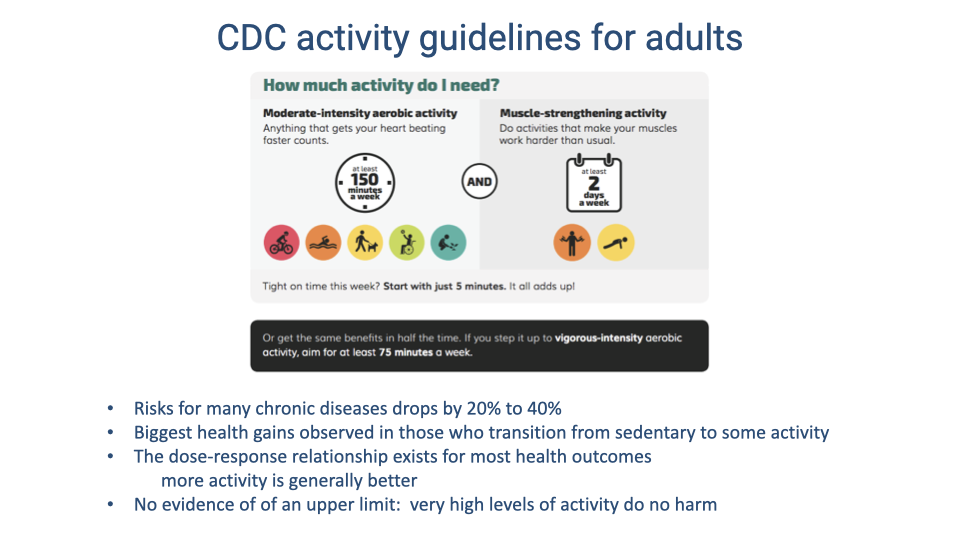
- The CDC recommends at least 150 minutes per week of moderate-intensity aerobic activity (or 75 minutes of vigorous-intensity activity) plus muscle-strengthening activity at least 2 days per week.
- Meeting these guidelines reduces risks for many chronic diseases by 20–40%.
- The biggest health gains come from transitioning from a sedentary lifestyle to any level of regular activity.
- There is no evidence of an upper limit where physical activity becomes harmful — very high activity levels do no harm.
Slide 21
Percentage of U.S. Adults Meeting the Guidelines
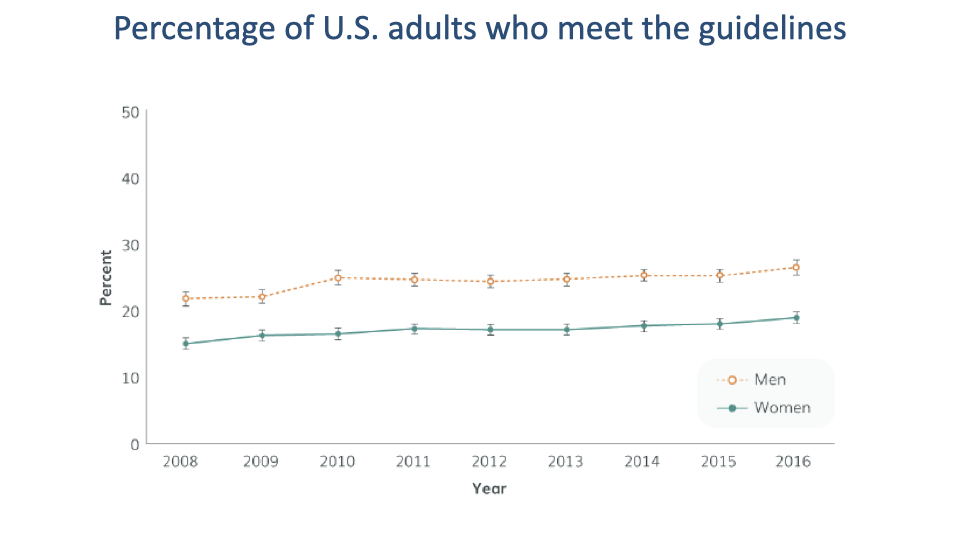
- Despite the well-documented benefits, only approximately 15–20% of women and 20–27% of men in the United States meet both aerobic and muscle-strengthening guidelines.
- Although the percentage has trended upward slightly from 2008 to 2016, the vast majority of the population remains insufficiently active.
Slide 22
Risks of Sedentary Behavior
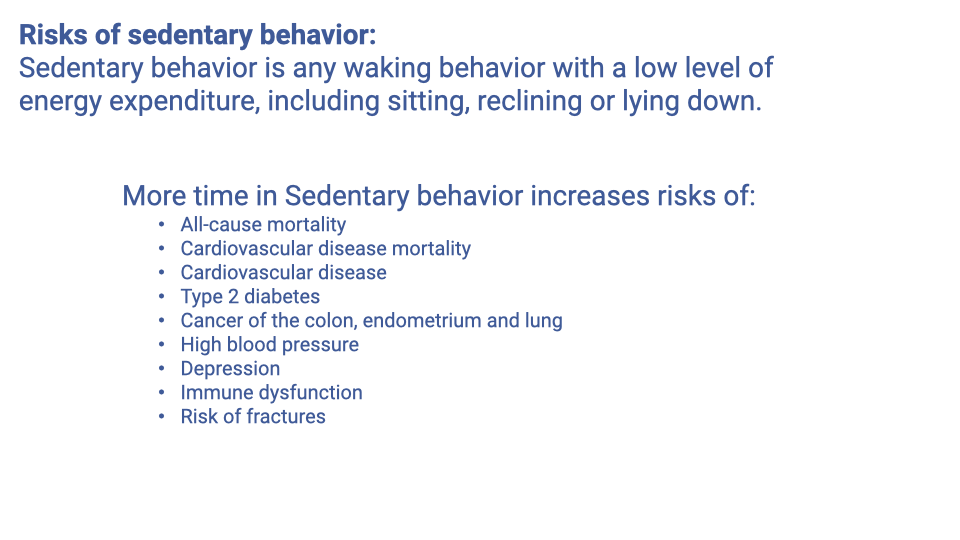
- Sedentary behavior is defined as any waking behavior with low energy expenditure — sitting, reclining, or lying down. It is distinct from simply not exercising.
- Independent of exercise habits, more time in sedentary behavior increases the risk of all-cause mortality, cardiovascular disease, type 2 diabetes, several cancers, high blood pressure, depression, immune dysfunction, and fractures.
- The health risks of sedentary behavior are not fully offset by exercise — prolonged sitting carries independent risk even in people who exercise regularly.
Slide 23
Relationship Between Activity, Sitting Time, and Mortality Risk
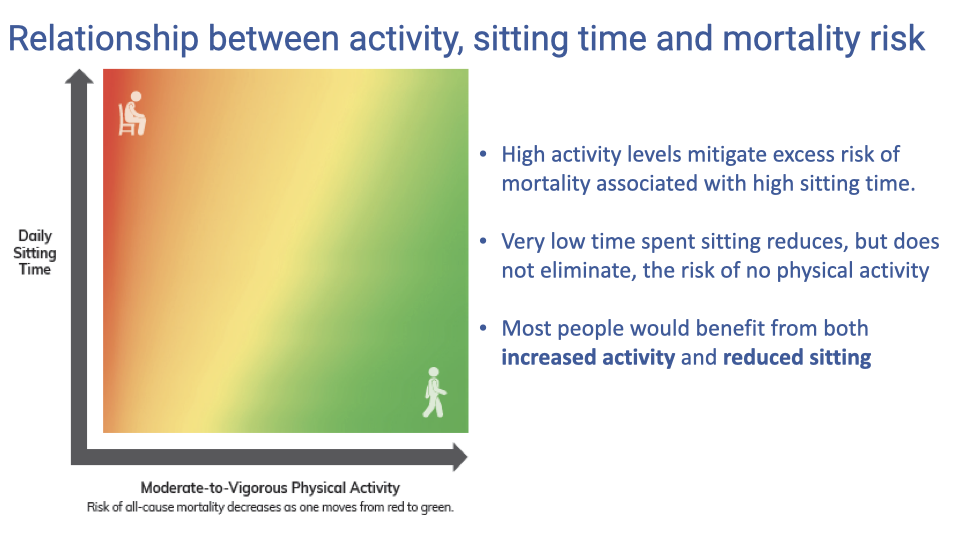
- Mortality risk is determined by the combination of physical activity level and daily sitting time — not either factor alone.
- High activity levels partially mitigate the excess mortality risk from prolonged sitting, but do not eliminate it entirely.
- Conversely, very low sitting time reduces but does not eliminate the risk associated with physical inactivity.
- Most people would benefit from both increasing physical activity and reducing sitting time.
Slide 24
Social Justice and Equity Issues with Exercise as Medicine
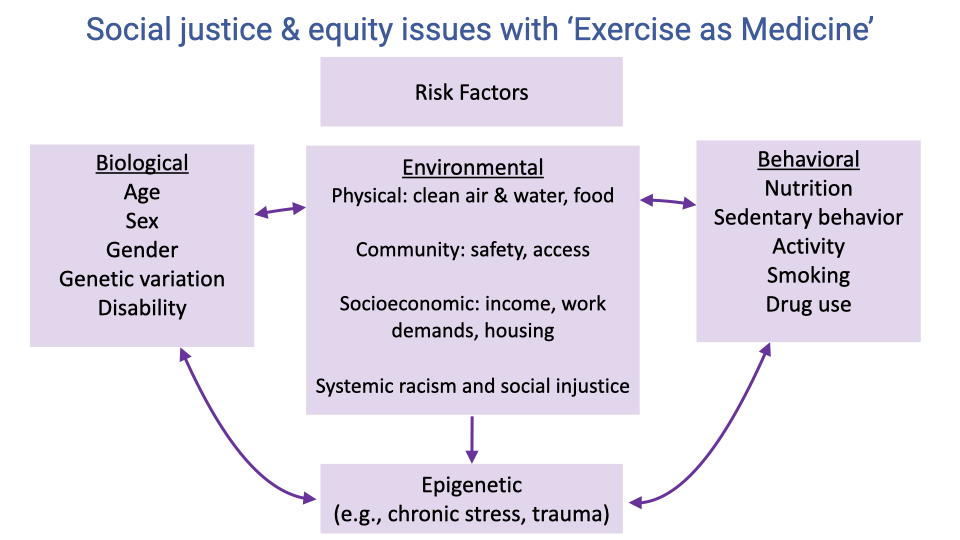
- The ability to use exercise as medicine depends not only on individual biology and behavior but also on environmental and social factors.
- Environmental factors include access to clean air, water, and food; safe community spaces for physical activity; socioeconomic constraints (income, work demands, housing); and the effects of systemic racism and social injustice.
- Biological factors (age, sex, genetic variation, disability) and behavioral factors (nutrition, sedentary habits, smoking) interact with environmental conditions.
- Epigenetic factors — changes in gene expression caused by chronic stress, trauma, or environmental exposures — can have long-lasting effects across generations, linking maternal health status to offspring health outcomes.
Slide 25
Genetics Influence the Effects of Training on VO2 Max
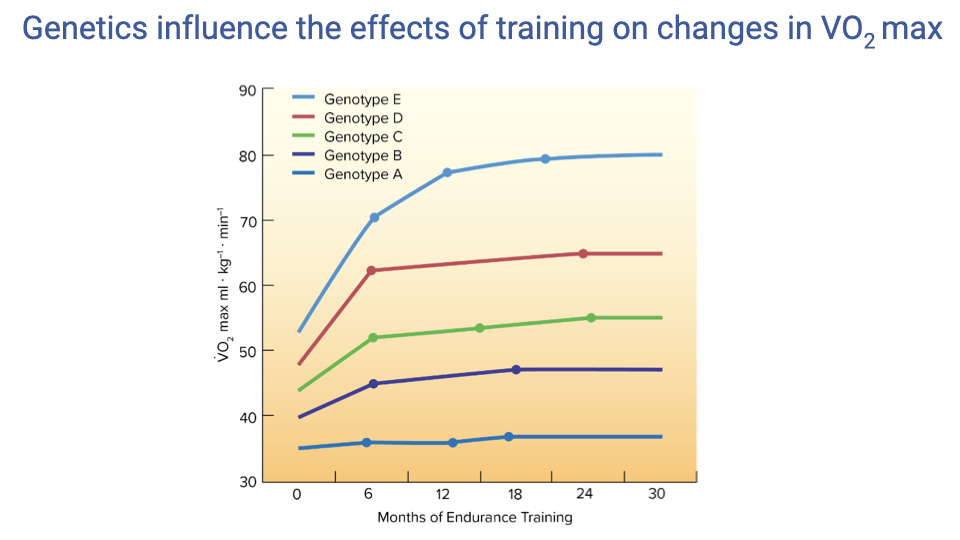
- The trainability of VO2 max has a strong genetic component. Different genotypes show dramatically different responses to the same endurance training program.
- Some genotypes (e.g., Genotype E) show a large, rapid increase from ~40 to ~80 mL·kg⁻¹·min⁻¹ within 6 months, while others (Genotype A) show essentially no change despite 30 months of training.
- This genetic variation in trainability means that standardized exercise prescriptions will not produce uniform outcomes across individuals — an important consideration for clinical exercise programs.
Slide 26
Air Pollution and Air Quality
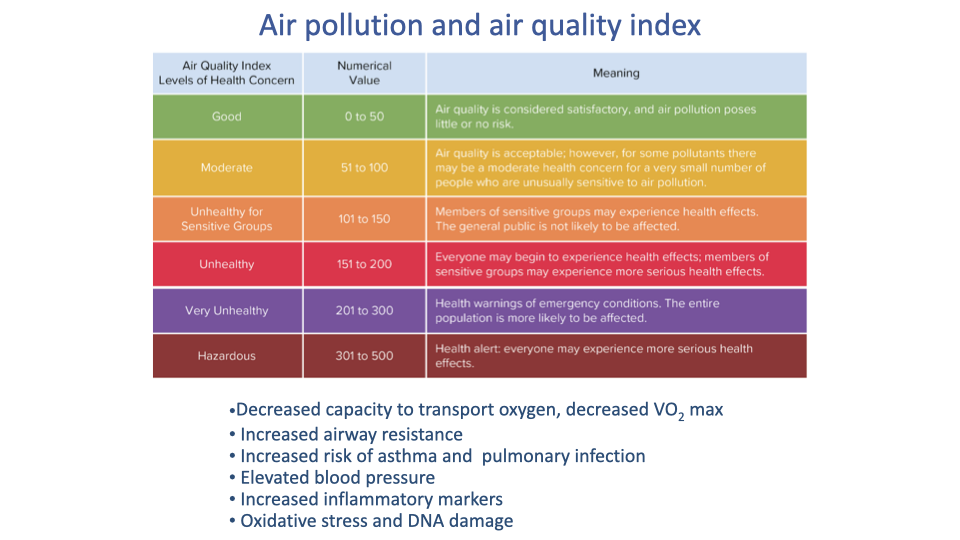
- Chronic exposure to air pollution degrades cardiorespiratory function: decreased oxygen transport capacity, decreased VO2 max, increased airway resistance, elevated blood pressure, and increased inflammatory markers.
- People living in areas with poor air quality face a double burden: their cardiorespiratory capacity is reduced by pollution, and outdoor exercise in polluted air may itself be harmful.
- The Air Quality Index (AQI) provides a standardized scale for communicating health risk levels to the public, from “Good” (0–50) to “Hazardous” (301–500).
Slide 27
Community Factors in Physical Activity
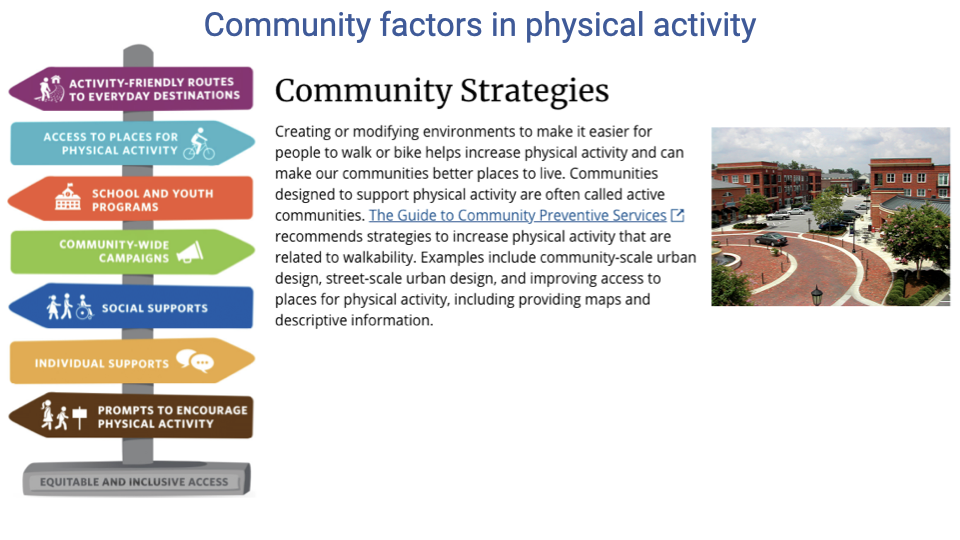
- The Guide to Community Preventive Services identifies seven strategy categories for increasing physical activity: activity-friendly routes, access to places for physical activity, school and youth programs, community-wide campaigns, social supports, individual supports, prompts to encourage activity, and equitable and inclusive access.
- Community-scale and street-scale urban design — including walkable neighborhoods, pedestrian-friendly routes, green spaces, and accessible recreational facilities — directly increase physical activity levels.
- Communities designed primarily for automobile convenience discourage routine physical activity; redesigning infrastructure for walkability and bikeability is a key public health strategy.
Slide 28
Social Justice: Redlining and Health Disparities

- Dr. Cheryl Anderson’s research highlights how historical redlining — a discriminatory practice that denied mortgages and insurance to residents of predominantly minority neighborhoods — has created lasting health disparities.
- Redlining restricted investment in affected communities for decades, limiting the development of health-promoting infrastructure.
Slide 29
Redlining and Neighborhood Health
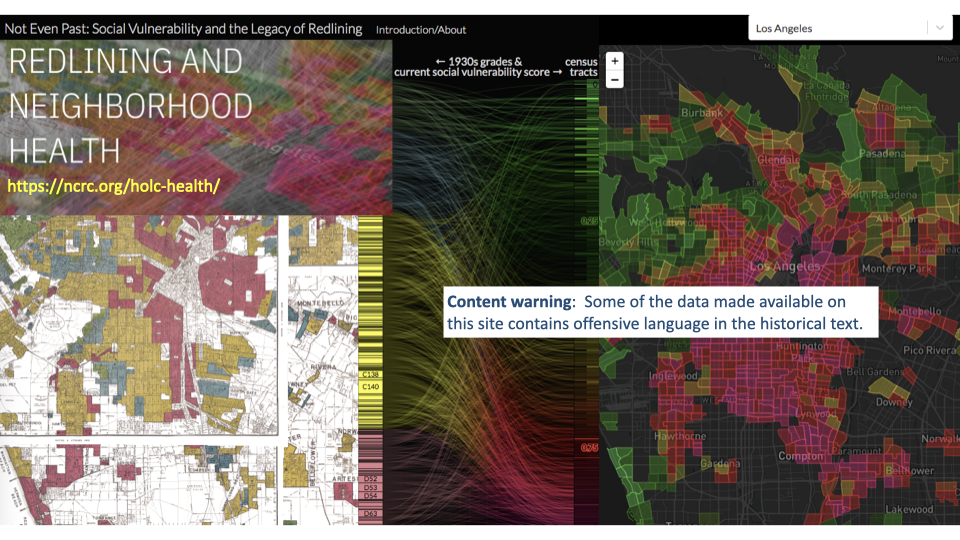
- Interactive data visualizations map historical redlining zones alongside current social vulnerability scores, revealing persistent spatial patterns of health inequality.
- Neighborhoods that were redlined in the 1920s–1970s continue to show elevated social vulnerability and poorer health outcomes decades later.
Slide 30
Redlining: Definition and Legacy
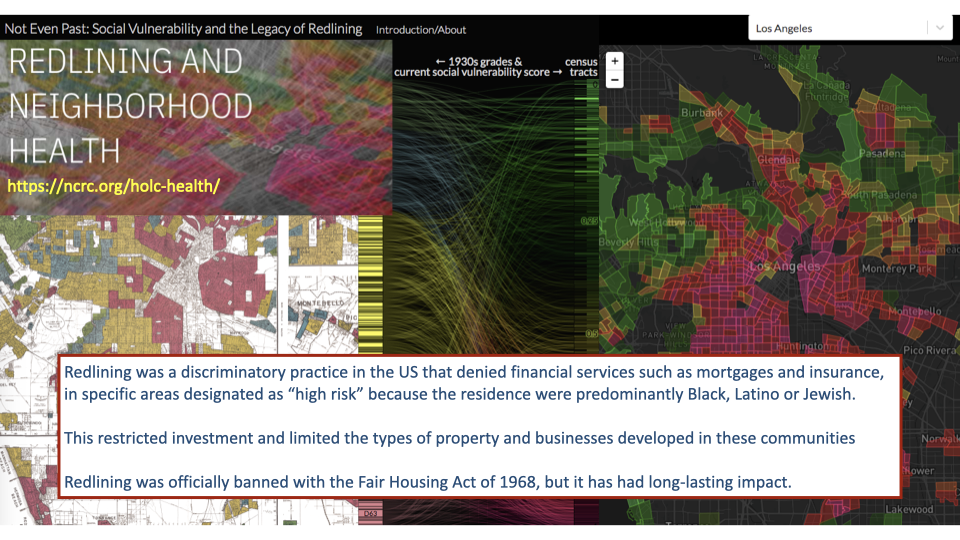
- Redlining was a discriminatory practice in the United States that designated neighborhoods with predominantly Black, Latino, or Jewish residents as “high risk,” denying them mortgages, insurance, and business investment.
- Although officially banned by the Fair Housing Act of 1968, the effects persist: restricted investment over decades limited property development, infrastructure, and community resources in affected areas.
Slide 31
Consequences of Redlining for Physical Activity and Health
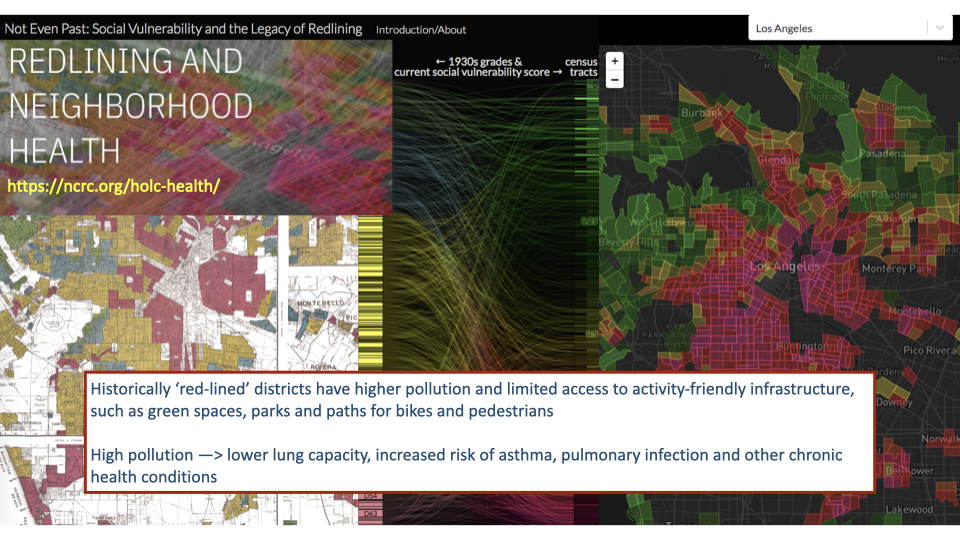
- Historically redlined districts today have higher air pollution levels and limited access to green spaces, parks, and pedestrian and bicycle infrastructure.
- Residents of these communities face compounding barriers to physical activity: fewer safe places to exercise, poorer air quality that reduces cardiorespiratory capacity, and higher baseline rates of chronic disease.
- These structural inequities illustrate why “exercise as medicine” must account for social determinants of health — prescribing exercise without addressing access barriers may widen rather than narrow health disparities.
Slide 32
Social Determinants of Health: Expert Perspectives
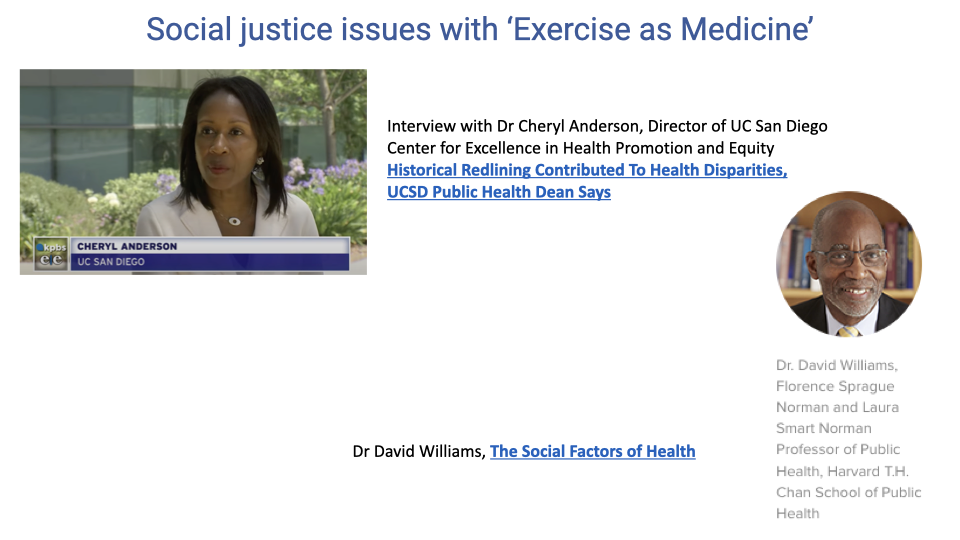
- Dr. Cheryl Anderson’s work at UC San Diego focuses on how historical redlining has contributed to persistent health disparities in affected communities.
- Dr. David Williams at the Harvard T.H. Chan School of Public Health studies the social determinants of health — the structural and social conditions that shape health outcomes beyond individual behavior.
- Together, their research underscores that addressing health inequities requires understanding how systemic factors (housing policy, community investment, environmental quality) interact with biological and behavioral factors to create unequal opportunities for health and physical activity.
Slide 33
Summary: Learning Objectives Revisited
- Cardiorespiratory fitness is strongly associated with reduced all-cause, cardiovascular, and cancer mortality, with a clear dose-response relationship.
- Even small amounts of physical activity provide meaningful health benefits; there is no evidence of harm at high activity levels.
- Exercise benefits extend beyond cardiovascular health to include improved brain function, mental health, sleep, weight management, and outcomes for people with chronic conditions and cancer.
- Sedentary behavior carries independent health risks that are not fully offset by exercise alone.
- Environmental, social, and genetic factors influence an individual’s ability to engage in physical activity, and equity considerations are essential when applying the concept of exercise as medicine.
Key Equations
This lecture is primarily evidence-based and clinical, with no new mathematical equations. The key quantitative benchmarks discussed are:
| Concept | Value |
|---|---|
| CDC recommended moderate-intensity aerobic activity | ≥150 minutes per week |
| CDC recommended vigorous-intensity aerobic activity | ≥75 minutes per week |
| CDC recommended muscle-strengthening activity | ≥2 days per week |
| Activity level for ~70% of maximum mortality benefit | ~8.25 MET-hours per week |
| Chronic disease risk reduction from meeting guidelines | 20–40% |
| Cancer risk reduction from physical activity | 12–25% depending on cancer type |
| Cardiac injury in trained vs. untrained during MI | ~20% vs. ~60% |
Glossary
| Term | Definition |
|---|---|
| Cardiorespiratory fitness | The ability to perform large-muscle, whole-body exercise at moderate-to-vigorous intensities for extended periods; primarily measured by VO2 max |
| Dose-response relationship | The principle that increasing amounts of physical activity produce progressively greater health benefits, with no evidence of harm at high levels |
| Epigenetics | Changes in gene expression caused by environmental factors (such as chronic stress, pollution, or maternal health status) that do not alter the DNA sequence but can persist across generations |
| Health span | The period of life during which an individual maintains healthy, independent function — as distinct from total lifespan |
| MET (metabolic equivalent of task) | A unit expressing the energy cost of physical activity relative to rest; 1 MET equals resting metabolic rate (~3.5 mL O2·kg⁻¹·min⁻¹) |
| Redlining | A historically discriminatory practice in the United States that denied mortgages and insurance to residents of predominantly minority neighborhoods, leading to persistent health disparities through reduced community investment |
| Sedentary behavior | Any waking behavior characterized by low energy expenditure (≤1.5 METs) while sitting, reclining, or lying down; carries independent health risks beyond physical inactivity |