Lecture 18: Putting Human Locomotion into a Comparative Context
Slide 1

- Final lecture of the locomotion unit. Goal: integrate material from across the course — gas exchange, oxygen cascade, muscle physiology, force demands, and cost of transport — into an evolutionary view of human locomotor function.
Slide 2
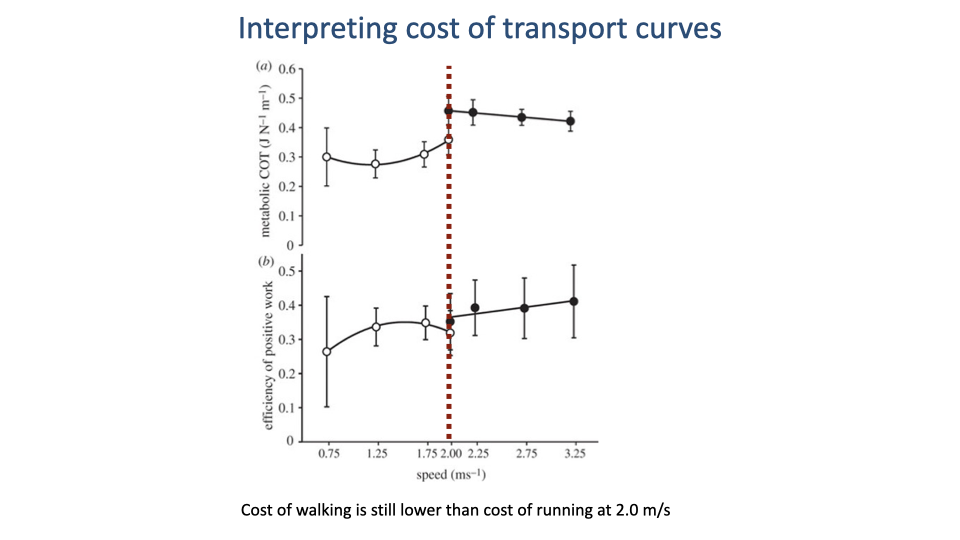
Worked Example — Predicting the Walk–Run Transition Speed
- Reading off the lowest measured running data point (2.0 m/s on this graph) is a tempting shortcut for the walk–run transition — but it is wrong.
- At 2.0 m/s the walking CoT is still lower than the running CoT. There is no energetic reason for a walker to switch yet.
- Rule for interpreting CoT curves: the gait-transition speed is the intersection of the two CoT curves — the speed at which both gaits cost the same per meter traveled. Above the crossover, running is cheaper; below it, walking is cheaper.
- The intersection often lies beyond the measured data range for one of the gaits, so finding it requires extrapolating the walking curve forward along the same U-shape implied by the data already in hand.
Slide 3
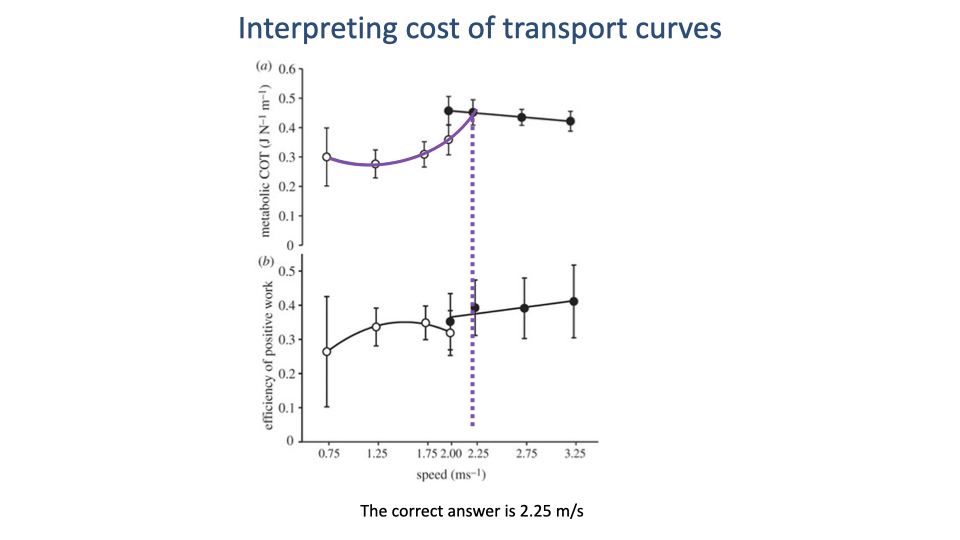
Walk–Run Transition Speed — Extrapolated Intersection
- Extrapolating the walking U-curve forward (purple dashed segment), it intersects the declining running curve at ~2.25 m/s.
- That intersection is the predicted walk–run transition speed for this dataset — the speed above which walking becomes more expensive than running, so a rational walker switches to a run.
- General lesson: gait-transition predictions require projection of both CoT curves to where they cross, not just inspection of measured points within each gait’s data range.
Slide 4
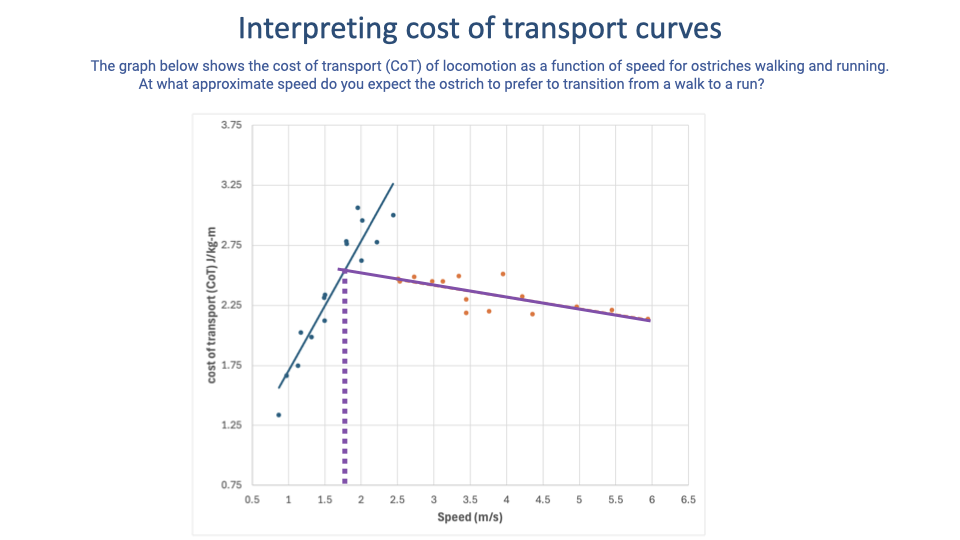
Worked Example — Ostrich Walk–Run Transition
- Same logic applied to ostrich data. Walking and running data ranges in ostriches do not overlap — unlike treadmill-trained horses, ostriches will not readily walk at very high speeds or run at very low ones.
- Tempting but incorrect: reading the transition as ~2.5 m/s (the lowest measured running speed).
- Correct approach: extrapolate the walking line and find where it intersects the running line — at ~1.75 m/s, well below the lowest measured running speed in this dataset.
- Comparative note: ostriches walk over a much narrower speed range than humans; their transition speed is also lower in absolute terms.
Slide 5
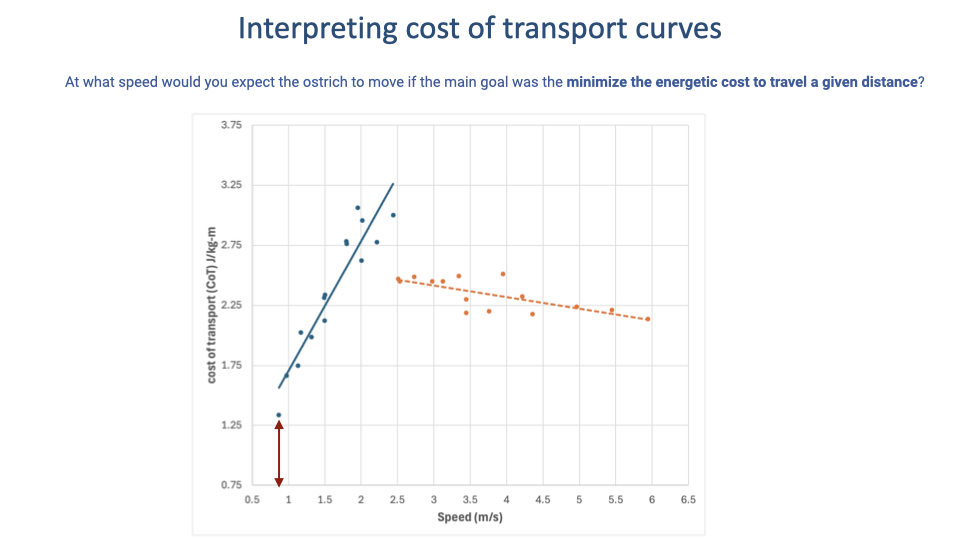
Worked Example — Minimum-CoT Speed in the Ostrich
- A different question on the same dataset: not the gait-transition speed, but the speed that minimizes CoT across the whole dataset.
- Answer: the lowest measured walking speed (~0.8 m/s) — at that point CoT reaches its dataset minimum (~1.3 J/kg·m).
- Key distinction: minimum-CoT speed and preferred speed are not the same thing. Animals do not always pick the speed that minimizes CoT — preferred speed depends on why they are moving (foraging, migration, predator escape, social travel).
- To find a minimum-CoT speed, scan the whole curve for its lowest value — do not assume it sits at the bottom of the U for the gait the animal happens to prefer.
Slide 6
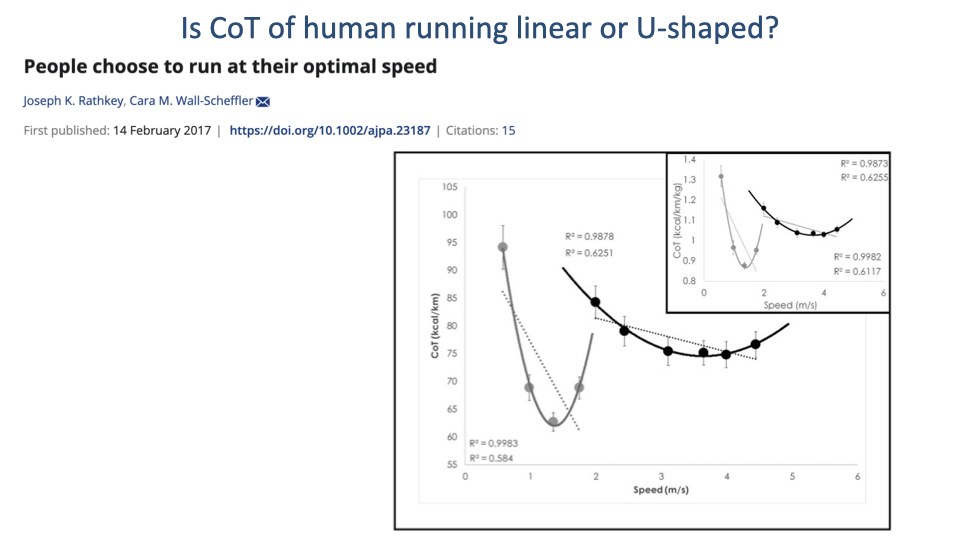
Is the Human Running CoT Curve Truly Flat?
- Lecture 17 noted that the human running CoT curve appears nearly flat with speed — a hallmark of bipedal running.
- Recent debate (Rathkey & Wall-Scheffler 2017): with larger samples and wider speed ranges, the running CoT curve fits a U-shape somewhat better than a flat line.
- Two practical drivers of the historical flat-curve picture:
- Old respirometry studies required 6+ minutes of steady-state running, limiting the range of speeds that could be sampled.
- Average runners could not maintain high speeds long enough to measure steady-state CoT — biasing data to lower speeds.
- The running CoT curve is shallower than the walking curve, but it does have a true minimum. Whether it looks “flat” or “U-shaped” depends on the speed range sampled and the fitness level of subjects.
Slide 7
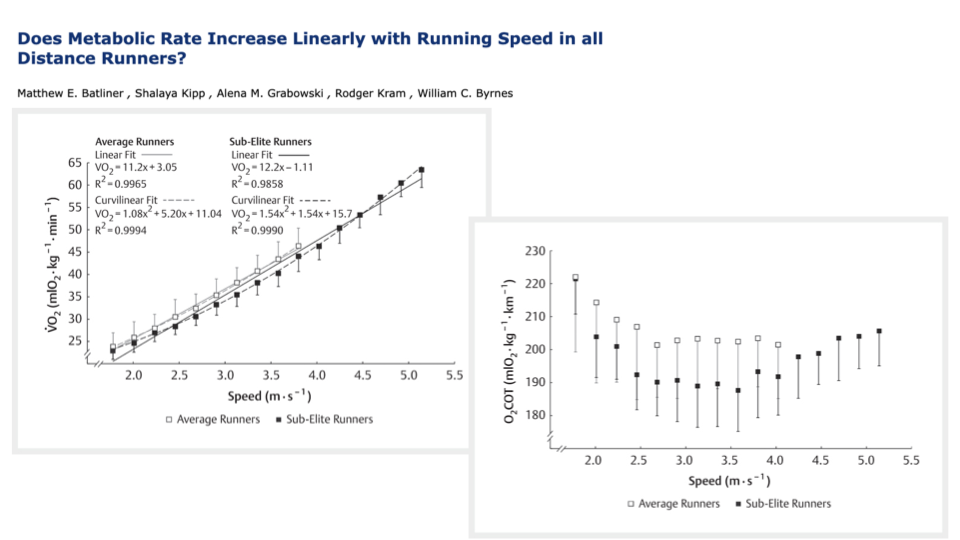
Average vs Sub-Elite Runners — Sample Size Reveals the U-Shape
- Batliner et al. measured CoT in both average and sub-elite runners across a wide speed range.
- Average runners (open squares) sample mostly slower speeds and produce a CoT trend that looks nearly flat or even slightly decreasing.
- Sub-elite runners (filled squares) can sustain higher speeds — when their data are added, the U-shape clearly emerges, with a minimum at ~3.0–3.5 m/s.
- A curvilinear fit improves R2 only slightly over a linear fit (0.9994 vs 0.9965), but the shape of the optimum is real.
- Methodological lesson: the apparent “flat” running CoT in the classic literature reflects limited speed sampling and limited subject fitness, not a special property of bipedal running.
Slide 8
Lecture Overview and Objectives
- Overview: think about humans in an evolutionary context — what does the comparative method tell us about our locomotor specializations?
- Learning objectives:
- Discuss adaptive features for athletic movement across vertebrates (speed, economy, endurance).
- Critically evaluate the evidence that humans are running specialists.
Slide 9
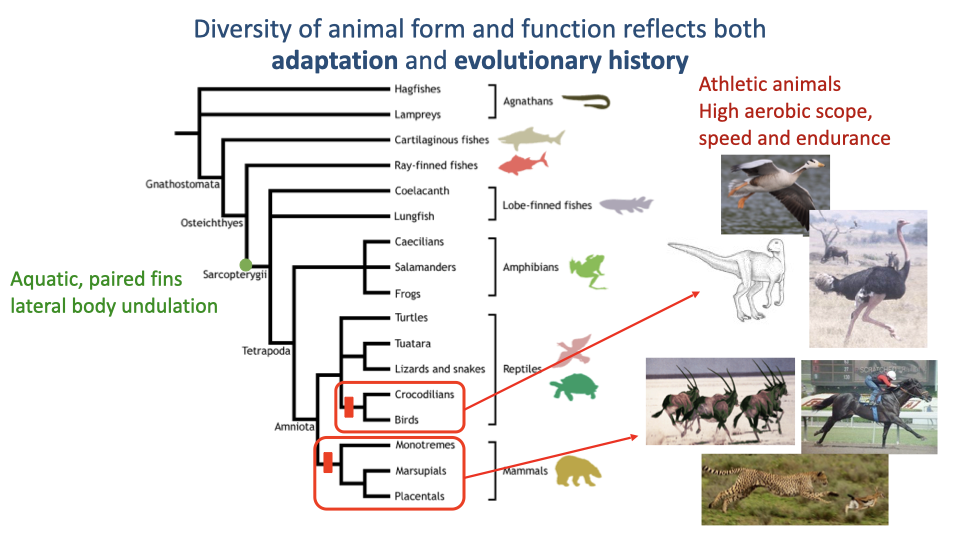
Athleticism Evolved Multiple Times Across Vertebrates
- The vertebrate phylogeny on the left shows the major clades from hagfishes to placental mammals.
- High aerobic scope, speed, and endurance have emerged multiple times independently — most strikingly in birds (theropod dinosaurs) and in mammals (with athletic crocodilians a more limited example).
- This is convergent evolution in the broad sense: similar physical demands (escape, predation, foraging over long distances) have driven repeated emergence of high-performance locomotion in unrelated lineages.
Slide 10
Transition — Morphological Adaptations for Endurance
- Section divider. The next slides survey morphological features that distinguish endurance specialists, before moving on to physiological features.
Slide 11
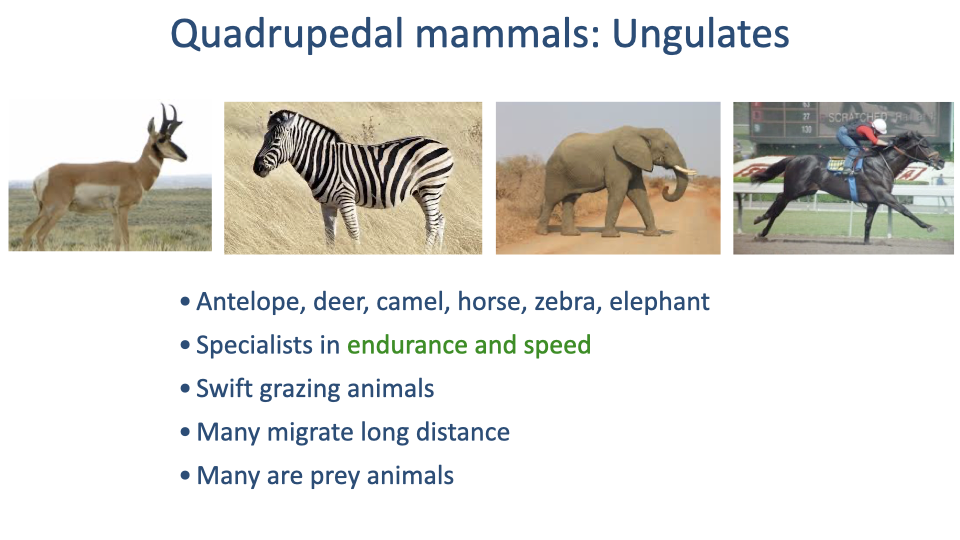
Endurance Specialists — Quadrupedal Ungulates
- Ungulates (antelope, deer, camel, horse, zebra, elephant) are the canonical quadrupedal endurance specialists.
- They are specialists in both endurance and speed — the same lineage often supplies both.
- Ecological drivers:
- Swift grazing: herbivorous, but must move efficiently between dispersed food and water resources.
- Long-distance migration: many species track seasonal resources over hundreds or thousands of kilometers.
- Prey status: many are subject to predator escape, selecting for both maximum speed and economical sustained travel.
Slide 12
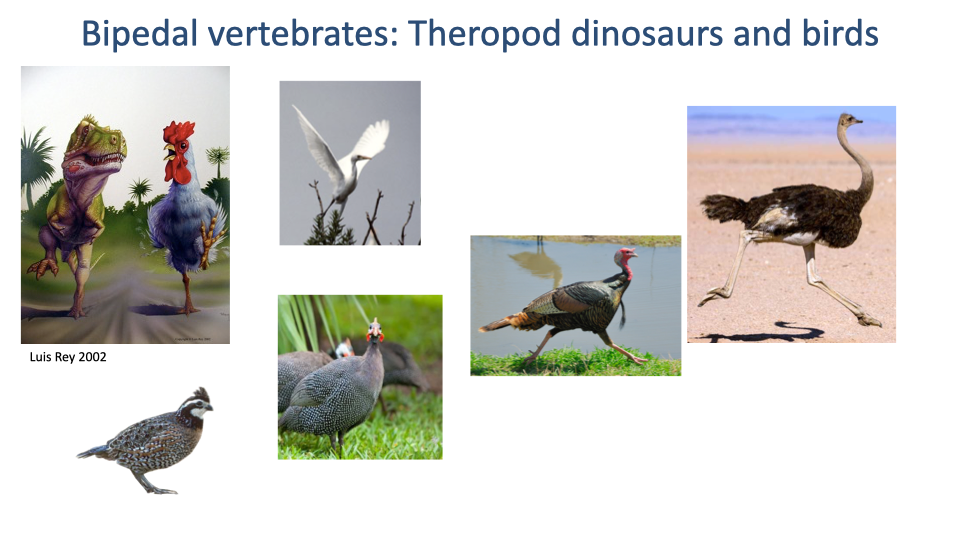
Endurance Specialists — Theropod Dinosaurs and Birds
- The other major clade of athletic vertebrates: theropod dinosaurs and their modern descendants, birds.
- Cursorial ground birds (ostrich, emu, rhea, guinea fowl, turkey, quail) display the same morphological pattern as ungulates: upright posture, elongated distal limbs, proximally concentrated muscle mass.
- Bipedalism in this lineage is ancient (~250 million years) — much older than human bipedalism (~5–10 million years).
- Provides a powerful comparative reference point: the morphology of cursorial birds shows what a long evolutionary history of bipedal running specialization looks like.
Slide 13
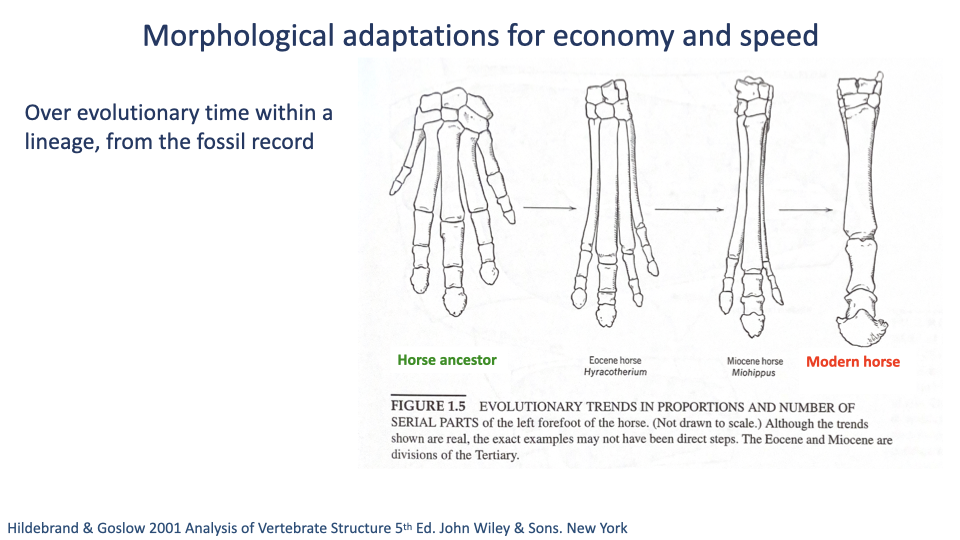
Within-Lineage Evolution — Horse Foot Reduction
- The horse fossil record provides a textbook example of within-lineage evolution toward athleticism.
- Bone fusion and elongation of the distal foot, digit reduction from five toes (ancestral) down to one (modern Equus).
- Functional payoffs:
- Lighter distal limb → lower swing-leg inertia → lower cost to oscillate the leg.
- Reduced number of joints distally → fewer muscles needed for stabilization, further reducing distal-limb mass.
- Longer distal leg segment → longer effective leg → longer step length → lower CoT.
Slide 14
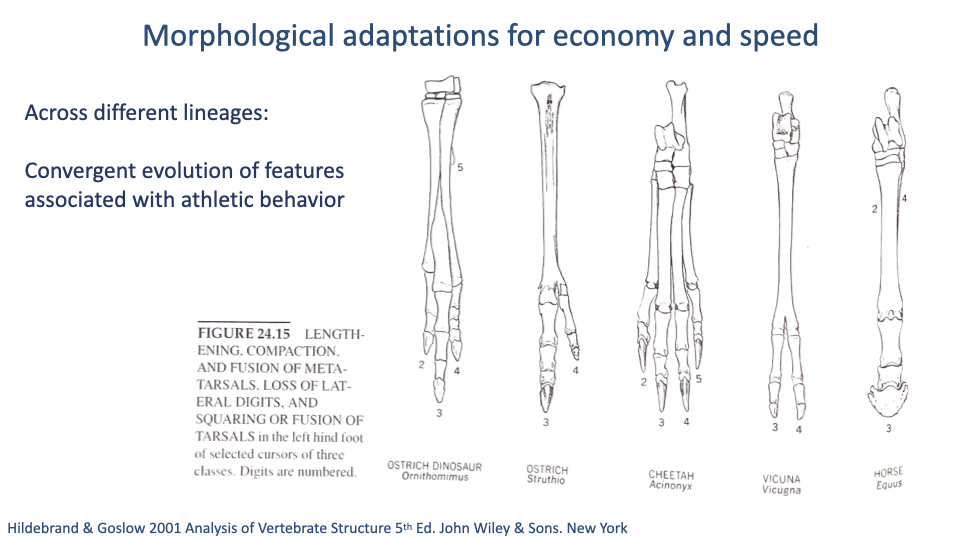
Convergent Evolution — Same Pattern Across Lineages
- The same morphological pattern appears independently in:
- Ostrich-mimic dinosaurs (Ornithomimus, ~80 Mya).
- Modern ostriches (~10 Mya extant lineage).
- Cheetahs (mammalian carnivore specialist).
- Vicuñas and horses (perissodactyl and artiodactyl ungulates).
- All show lengthening and fusion of metatarsals/metacarpals, loss of lateral digits, fusion of tarsals.
- Convergent evolution is a powerful argument that these features are functional adaptations for running, not just shared ancestry.
Slide 15
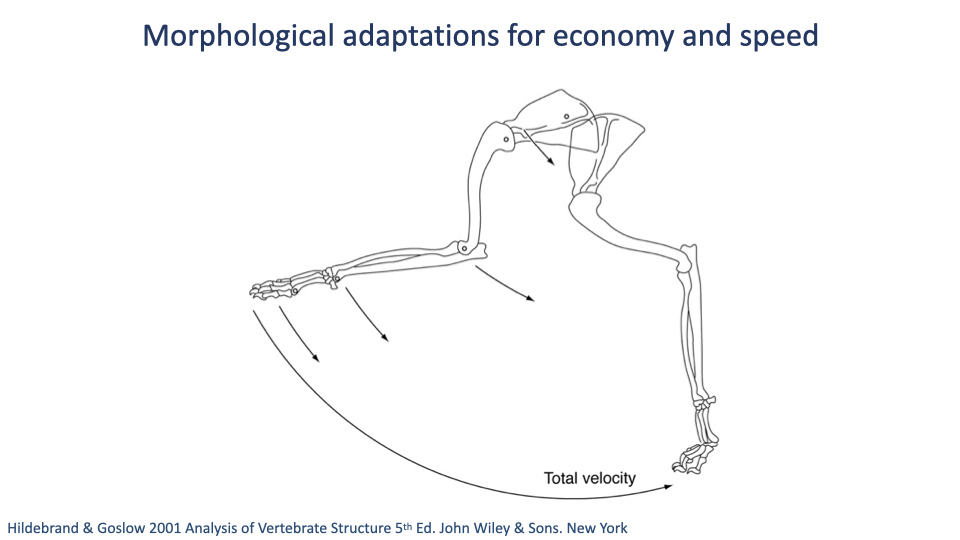
Why Long Legs and Many Segments Give High Speed
- A schematic of how segment rotations sum to produce foot velocity.
- Each limb segment rotates relative to the proximal segment; the velocities add along the kinematic chain.
- Longer segments and more segments → higher foot velocity at the same angular rates → higher running speeds achievable.
- This is the geometric basis for one of the recurring morphological themes: longer distal limbs → faster and more economical locomotion.
Slide 16
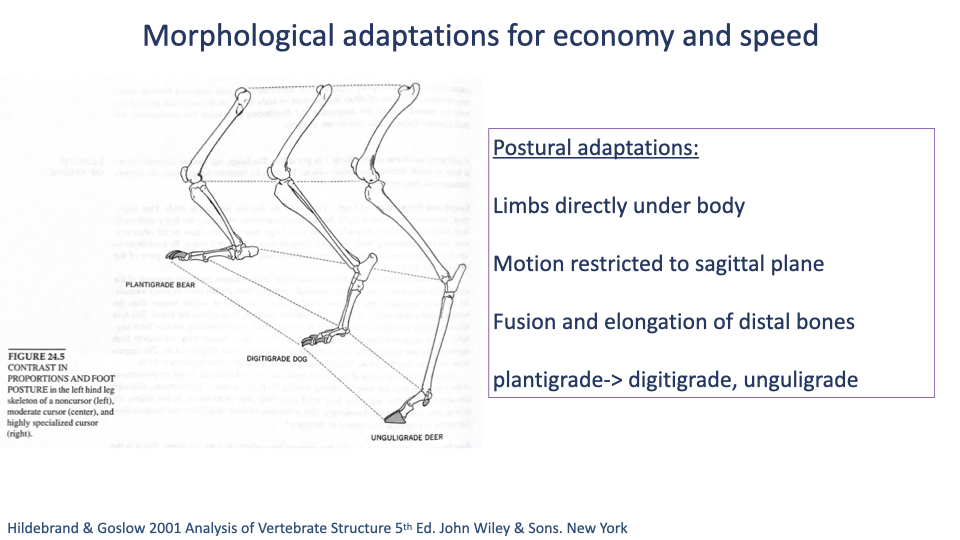
Postural Adaptations Across Mammals
- Foot posture progresses along a continuum with increasing cursorial specialization:
- Plantigrade — entire foot in ground contact (humans, bears).
- Digitigrade — toes on ground, heel and metatarsals elevated (dogs, cats, birds).
- Unguligrade — only tip of toe on ground, hoof at the very end (horses, deer, antelope).
- General postural changes in cursorial animals:
- Limbs directly under the body (vertically aligned).
- Motion restricted to the sagittal plane (minimizing wasteful side-to-side body motion).
- Fusion and elongation of distal bones (longer effective leg, lighter distal mass).
Slide 17
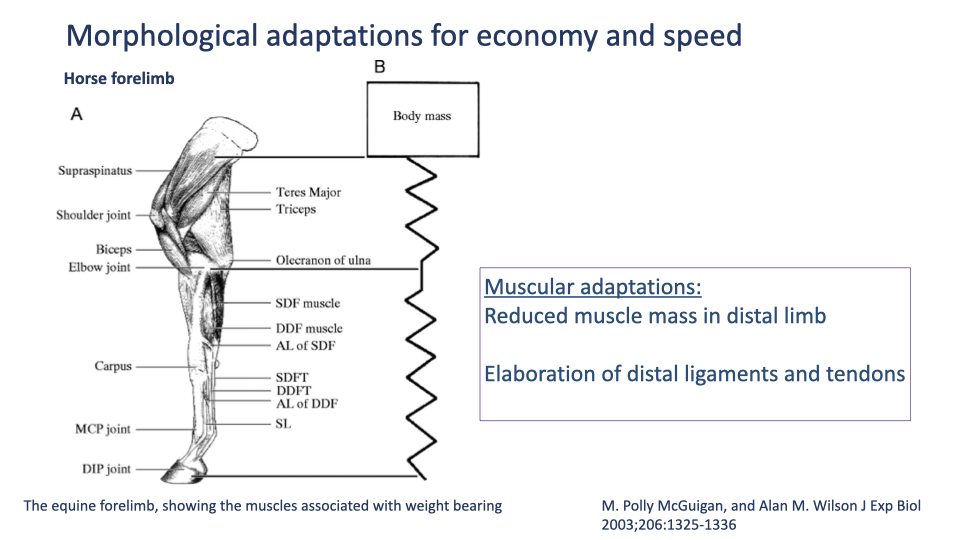
Equine Forelimb — Muscle Mass Concentrated Proximally
- McGuigan & Wilson 2003 anatomical view of the horse forelimb:
- Proximal: large supraspinatus, triceps, teres major, biceps — high-force, work-producing muscles.
- Distal: almost no muscle belly — only long superficial and deep digital flexor tendons (SDFT, DDFT) and the suspensory ligament, plus thin guiding muscles.
- The right-hand schematic shows the whole distal limb as a passive elastic spring between body mass and ground.
- Adaptations summarized:
- Reduced distal-limb muscle mass → lower swing inertia, less metabolic cost to cycle the limb.
- Elaboration of distal ligaments and tendons → elastic energy storage and return during stance, especially in high-speed gaits.
Slide 18
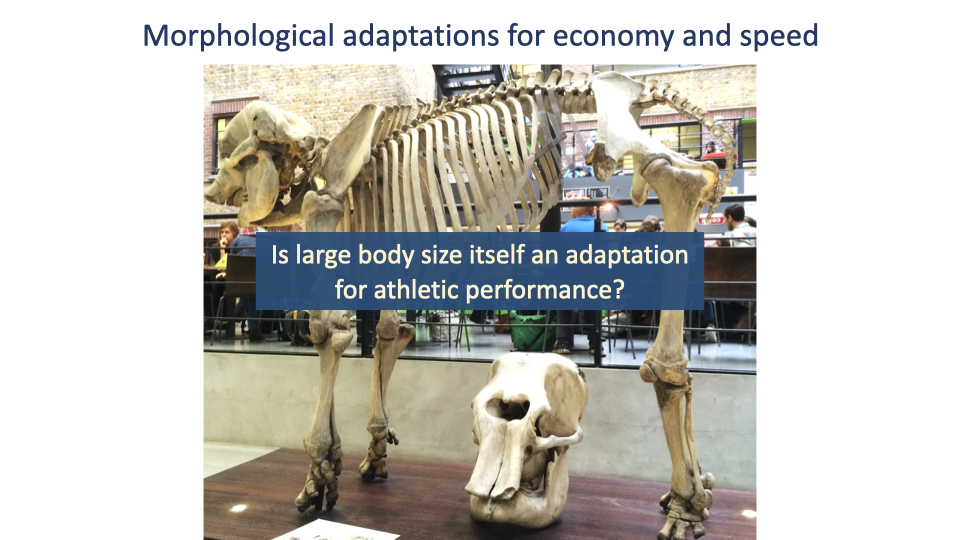
Is Large Body Size Itself an Athletic Adaptation?
- An interlude before the human discussion: elephants lack the elaborated distal tendons and slender limbs of horses, but they can travel long distances economically.
- Why? Large body size alone provides long Lc (long step length) and slow muscle-cycling frequency — the same Kram-Taylor factors that lower CoT.
- So large body size can be a sufficient adaptation for low-cost long-distance travel, even without explicit cursorial morphology.
- This reframes the question of human athleticism: humans are large-bodied compared with most mammals, and that alone gives us a relatively low CoT — independent of any running-specific adaptations.
Slide 19
Taylor 1970 — Humans Have Higher CoT Than Expected
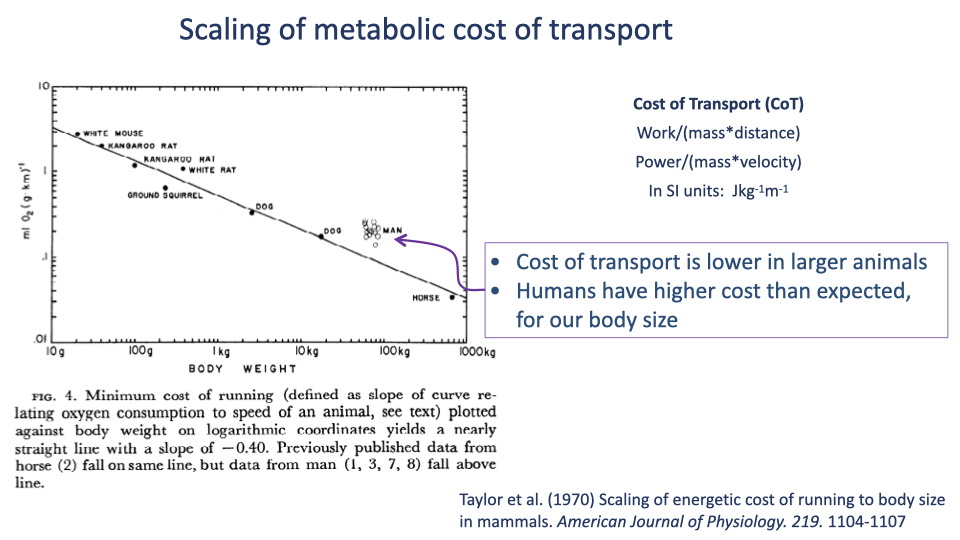
- The classical CoT vs. body mass scaling line from Taylor et al. 1970 shows CoT decreasing with body mass with a slope of ~−0.4 (log-log).
- Humans (Man) sit above the trend line — our running CoT is higher than predicted by body size alone.
- Original Taylor et al. estimate: human running ~50% more expensive than expected.
- Sets up the contemporary question: are we disadvantaged runners for our size, or did Taylor’s limited dataset overstate the gap?
Slide 20
Modern Reappraisal — Humans Run Costlier, Walk Cheaper Than Expected
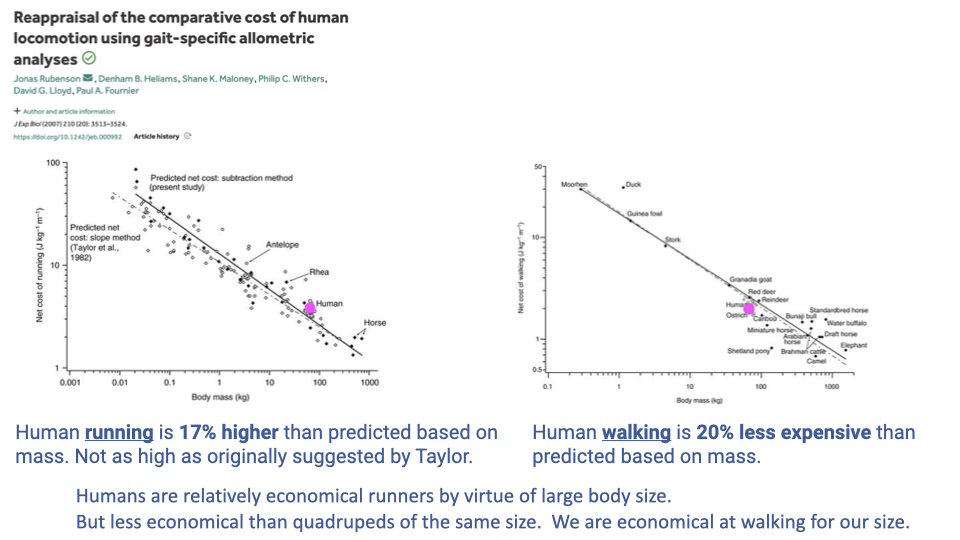
- Rubenson et al. reanalyzed the comparative CoT data with more species, larger samples, and updated statistical methods.
- Revised findings:
- Human running is ~17% higher than predicted from body mass — much smaller than Taylor’s original ~50% estimate, but still real.
- Human walking is ~20% less expensive than predicted from body mass.
- Synthesis:
- Running: humans are mediocre by mass, economical only because we are large.
- Walking: humans are exceptionally economical for our body size.
- This dataset is central to the endurance running vs endurance walking debate (Slides 26–31): the strongest case is for economical walking, not necessarily for running specialization.
Slide 21
The Largest Animals Are Not the Fastest
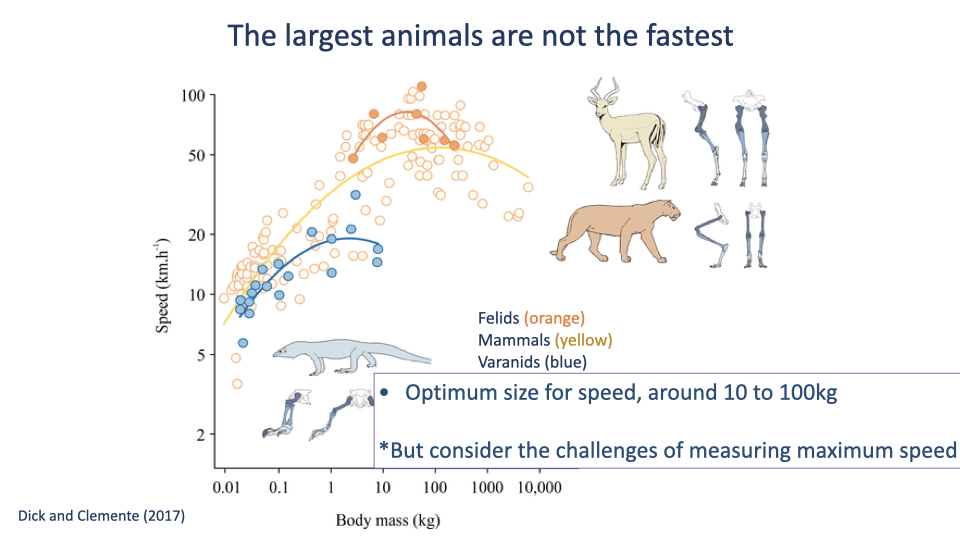
- Dick & Clemente 2017 compiled top-speed data across mammals, felids, and varanid lizards.
- Within each lineage, top speed vs body mass shows an inverted-U — there is an intermediate optimum size for maximum speed (~10–100 kg).
- Optima:
- Felids peak at ~80 km/h near 50 kg (cheetah-sized).
- General mammals peak at ~60 km/h near 100 kg.
- Varanid lizards peak much lower, near 10 kg.
- Humans sit near the mammalian optimum for size — though far below the speed line, because top human speed is limited by other factors (bipedal posture, distal-limb mass, training).
- Estimating true maximum speed in wild animals is methodologically hard — historical “top speed” data were often estimated from a Jeep speedometer chasing the animal.
Slide 22
Transition — From Morphology to Physiology
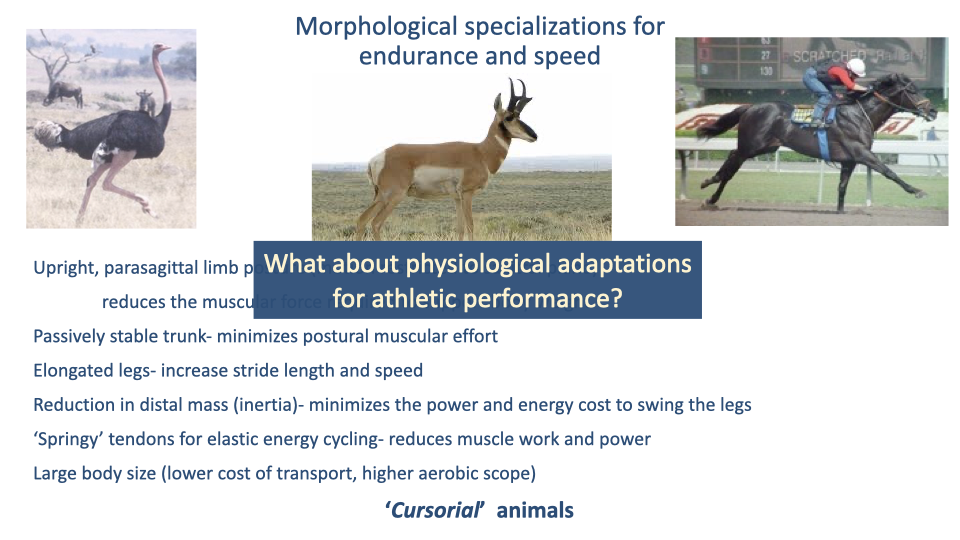
- Summary of the morphological adaptations for endurance and speed seen in cursorial vertebrates:
- Upright parasagittal limb posture — reduces muscle force demand to support body weight.
- Passively stable trunk — minimizes postural muscular effort.
- Elongated legs — longer stride, higher speed, lower CoT (Kram & Taylor).
- Reduced distal mass — lower swing-leg inertia.
- “Springy” tendons — elastic energy cycling reduces muscle work and power.
- Large body size — lower CoT, higher aerobic scope.
- Animals showing these features are called cursorial (running-adapted).
- Next: what about the physiological side — the oxygen supply cascade and aerobic capacity?
Slide 23
Setting Up the Physiology Discussion
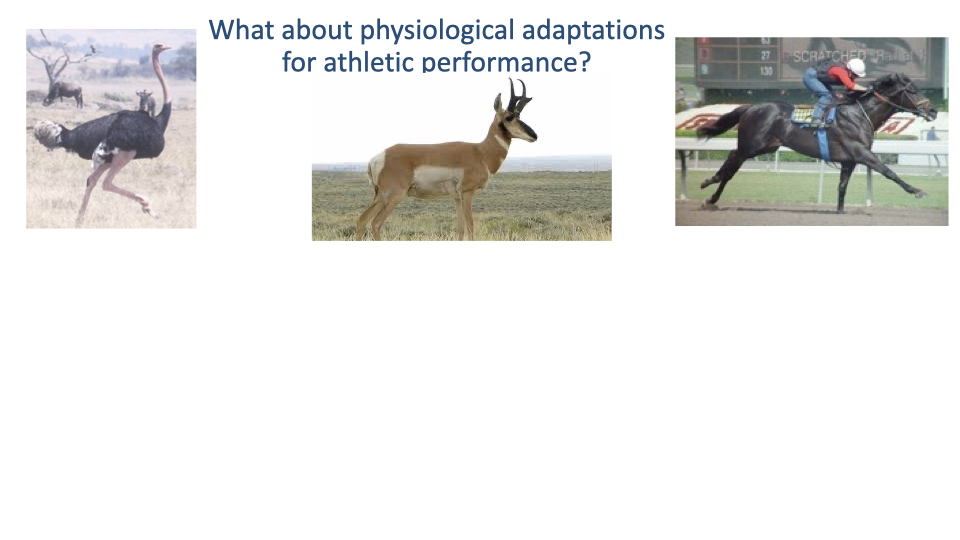
- Section divider. The next slides cover physiological adaptations for athletic performance — high VO2max, lung and cardiac specialization, hematocrit, thermoregulation, and how humans rank physiologically against other vertebrate athletes.
Slide 24
Factorial Aerobic Scope — Athletic vs Non-Athletic
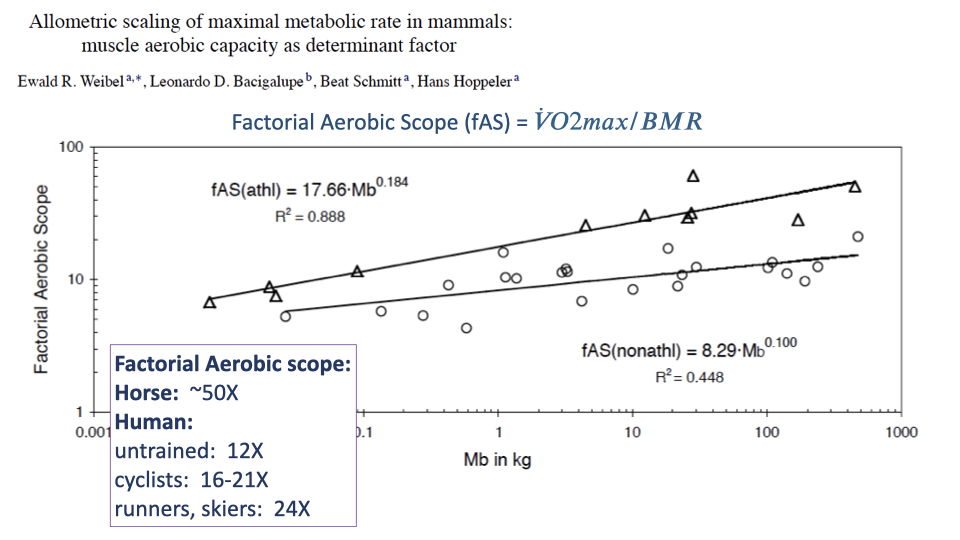
- Factorial aerobic scope (fAS) = $\dot{V}O_{2max}/BMR$ — how many times above basal metabolic rate the animal can sustain.
- Scaling:
- Athletic species: $fAS_{athl} = 17.66 \cdot M_b^{0.184}$, R2 = 0.89.
- Non-athletic species: $fAS_{nonathl} = 8.29 \cdot M_b^{0.100}$, R2 = 0.45.
- Athletic species sit at 2–4× higher fAS than non-athletic species at the same body size.
- Human placement:
- Untrained humans: fAS ≈ 12 — squarely in the non-athletic range.
- Trained cyclists: 16–21.
- Elite runners and cross-country skiers: 24.
- A horse can have fAS ≈ 50. Even our most trained athletes are not exceptional by mammalian standards — humans are physiologically average mammals in aerobic scope, somewhat above non-athletic average with training.
Slide 25
Physiological Specializations Summarized
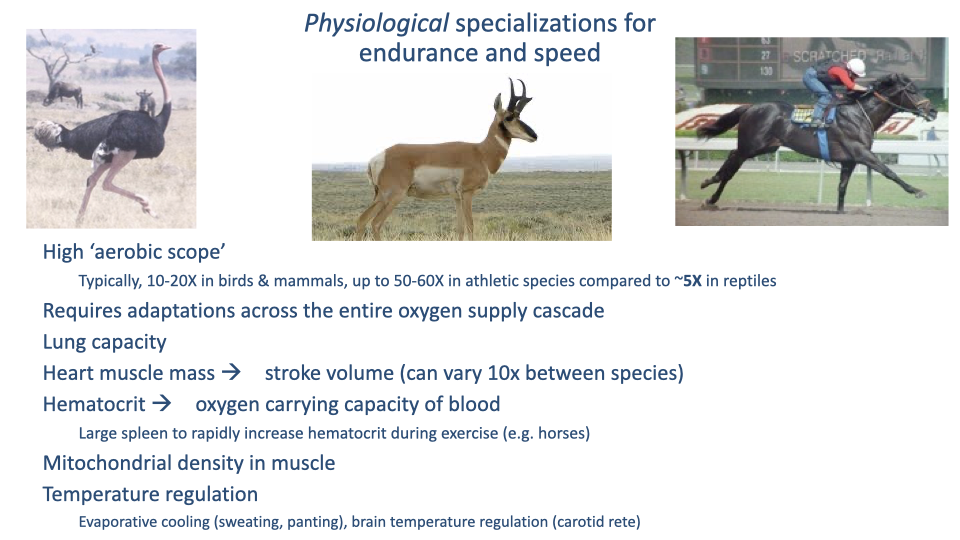
- Athletic species achieve high aerobic scope through adaptations across the entire oxygen supply cascade (a recurring theme of E183):
- Lung capacity — increased gas-exchange surface area and ventilation rate.
- Heart muscle mass and stroke volume — can vary 10× between species (e.g., horses have very large hearts for their size).
- Hematocrit — higher oxygen-carrying capacity per unit blood volume.
- Splenic blood reserve — horses have a very large spleen that releases stored red blood cells to rapidly elevate hematocrit during exercise.
- Mitochondrial density in muscle — increases capacity for sustained ATP production.
- Temperature regulation — evaporative cooling (sweating in humans, panting in dogs); brain-temperature regulation via the carotid rete in ungulates.
- Humans shine specifically in thermoregulation — extensive sweat glands and hairless skin allow exceptional evaporative cooling, supporting sustained exercise in heat where many other mammals would overheat.
Slide 26
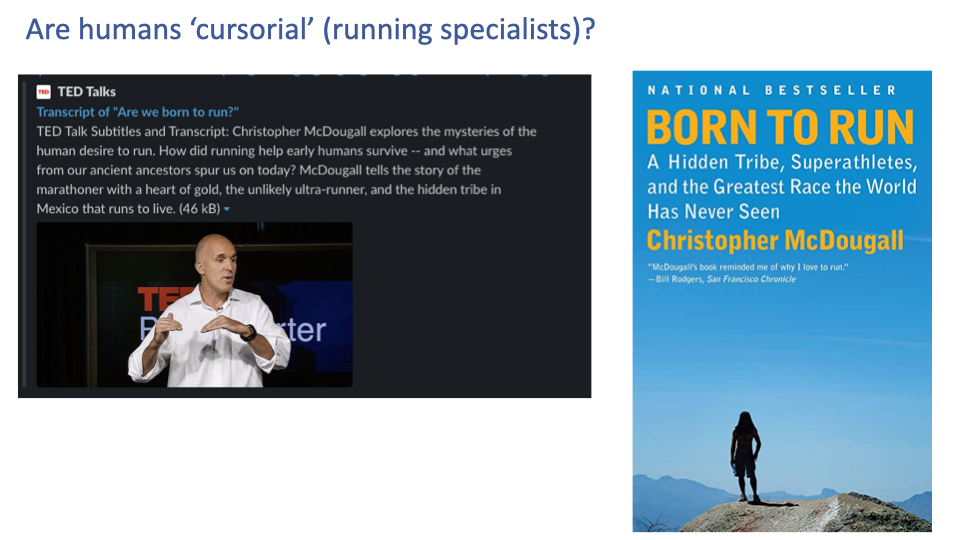
Are Humans Running Specialists?
- The question is not just academic — it has been debated publicly for decades.
- Christopher McDougall’s “Born to Run” (and his TED talk) argued forcefully for human endurance running as our defining trait, popularizing barefoot running and the lifestyle of the Tarahumara people of Mexico.
- The popular case rests largely on the scientific work of Bramble & Lieberman (next slides) — but as with all hypothesis claims, it needs critical evaluation.
Slide 27
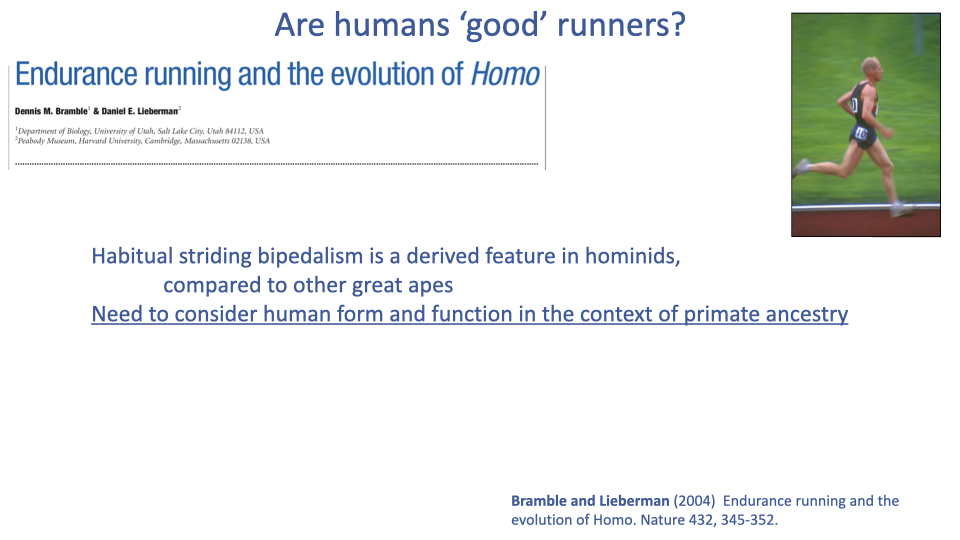
Bramble & Lieberman 2004 — The Endurance-Running Hypothesis
- The Bramble & Lieberman 2004 Nature paper is the foundational scientific paper for the endurance-running hypothesis.
- Key framing: habitual striding bipedalism is derived in hominids — it does not exist in other great apes.
- Therefore, human locomotor anatomy must be considered in the context of primate ancestry, not against the broad mammal background of Slide 19.
Slide 28
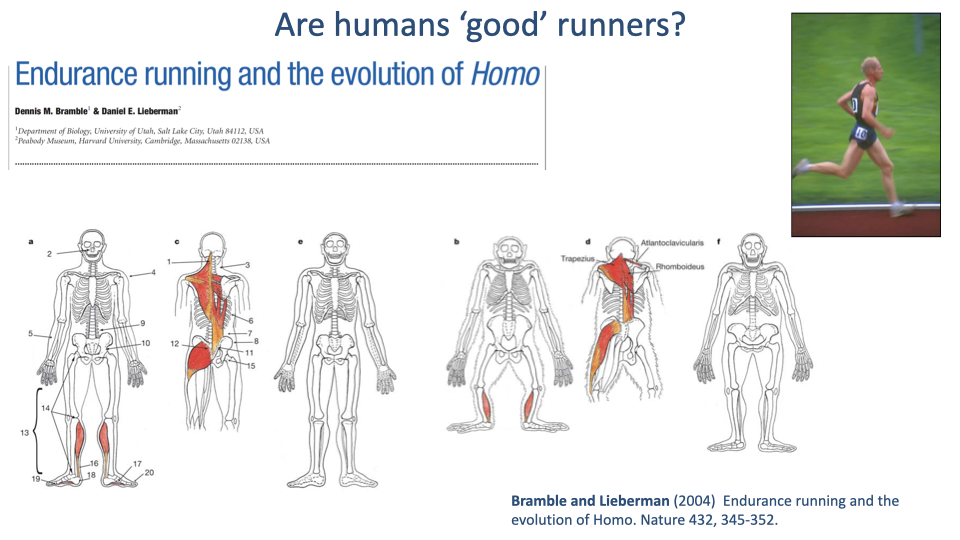
Highlighted Anatomical Features
- Bramble & Lieberman highlight a suite of anatomical features that they argue are running-specific specializations:
- Long legs with straight orientation for inverted-pendulum walking and bouncing running.
- Elaborated tendons (Achilles, plantar arch) for elastic energy cycling.
- Stabilizing trunk and gluteal muscles for upright bipedal striding.
- Trapezius and nuchal ligament for head stabilization during running.
- The argument: these features are uniquely emphasized in humans compared with other great apes, so they reflect selection for running performance in early Homo.
Slide 29
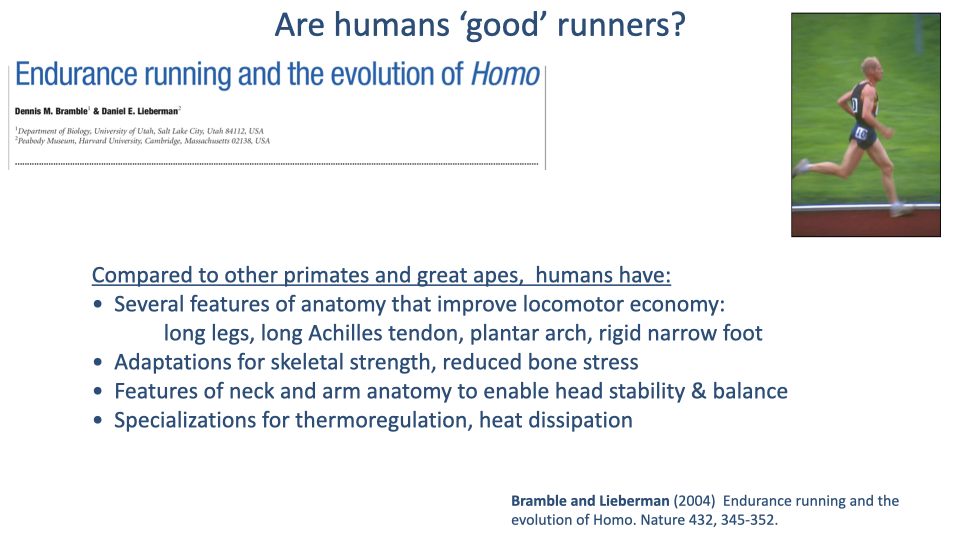
Bramble & Lieberman — Specific Features for Endurance Running
- The paper organizes human-vs-great-ape differences into four categories:
- Locomotor economy — long legs, long Achilles tendon, plantar arch, rigid narrow foot.
- Skeletal strength — reduced bone stress, increased cross-sectional area of long bones.
- Head stability and balance — neck and arm anatomy (nuchal ligament, trapezius arm coupling).
- Thermoregulation and heat dissipation — sweat glands, body hair reduction, breath cooling.
Slide 30
Sustainable Speeds — Humans vs. Quadrupeds
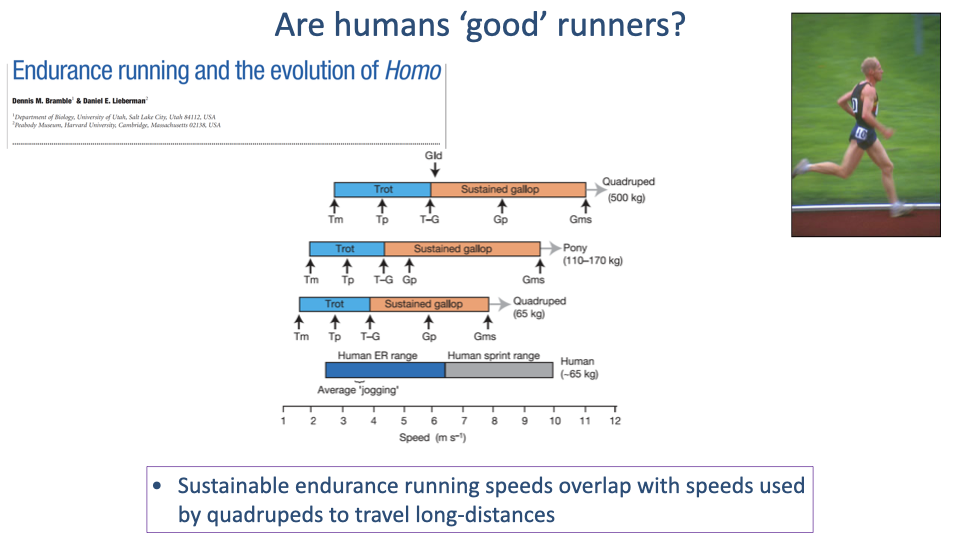
- Speed-range diagram comparing human endurance running with quadruped sustained gaits (trot and gallop) at matched body mass.
- Key observation: human sustainable endurance running speeds overlap with the speeds quadrupeds use to travel long distances.
- The endurance-running hypothesis: this overlap is no accident — humans evolved to sustain quadruped-like trot speeds aerobically as part of persistence hunting — running prey to exhaustion in hot environments.
- Persistence hunting depends on:
- Aerobic endurance — to sustain trot-equivalent speeds for hours.
- Superior thermoregulation — to outlast prey that overheats.
- Cooperative tracking — coordination over long distances does not require winning a sprint.
Slide 31
Bramble & Lieberman — Criticisms
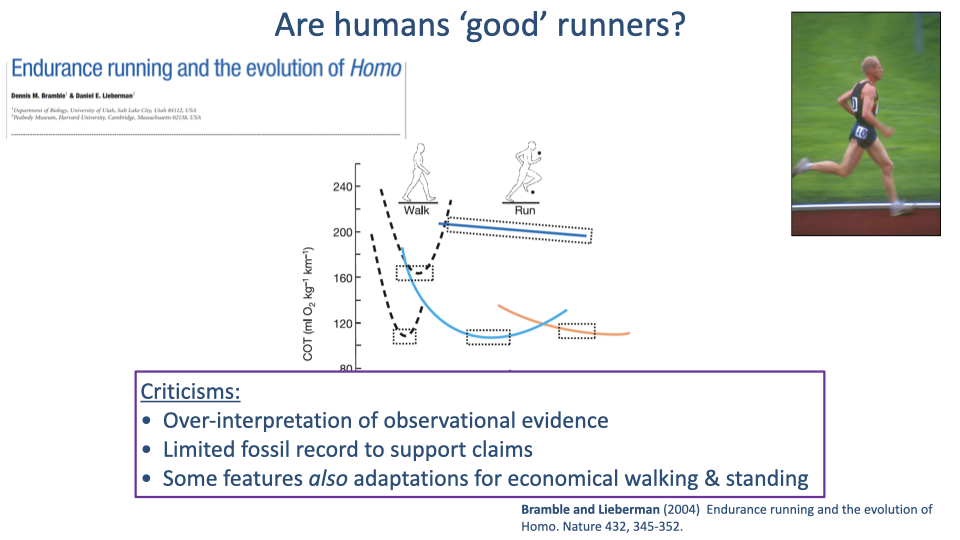
- Three main criticisms of the endurance-running hypothesis:
- Over-interpretation of observational evidence — the case is built largely on anatomical observation and comparison, with limited experimental tests.
- Limited fossil record — direct paleontological evidence for endurance-running behavior in early Homo is scarce; soft-tissue features cannot be directly observed.
- Alternative interpretation: many of the highlighted features (Achilles tendon, plantar arch, long legs, straight knees) are equally good adaptations for economical walking and standing — see the Rubenson et al. result that humans walk 20% more cheaply than expected (Slide 20).
- The debate is unresolved: humans clearly have some features that help with running, but it is hard to say whether running or walking (or both) was the dominant selective pressure.
Slide 32
Foot Strike Patterns — Shod Heel Strike
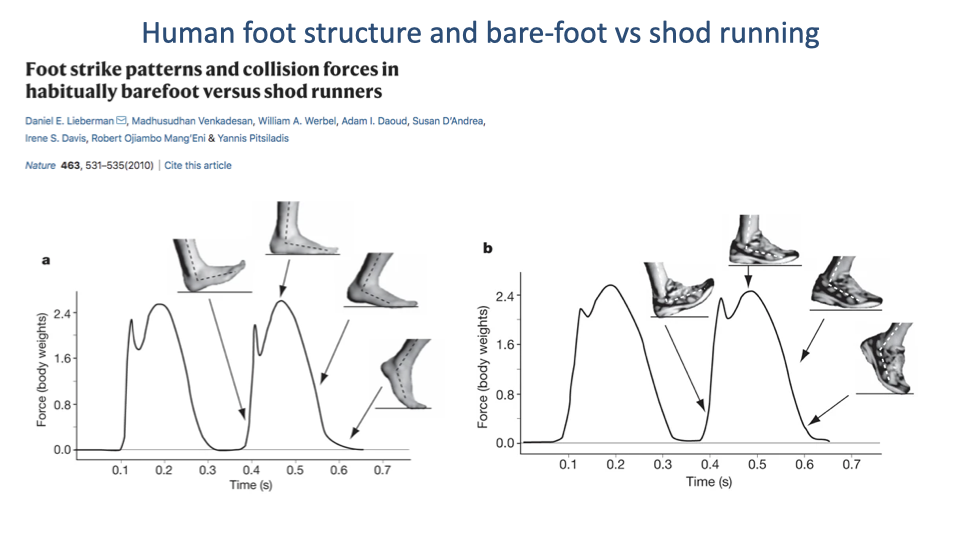
- Lieberman et al. 2010 measured GRF in habitually barefoot vs habitually shod runners.
- Shod runners (and many barefoot runners landing heel-first): the vertical GRF trace shows a distinct early impact peak (≈1.5–2 body weights) corresponding to the abrupt collision of the heel with the ground.
- The impact peak is followed by a larger main loading peak during mid-stance.
- The impact peak represents a rapid loading rate that has been linked to higher rates of running injury.
Slide 33
Barefoot Forefoot Strike Smooths the GRF Trace
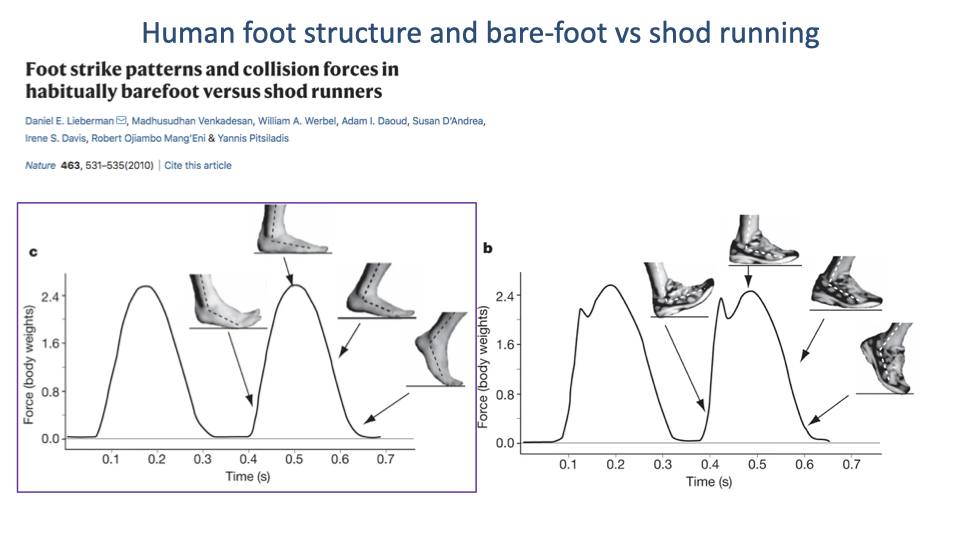
- Barefoot runners typically land on the forefoot/ball of the foot.
- The vertical GRF trace lacks the early impact peak (panel c) — the arch of the foot acts as a spring, absorbing the collision elastically.
- Evolutionary interpretation: the plantar arch and intrinsic foot muscles evolved as a tunable spring for cushioning forefoot landings — consistent with the endurance-running argument.
- Modern shoes with cushioned heels effectively allow heel-first landing without the pain, but bypass the natural spring mechanism of the foot.
- Switching to barefoot/forefoot running takes adaptation and can cause injury in habitually shod runners if done abruptly.
Slide 34
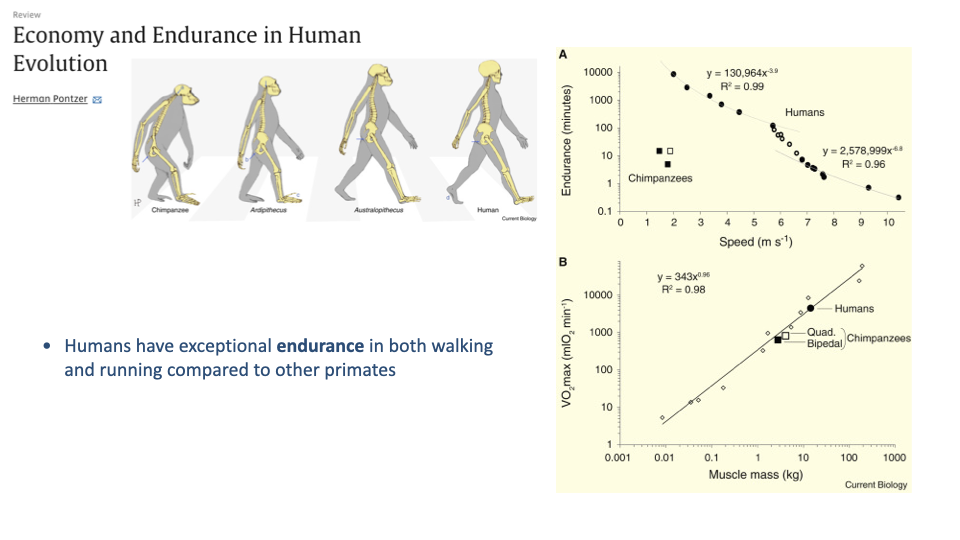
Pontzer — Humans Are Endurance Specialists Compared to Other Primates
- Pontzer compared endurance (time sustainable at a given speed) and VO2max between humans and chimpanzees, our closest living relatives.
- Panel A: humans have dramatically greater endurance than chimpanzees at every speed — orders of magnitude more, at speeds chimpanzees can barely sustain.
- Panel B: human VO2max fits the standard mammalian scaling line with muscle mass — we are not unusual; we simply have more muscle mass than chimpanzees because we are larger.
- Humans are exceptional endurance performers among primates, but our underlying physiology is standard for our muscle mass. The endurance advantage is largely about body size plus biomechanical economy, not about exceptional aerobic capacity.
Slide 35
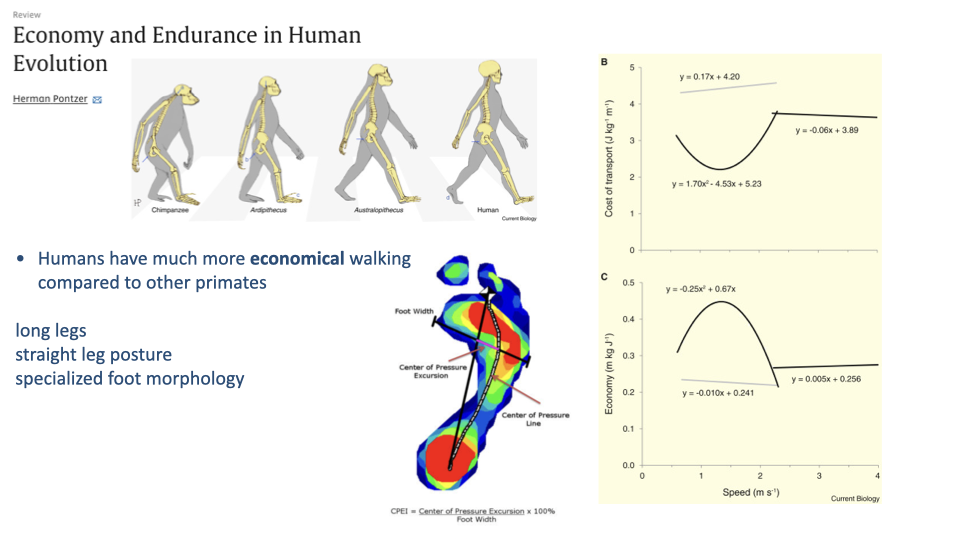
Pontzer — Humans Walk Far More Economically Than Other Primates
- Human walking is far more economical than chimpanzee walking — even when normalized for size.
- Three structural reasons for the economy gap:
- Long legs → long step length, low cycling frequency.
- Straight (extended) leg posture → near-pendulum vaulting, locked knees support body weight passively.
- Specialized foot morphology — center-of-pressure rolls smoothly from heel to toe along the foot’s curved sole, minimizing collisional losses.
- The Center-of-Pressure Excursion Index (CPEI) quantifies this rolling: the longer the COP excursion relative to foot width, the more efficient the roll.
- When the comparative reference is other primates (rather than other mammals), humans are clearly specialized walkers and (probably) runners — though the walking case is the stronger of the two.
Slide 36
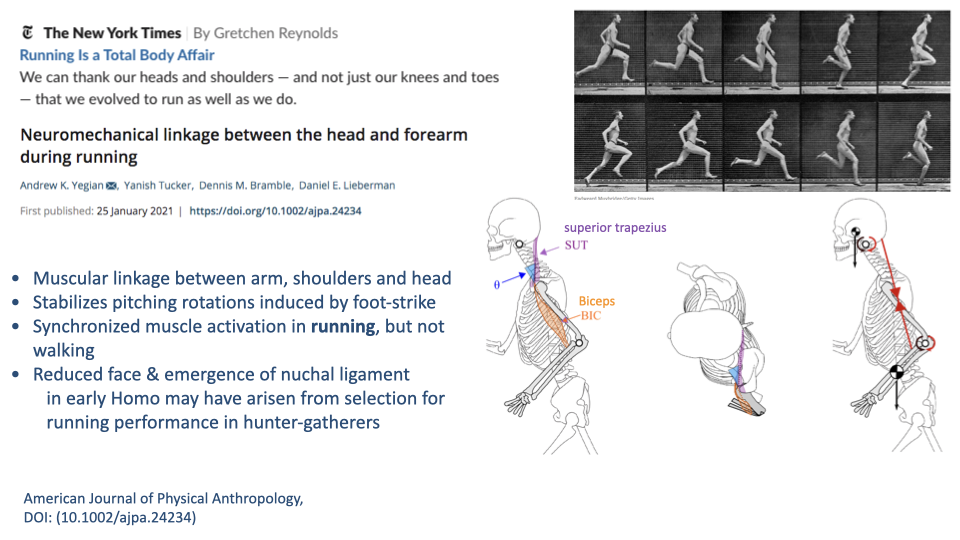
Head Stability — Neuromechanical Linkage Between Arm and Head
- Yegian et al. (Lieberman lab) showed a specific neuromechanical linkage between the forearm and the head during running:
- Synchronized muscle activation of arm, shoulder, and neck muscles during running but not walking.
- Stabilizes the pitching rotations of the head that result from foot-strike impacts.
- Anatomical correlates in early Homo: reduced face mass and emergence of the nuchal ligament — both interpreted as adaptations for head stability during running.
- Adds a piece of evidence to the endurance-running case: it is specific to running, not equally explainable by walking.
Slide 37
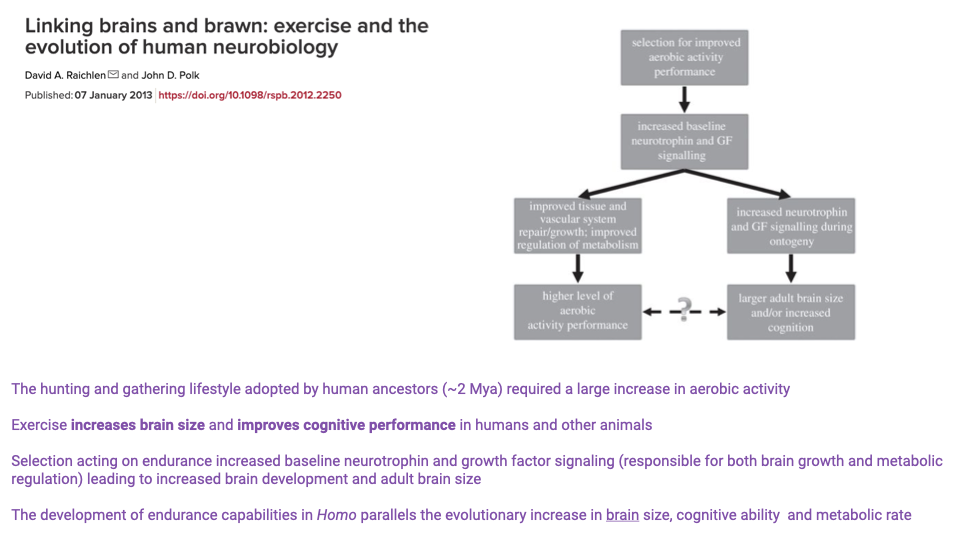
Linking Brains and Brawn — Aerobic Activity and Brain Evolution
- Raichlen & Polk 2013 propose that selection for aerobic endurance in early Homo was a key driver of brain evolution:
- Endurance activity increases neurotrophin and growth-factor signaling.
- These signaling molecules promote both tissue repair/metabolic regulation and neural development.
- The result is larger adult brain size and improved cognition as a coevolutionary side-effect of aerobic specialization.
- Re-framing: rather than “we developed big brains and then became active,” the proposal is “we became active, and big brains came along for the ride.”
- Whether or not the specific mechanism is correct, the temporal correlation in the hominin record between endurance capacity, brain size, and metabolic rate is striking.
Slide 38
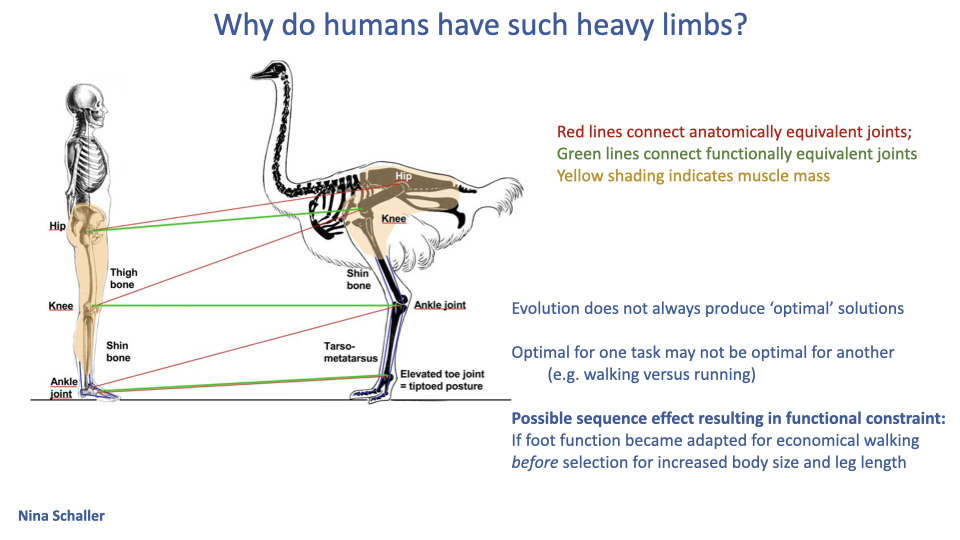
Why Do Humans Have Such Heavy Distal Limbs?
- Human distal-limb morphology is anomalous for a cursorial bipedal: heavier than expected, plantigrade, with a wide flat foot.
- Schaller diagram: when human and ostrich skeletons are aligned by functional joints (green lines) rather than anatomical homologies (red lines), the human “ankle” corresponds functionally to the bird’s mid-shank, not to the ankle.
- Three interpretations:
- Evolution does not produce optimal solutions — it tinkers with what is there.
- Trade-offs between tasks: optimal for walking may not be optimal for running.
- Sequence effect: if humans first became specialized for economical walking (long legs, plantigrade arch-spring foot), and only later acquired longer running endurance, then the heavy plantigrade foot is a historical constraint — the cost of having walked first.
Slide 39
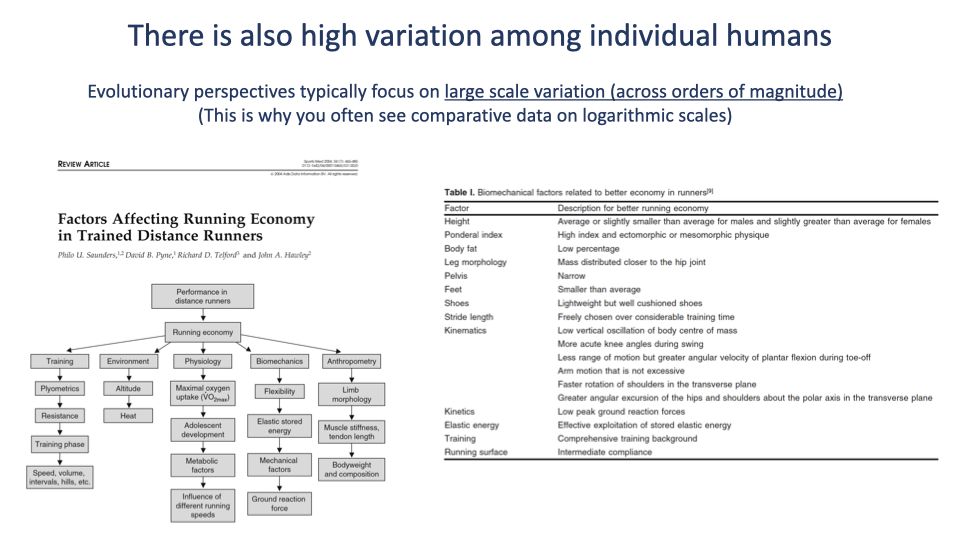
Within-Species Variation in Running Economy
- Beyond the broad comparative trends, individual humans vary enormously in running economy.
- The Saunders flowchart (left) shows that running economy in trained distance runners depends on a complex interplay of:
- Training history and intensity.
- Biomechanical and anthropometric factors (limb proportions, body fat composition).
- Maximal oxygen uptake and substrate metabolism.
- Environmental conditions (heat, altitude, hills).
- The Saunders table (right) catalogs specific anthropometric and kinematic features linked to better running economy.
- Log-log comparative plots like Slide 19 average over individual variation. Within humans, this variation is at least as large as the species-level differences with chimpanzees, and a productive area of contemporary sports-physiology research.
Slide 40
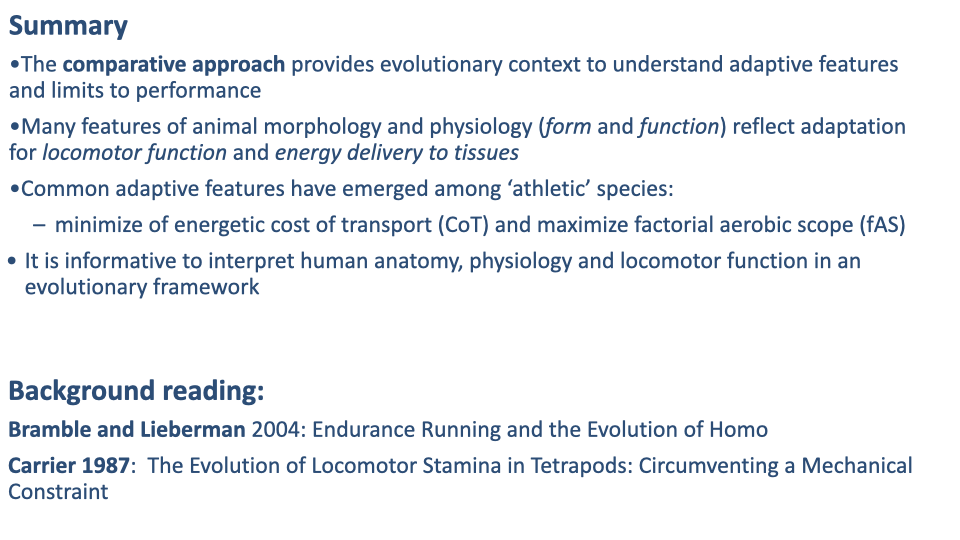
Summary
- The comparative approach provides the evolutionary context for understanding adaptive features and performance limits.
- Many features of form and function in animals reflect adaptation for locomotor function and energy delivery to tissues.
- Common adaptive features among “athletic” species:
- Minimize energetic cost of transport (CoT).
- Maximize factorial aerobic scope (fAS).
- Interpreting human anatomy, physiology, and locomotor function in an evolutionary framework is informative — even when it leaves open questions (e.g., are we running or walking specialists?).
- Background reading:
- Bramble and Lieberman 2004 — Endurance Running and the Evolution of Homo.
- Carrier 1987 — The Evolution of Locomotor Stamina in Tetrapods: Circumventing a Mechanical Constraint.
Slide 41
Learning Objectives Revisited
- Repeat of the learning objectives. Each is now backed by evidence from the lecture:
- Adaptive features for athletic movement — long limbs, upright posture, distal-mass reduction, springy tendons, large body size, high factorial aerobic scope.
- Are humans running specialists? — humans have many cursorial features compared to other primates, but they are also explainable by selection for economical walking. The strongest unambiguous human specialization is thermoregulation (sweat-based evaporative cooling); the strongest physiological signature is economical walking rather than running per se. The debate is open.
Key Equations
| Equation | Name | Description |
|---|---|---|
| $\text{fAS} = \dot{V}O_{2max} / \text{BMR}$ | Factorial aerobic scope | Ratio of maximum to baseline metabolic rate. Athletic species sit on a separate scaling line with 2–4× higher fAS than non-athletic species at the same body size. |
| $\text{fAS}_{athl} = 17.66 \cdot M_b^{0.184}$ | Athletic-species fAS scaling | Allometric fit (Weibel et al.) for athletic mammals. Implies that aerobic scope rises with body mass even within the athletic group. |
| $\text{fAS}_{nonathl} = 8.29 \cdot M_b^{0.100}$ | Non-athletic-species fAS scaling | Companion fit for non-athletic mammals. Lower intercept and shallower slope than the athletic fit. |
| $\text{CoT} \propto M_b^{-0.25}$ | CoT vs body mass scaling | Across runners, CoT decreases as body mass to the −0.25 power on log-log axes (Taylor et al. 1970; updated by Rubenson et al.). |
Glossary of Key Terms
| Term | Definition |
|---|---|
| Cursorial | Adapted for running. Cursorial morphology includes upright parasagittal limbs, elongated distal limbs, reduced distal-limb mass, elaborated tendons, and (often) large body size. |
| Endurance running hypothesis | The proposal (Bramble & Lieberman 2004) that selection for endurance running shaped many of the unique anatomical features of Homo, with persistence hunting as a plausible behavioral context. |
| Persistence hunting | A hunting strategy in which hunters track prey at sustained running speeds in heat until the prey overheats and collapses. Often cited as the selective pressure for human endurance-running adaptations. |
| Plantigrade vs digitigrade vs unguligrade | The three foot postures on the continuum of cursorial specialization. Humans are plantigrade — an unusual posture for a putative running specialist. |
| Factorial aerobic scope (fAS) | $\dot{V}O_{2max} / \text{BMR}$ — how many multiples of basal metabolic rate the animal can sustain. Athletic species sit on a higher scaling line than non-athletic species. |
| Plantar arch | The longitudinal arch of the human foot, supported by the plantar aponeurosis. Acts as a tunable spring that stores and returns elastic energy during running, especially with forefoot landing. |
| Achilles tendon | The long, energy-cycling tendon connecting the gastrocnemius–soleus complex to the calcaneus. Disproportionately long in humans compared to other great apes — often cited as a running adaptation. |
| Plantar aponeurosis | The passive elastic sheet running from the calcaneus to the toe pads, supporting the longitudinal arch. Central to the foot-as-spring view of human running. |
| Center-of-pressure excursion index (CPEI) | A measure of how much the center of pressure rolls forward along the foot during stance, normalized to foot width. Larger excursion → more efficient walking. |
| Nuchal ligament | A passive elastic ligament running along the back of the neck in humans and many cursorial mammals. Helps stabilize the head against pitching during running. Absent or much smaller in other great apes. |
| Carotid rete | A meshwork of arterioles around the carotid artery in many cursorial mammals (e.g., antelope, dogs) that cools the blood supply to the brain via heat exchange with the cooler nasal venous return. Humans lack a carotid rete and instead use whole-body evaporative cooling (sweat). |
| Evaporative cooling (sweat) | A thermoregulation strategy in which the body dissipates heat by evaporating sweat from the skin. Humans have an exceptionally large number of eccrine sweat glands and minimal body hair — one of our strongest unambiguous specializations. |
| Bramble & Lieberman 2004 | Foundational paper proposing the endurance-running hypothesis. Catalogs human anatomical features that they argue are running-specific; critiques include limited fossil evidence and alternative interpretations as walking adaptations. |
| Rubenson et al. reappraisal | Modern re-analysis of human CoT vs body mass showing that human running CoT is ~17% higher than expected for our body mass (less than the original ~50% estimate), while human walking CoT is ~20% lower than expected — a stronger case for walking specialization. |
| Pontzer’s economy and endurance studies | A series of comparative studies showing that humans have dramatically greater endurance than chimpanzees, our VO2max follows the standard mammalian muscle-mass scaling line, and our walking is exceptionally economical relative to other primates. |
| Raichlen & Polk brain-evolution hypothesis | The proposal that selection for endurance activity raised baseline neurotrophin/growth-factor signaling in early Homo, indirectly driving the evolution of large brain size and cognition. |
| Hominin | Member of the human lineage after divergence from the chimpanzee lineage (~6 Mya). Includes Australopithecus, Homo erectus, Homo sapiens, etc. |
| Habitual striding bipedalism | The human pattern of upright, long-stride, two-legged locomotion as the default mode of travel. A derived feature in the hominin lineage relative to other great apes. |
| Forefoot vs rearfoot strike | The pattern of initial foot-ground contact in running. Habitually shod runners often land heel-first (rearfoot strike, with an impact peak in the GRF). Habitually barefoot runners typically land on the forefoot (no impact peak, energy absorbed by the plantar arch). |